

Abstract
Whole exomes of patients with a genetic disorder are nowadays routinely sequenced but interpretation of the identified genetic variants remains a major challenge. The increased availability of population‐based human genetic variation has given rise to measures of genetic tolerance that have been used, for example, to predict disease‐causing genes in neurodevelopmental disorders. Here, we investigated whether combining variant information from homologous protein domains can improve variant interpretation. For this purpose, we developed a framework that maps population variation and known pathogenic mutations onto 2,750 “meta‐domains.” These meta‐domains consist of 30,853 homologous Pfam protein domain instances that cover 36% of all human protein coding sequences. We find that genetic tolerance is consistent across protein domain homologues, and that patterns of genetic tolerance faithfully mimic patterns of evolutionary conservation. Furthermore, for a significant fraction (68%) of the meta‐domains high‐frequency population variation re‐occurs at the same positions across domain homologues more often than expected. In addition, we observe that the presence of pathogenic missense variants at an aligned homologous domain position is often paired with the absence of population variation and vice versa. The use of these meta‐domains can improve the interpretation of genetic variation.
Keywords: evolutionary conservation, ExAC, functional variation, genetic tolerance, HGMD, meta‐domains, pathogenicity, Pfam, protein domain homology, variant interpretation
1. INTRODUCTION
Next‐generation sequencing technologies now allow for the comprehensive identification of all genetic variation in an individual, and exome and genome sequencing are increasingly being used in clinical care to provide a diagnosis for patients with a genetic disorder (Stark et al., 2016; Stavropoulos et al., 2016). The interpretation of the large number of genetic variants present in the exome or genome of a patient is now the major remaining challenge (Gilissen, Hoischen, Brunner, & Veltman, 2012). Filtering strategies that reduce the number of candidate disease‐causing variants make use of information such as the occurrence of variants in the normal and in the diseased population, knowledge about the role of genes in disease, and the predicted effect of specific mutations (Venselaar, Te Beek, Kuipers, Hekkelman, & Vriend, 2010). Algorithms such as Polyphen‐2 (Adzhubei et al., 2010) and CADD (Kircher et al., 2014) are able to predict the pathogenicity of individual variants, but leave room for improvement, especially within a clinical context (Masica & Karchin, 2016; Miosge et al., 2015; Walters‐Sen et al., 2015). Other methods have used population‐wide genetic variation from healthy individuals that is available in large public databases such as the NHLBI Exome Sequencing Project (Fu et al., 2012) and the Exome Aggregation Consortium (ExAC) (Lek et al., 2016) to construct metrics that estimate the genetic tolerance of a gene. Various studies have shown that genetic intolerance of a gene is a strong indicator for a role in severe human diseases such as intellectual disability and other neurodevelopmental disorders (Gilissen et al., 2014; Petrovski, Wang, Heinzen, Allen, & Goldstein, 2013). Metrics such as RVIS (Petrovski et al., 2013) and pLI (Lek et al., 2016) are now being used in conjunction with variant pathogenicity prediction algorithms to improve the interpretation of variants of unknown significance in patients suffering from these disorders.
The continuous growth of catalogues of human genetic variation has made it feasible to investigate genetic tolerance at a finer scale, such as for individual exons of a gene or even domains of a protein. This was done, for example, by Gussow, Petrovski, Wang, Allen, & Goldstein (2016) who developed subRVIS and found that tolerance within a gene varies, and that specific protein domain coding parts of a gene are sometimes much more intolerant than the whole gene. Moreover, the authors found that intolerance to genetic variation within genic sub‐regions significantly correlates with reported pathogenic mutations. These patterns of region‐specific variation in genetic tolerance were also used by Ge et al. (2016) to detect missense‐depleted regions to confirm the pathogenicity of individual variants of unknown significance.
Since its introduction, one of the applications of BLAST (Altschul, Gish, Miller, Myers, & Lipman, 1990) was to identify homologous proteins. Mutations at corresponding locations in these homologues were found to result in similar effects on protein stability (Ashenberg, Gong, & Bloom, 2013). Protein domains are especially interesting as they have homologous relationships spanning many proteins. Because of this, protein domains can also have many homologues that occur within the same species. An example of a framework that annotates protein domains to proteins is Pfam (Finn et al., 2016). The Pfam database is a large collection of protein domain families represented by curated multiple sequence alignments (MSAs) and a hidden Markov model (HMM). In recent work, Miller et al. (2015) combined mutation information from different protein domain homologues to identify mutation hotspots in cancer, and Melloni et al. (2016) used a similar approach to identify cancer driver mutations;. We hypothesized that genetic tolerance found in the regions coding for protein domains may be consistent across other within‐human homologues of that domain and that therefore interpretation of variants in a protein domain can be improved by aggregating population variation over homologous protein domains.
2. MATERIALS AND METHODS
2.1. Mapping of human genomic variation to Pfam domains
We performed a Protein‐Protein BLAST 2.2.31+ (Camacho et al., 2009) for each of the longest translations for all 18,651 human protein‐coding genes in the GENCODE Basic set release 19 GRCh37.p13 (Harrow et al., 2012) to canonical and isoform human protein sequences in UniProtKB/Swiss‐Prot Release 2016_09 (Swiss‐Prot) (Boutet et al., 2016). We then selected the top BLAST result with 100% identity to the query sequence and a BLAST E‐value of 0.01 or less. Pfam‐A 30.0 (Finn et al., 2016) protein domains in the matched Swiss‐Prot sequences were annotated using InterProScan 5.20‐59.0 (Finn et al., 2017). ClustalW2 v2.1 (Larkin et al., 2007) was used to create pair‐wise alignments between the gene translations and Swiss‐Prot sequences. The resulting alignment was then used to map genomic variation onto residues in Swiss‐Prot protein sequences.
2.2. Datasets of population variation and disease‐causing missense variants
Population variation was obtained from the ExAC v0.3.1 dataset (Lek et al., 2016) by selecting all synonymous and missense variants with the PASS filter criteria. For the creation of meta‐domains, we considered missense variants from ExAC with an allele frequency > 0.1%. For validation purposes, we also used two additional sets of ExAC missense variants having >0.5% and >0.05% allele frequency.
We selected a set of disease‐causing missense variants from the Human Gene Mutation Database (HGMD) 2016.2 (Stenson et al., 2014) that have disease‐causing (DM) status, which were subsequently filtered by removing all variants that are identical to PASS variants in ExAC with >0.1% allele frequency. This filtering reduced the original set of HGMD DM missense variants by 0.17%. In addition, we used missense variants from ClinVar (downloaded for GRCh37 on 2017‐06‐15), with disease‐causing (Pathogenic) status, as an additional validation to HGMD DM variants. The filtering of identical PASS variants in ExAC with >0.1% allele frequency, that was used for the HGMD DM set, was applied to this set as well.
2.3. Aggregation of genetic variation onto meta‐domains
In order to aggregate genetic information over protein domain homologues, we considered each Pfam identifier found in more than one gene as a within‐human homologue. In this study, when we mention homologous protein domains, or domain homologues, we refer to Pfam protein domains that are homologous in the protein‐coding regions of the human genome. For each domain found this way, we retrieved the Pfam HMM and the domain protein sequence. We used all the domain sequences that had the same Pfam identifier, together with the Pfam HMM, to generate a MSA using the HMMER 3.1b2 tool (Finn et al., 2015). We used this MSA to combine genetic variants found in homologous protein domains that were aligned to the same Pfam domain positions. Variations on Swiss‐Prot residues in insertions with respect to the Pfam domain MSA were ignored. The percentage of homologous domains aligned to a position (MSA coverage) was determined based on the number of gaps with respect to the Pfam domain.
2.4. Gene Ontology Biological Process enrichment analysis in protein domains
Gene Ontology Biological Process (GOBP) enrichment analysis was performed using the R package dcGOR 1.0.6 (Fang, 2014).
2.5. Computing genetic tolerance via the missense over synonymous ratio
We use the non‐synonymous over synonymous ratio, or score, to quantify genetic tolerance in genes and domains. In our setting, this score is based on the single nucleotide missense and synonymous variants (SNVs) from ExAC in a protein‐coding region (missenseobs and synonymousobs). This score was corrected for the sequence composition of the protein coding region based on the total possible missense and synonymous SNVs (missensebg and synonymousbg): .
2.6. Consistency of genetic tolerance across protein domain homologues
We calculated the median absolute deviation: to measure whether genetic tolerance scores are consistent across homologous domains. For each domain occurrence “” of a homologous domain group “x” we calculate the difference of score to the median. The median of all these differences is then computed as the MAD. The minimal and optimal value of the MAD score is zero, meaning that no score deviates from the median. To test whether the MAD score per homologous domain group is significantly different from another randomly selected group of homologues, we permuted the MAD scores for each homologous domain group using the score of each member in that group and comparing it to the median of another homologous domain group that we selected via the numpy function random.permutation in Python. This permutation test was repeated 10,000 times.
2.7. Evolutionary conservation and population variability
We measured sequence conservation via the relative entropy per position (Sander & Schneider, 1991) in a multiple sequence alignment (MSA) to compute the evolutionary conservation and population variability: . Here, “j" is an aligned position, “R" is the amino acid residue type, “" is the frequency of how often a residue of type “R" occurs at position “j." The relative entropy ranges from 0.0 to 1.0 for conserved to variable. We used the Pfam‐A full alignment for each Pfam domain to compute evolutionary conservation. We used our mappings to assess population variability by extracting missense and synonymous variants and their respective allele frequencies from ExAC to compute the “" variable. To achieve a sufficiently high MSA resolution and certainty of correct entropy we only considered positions for computing the relative entropy that had at least 25 sequences with 80% MSA coverage.
2.8. Quantifying patterns of missense variants in meta‐domains
We created a metric to quantify how often a consensus position in a meta‐domain contains identical missense variants (i.e., two or more homologous domains wherein the aligned residues both are identical in reference and alternative amino acid residues). We call this metric the characteristic missense variant score: . Here “” is the size of meta‐domain “x,” “j” is an aligned domain position, “” are the number of missense variants found in all domain homologues aligned to position “j” and “” are the number of missense variants in “” that are of identical change in amino acid (i.e., that have identical reference residues and change to the same alternate residue). The normalizes the CMVS with respect to the domain size.
We assigned values of significance to patterns of missense variants observed in meta‐domains by comparing these to permuted meta‐domains resulting from Monte Carlo experiments. In these experiments, we shuffled missense variants in each domain occurrence “” To perform this shuffling, we first estimated the probability of a missense variant to occur in “” via , where “” are the number of aligned residues and “” are the number of missense variants found in domain “” Then we estimated the probability for any missense variant to occur on an aligned position “j" by considering the codon of that position with respect to the codon table: . Finally, we distributed missense variants on the domain occurrence by combining these two probabilities and assessing each possible missense variant. The distribution of missense variants was subsequently used to reconstruct a permuted meta‐domain over 1,000 experiments for each meta‐domain.
The patterns of missense variants across homologues were then tested for significance in two different ways. First, we computed per aligned position the ratio of missense variants observed in contrast to the number of domain occurrences aligned. We checked if a position is significantly enriched for either the reference allele or the missense variant allele as compared with the same position in the permuted meta‐domains. We report the meta‐domains for which more than 75% of the positions are significantly different from the permuted meta‐domains. Secondly, we tested whether the entire meta‐domain is significantly enriched for identical variants via NCMVS as compared with the permuted meta‐domain. In both cases, we made our comparisons with the Welch's t‐test and used Bonferroni correction for multiple testing.
3. RESULTS
In total 16,684 GENCODE genes were mapped to Swiss‐Prot protein sequences and annotated with protein domains from Pfam (Methods). We found 5,250 Pfam domains spanning 33,638 domain occurrences in these genes, of which 30,853 made up 2,750 within‐human Pfam domain homologues (Supp. Table S1). We found 961 Pfam domain homologues to occur in exactly two different genes and, on average, a within‐human homologous protein domain occurs in at least six different human genes. The most prevalent domains were the “KRAB domain” (PF01352), “Zinc finger, C2H2 type” (PF00096) and “Protein kinase domain” (PF00069), each being present in more than 300 different human genes. Pfam protein domains covered approximately 41% of coding sequences of the 16,684 genes. In total 1,493,414 synonymous, 2,892,092 missense variants from ExAC, 58,968 DM missense variants from HGMD, and 14,016 Pathogenic missense variants from ClinVar are present in the coding regions of our set of genes. 71% of disease‐causing missense variants from HGMD and 72% pathogenic missense variants from ClinVar occur in Pfam domain regions (Supp. Table S2).
3.1. Tolerance to genetic variation of protein domains
Regions that code for protein domains are sometimes much less tolerant than the whole coding region of a gene (Gussow et al., 2016). Therefore, we first wanted to test how similar tolerance patterns in protein domains are to their respective genes. We used the population‐based variation from ExAC to compute the ratio of missense over synonymous variants (). This, we used as a measure of genetic tolerance scores for all genes and Pfam domains (Supp. Data S1 and S2; Methods). We compared the tolerance measured in genes of different gene sets that are known to have a particular pattern of genetic tolerance (Gilissen et al., 2014), to the tolerance of the regions with protein domains in these genes. We found that protein domains in genes known as intolerant, such as housekeeping genes (Zhu, He, Song, Wang, & Yu, 2008) and genes involved in neurodevelopmental disorders (Lelieveld et al., 2016), are indeed intolerant too (Welch's t‐test P = 4.33e−61 and P = 5.24e−57, respectively; Supp. Tables S3 and S4). Conversely, we found that domains in genes that are known to be tolerant to protein truncating variation and variation in general (MacArthur et al., 2012) are also tolerant to missense variation (Welch's t‐test P = 7.42e−23; Supp. Tables S3 and S4; Figure 1a and b). Thus, we find that protein domains have a similar trend of tolerance as their genes.
Figure 1.
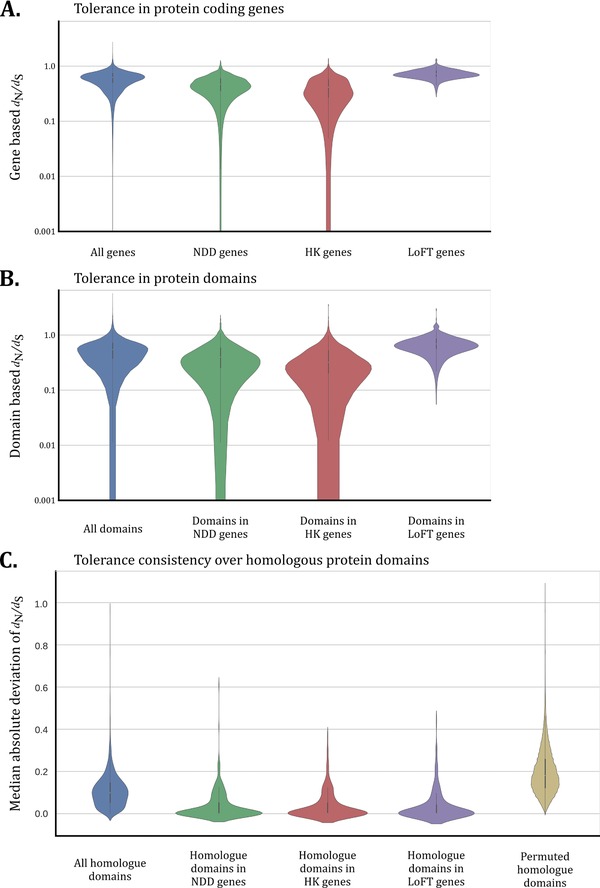
Tolerance in genes, domains, and domain homologues. A: Tolerance to normal genetic variation as measured via the d N/d S ratio (Methods). A higher d N/d S ratio means that the gene is more tolerant to genetic variation and vice versa. From left to right, data are presented for all 16,684 genes (blue), 398 genes involved in neurodevelopmental disorders (green) (Lelieveld et al., 2016), 361 housekeeping genes (red) (Zhu et al., 2008), and 157 loss‐of‐function tolerant genes (purple) (MacArthur et al., 2012). All groups are significantly different (Supp. Table S3). B: As (A) with the exception that the d N/d S ratio is now computed only for domain regions. All 33,638 domains (blue), 1,302 domains in genes involved in neurodevelopmental disorders (green), 811 domains in housekeeping genes (red), and 358 domains present in loss‐of‐function tolerant genes (purple). All groups are significantly different (Supp. Table S4). C: The consistency of d N/d S scores across homologous domains computed via the MAD of the d N/d S (Methods). The lower the MAD score the more consistent is the d N/d S ratio. There are 2,750 Pfam domains that have homologues in our set of genes with a total of 30,853 occurrences (blue). Of the Pfam domains, 383 have a homologue occurring in a gene involved in neurodevelopmental disorders (green), 223 have a homologue occurring in a housekeeping gene (red), and 178 have a homologue occurring in a loss‐of‐function tolerant gene (purple). The permuted domains (yellow) consists of 27,500,000 permutated MAD scores that resulted by computing the MAD score using the median d N/d S of another Pfam domain (Methods). All groups have been found significantly different from the permuted domain group (Supp. Table S5). The impact of different domain sizes on the MAD score is minimal (Supp. Figures S5 and S6)
After establishing that genetic tolerance of a domain mimics that of its respective gene we wondered whether d N/d S scores are consistent across domain homologues. We used the MAD computed over the homologues of a domain to test for the consistency of genetic tolerance (Supp. Data S3; Methods). We find that 2,741 out of 2,750 (99%) aggregated homologues show a consistent pattern of d N/d S scores as compared to what may be expected by chance (Welch's t‐test P < 0.05, Bonferroni corrected; Methods; Supp. Table S5; Figure 1c). The most consistently intolerant domain was the “SRF‐type transcription factor (DNA‐binding and dimerisation domain)” (PF00319) whereas the “Keratin, high‐sulphur matrix protein” (PF04579) is the most consistently tolerant domain (Supp. Tables S6 and S7). These results show that domains have tolerance patterns that are consistent over homologues, and thus that genetic variation in one protein domain is therefore not fully independent from the variation measured in the homologues of that domain. This potentially allows us to aggregate variant information across protein domain homologues.
Interestingly, enrichment analysis for GOBP on the top 5% of most intolerant domains (n = 134) found that these are strongly enriched for biological processes such as chromatin condensation, chromosome organization, and DNA packaging (P = 5.90e−08, P = 7.10e−05, P = 1.10e−05, respectively; Supp. Data S4). This connection to chromatin remodeling has also been observed among dominant genes for neurodevelopmental disorders (Gilissen, Hoischen, Brunner, & Veltman, 2011; Hendrich & Bickmore, 2001; Spielmann & Mundlos, 2016).
3.2. Population variability across domain homologues mimics evolutionary conservation
Although many methods have made use of population‐based genetic variation to assess genetic tolerance, it has remained unclear to what extent population variability complements information from evolutionary conservation. Within‐human protein domain homologues offer the unique opportunity to answer this question. We compared the consistency of population‐based genetic variation with evolutionary conservation across homologous domain positions by investigating 81 Pfam domains that have at least 50 homologous instances in our set of human protein‐coding genes, twice of what we need to ensure high‐quality alignments (Methods). In total, for 6,536 positions of these 81 domains, we measured relative entropies based on population and evolutionary variation in 14,059 human domain instances. We observe a high degree of correlation between these two groups (Pearson = 0.97, P value < 1e−308; Methods; Figure 2a). We validated this result further by splitting the population‐based entropies evenly into two separate groups, each consisting of 25 or more homologous instances. This way we can test for any noise in the computation of within‐human conservation. Again, the relative entropies results in an almost perfect correlation (Pearson = 0.96, P value < 1e−308; Figure 2b). These results show that variation in the human population measured across homologous protein domains faithfully mimics evolutionary conservation, thereby providing support for our proposed approach to aggregate genetic variation across domain homologues.
Figure 2.
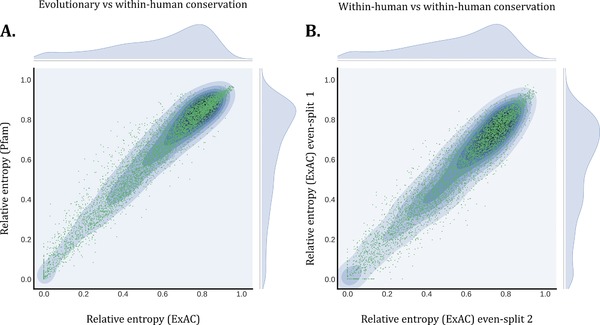
Evolutionary conservation and within‐human conservation in Pfam domains. For 81 domains that have 50 or more homologues within the human genome, we computed the relative entropy to measure the conservation of amino acid residues per position in these domains for both evolutionary conservation based on Pfam and within‐human conservation based on ExAC (Methods). In both plots, the x‐axis and y‐axis represent the relative entropy for a single position in a domain that ranges from 0.0 to 1.0; conserved to variable. A: On the y‐axis evolutionary conservation is represented by the relative entropy per position based on Pfam. The x‐axis shows variability measured solely in the human genome, based on relative entropy computed from ExAC. These two measurements show almost perfect correlation. (Pearson correlation coefficient = Pearson = 0.97, P value < 1e−308). B: A validation of the results presented in A where we split the relative entropy measured solely in the human genome in two, hereby comparing the conservation solely between human protein domains. Again we observe an almost perfect correlation (Pearson correlation coefficient = 0.96, P value < 1e−308)
To establish whether population variation adds additional information for variant interpretation compared with evolutionary conservation, we assessed how disease‐causing and population‐based missense variants are distributed with respect to evolutionary conservation. We expected to find that positions containing disease‐causing variants are conserved in general, whereas positions with genetic missense variants common in the human population are expected to be variable. Therefore, we investigated 17,195 positions in 1,079 Pfam domains with 31,732 disease‐causing missense variants from HGMD. Contrary to what we expected, more than 54% of the positions with a disease‐causing missense variant were found to be evolutionary variable with a relative entropy of 0.5 or higher (Figure 3a). The local maxima, observed between 0.0 and 0.1 relative entropy in Figure 3a, was expected to degrade gradually for higher levels of entropy. As this is a measurement on protein domains, we hypothesize that this local maxima is caused by mutations that affect active site residues. In line with our expectations, when we performed the same analysis for positions with missense variants that have >0.1% allele frequency in ExAC, we found that 77% of these positions are highly variable (Figure 3b). These results highlight that evolutionary conservation is not the perfect indicator for pathogenic mutations, and that population‐based genetic tolerance scores may function as a complementary approach in variant interpretation.
Figure 3.
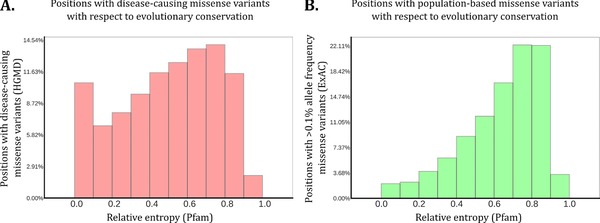
Number of missense variants per position in a meta‐domain in perspective of conservation. Plotted here is the binned distribution of positions that contain one or more missense variant of interest with respect to the evolutionary conservation of the position where these variants occur. The x‐axes are denoted by “Relative entropy (Pfam)” and the y‐axes are marked as the overall percentage of these positions. The figure shows that disease‐causing missense variants also affect very variable sites. A: 17,195 different positions spanning 1,079 Pfam domains. On these positions, 31,732 disease‐causing missense variants from HGMD were found in 22,651 domain occurrences in the human genome. Of these positions, 54% have relative entropy 0.5 or higher. B: 13,571 different positions spanning 1,965 Pfam domains. On these positions, 17,258 missense variants with an allele frequency above 0.1% in ExAC were found in 27,767 domain occurrences. 77% of these positions have relative entropy 0.5 or higher
3.3. Creation of meta‐domains by aggregating genetic variation over domain homologues
Based on our results that genetic variation is consistent across human protein domain homologues, and that population‐based genetic variation correlates faithfully with evolutionary conservation, we hypothesized that genetic variation can be aggregated across homologous domains to provide a more detailed map of genetic variation. Hence, we projected disease‐causing and population‐based missense variation found in human protein domains onto Pfam domain consensus positions giving rise to a “meta‐domain” (Methods; Figure 4). In total, we successfully projected 20,404 population‐based missense variants with >0.1 % allele frequency from ExAC, 35,069 disease‐causing missense mutations from HGMD, and 8,569 pathogenic missense mutations from ClinVar (Supp. Data S5; Methods). We tested whether there was any overlap between the pathogenic and population‐based missense variants on aligned positions by comparing HGMD DM with ExAC and found a negative correlation (Pearson = −0.51, P value < 1e−308; Supp. Figure S1) indicating that disease‐causing missense variants at aggregated domain positions often are paired with the absence high‐frequency population missense variants and vice versa. This suggests that the information annotated to the meta‐domains may be used to enhance variant interpretation.
Figure 4.
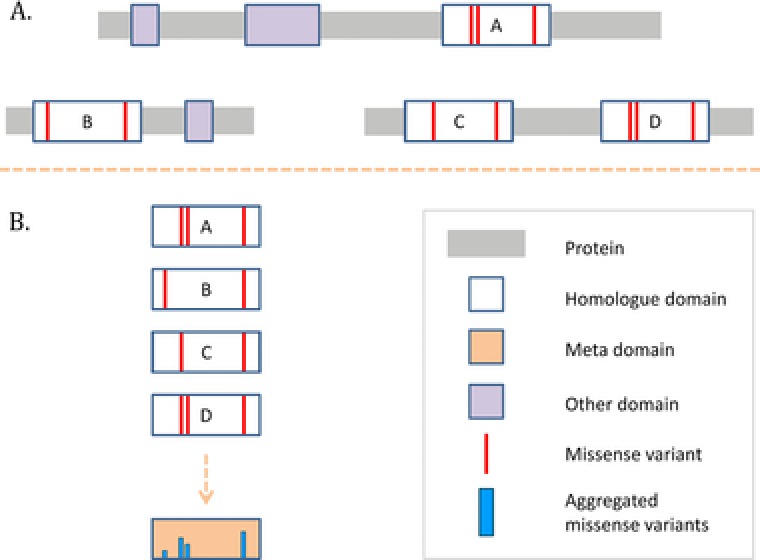
Meta‐domain construction in a schematic representation. Genetic information is aggregated into a meta‐domain based on domain homology. A: In this specific example, there are three human proteins (indicated by the gray bars) with four domains that are found to have the same Pfam domain identifier and therefore belong to the same homologous domain group (indicated by A, B, C, and D). Red vertical lines in these domains indicate missense variants. There are other domains found in these proteins, but these are not further used in this specific example. B: The homologous domains together with their respective missense variants are extracted from the proteins and are aligned according to the Pfam domain. Based on the alignment, the missense variants are then aggregated into a meta‐domain. Some of these missense variants were aligned to the same position, in the meta‐domain this is expressed with a higher blue column
To further confirm that aggregation of variants to Pfam domain consensus positions is meaningful, we perform two separate analyses. We first performed Monte Carlo experiments to test whether missense variants re‐occur at the same position in domain homologues more often than could be expected by chance. We find that high‐frequency population missense variants in 68% of the meta‐domains re‐occur at the majority of the aligned positions, and that this is significantly different from what may be expected by chance (Bonferroni corrected P < 0.05 Welch's t‐test; Supp. Data S6 and S7; Methods). Similarly, we find that HGMD DM and ClinVar Pathogenic missense variants, in 65% and 62% of the meta‐domains respectively, re‐occur at the majority of the aligned positions (Bonferroni corrected P < 0.05 Welch's t‐test; Supp. Data S6 and S7). This analysis shows that the re‐occurrence of missense variants found at aligned positions over all domain homologues follows a non‐random pattern.
In our second analysis, again we perform Monte Carlo experiments and compute for each meta‐domain our NCMVS metric to quantify how many missense variants, which re‐occur at the same position, are also of identical change in amino acid (Methods). This way we find that high‐frequency population missense variants in 21% of the meta‐domains have significantly more variants of identical change at aligned positions across homologues as compared to what may be expected by chance. The pathogenic missense variants from HGMD DM and ClinVar Pathogenic datasets show a similar signal, with 23% and 18% respectively, of the meta‐domains having an enriched NCMVS (Bonferroni correction P < 0.05 Welch's t‐test; Supp. Data S7; Methods). This second analysis shows that the change in amino acid of missense variants found over all domain homologues is for a large set of domains more often identical than what may be expected by chance.
The results of these two analyses find that missense variation in domains follow a non‐random pattern. Such a non‐random pattern in pathogenic variants suggests that specific positions in domains are more likely to have a pathogenic effect via missense variants as compared to other positions. Conversely, finding a non‐random pattern for re‐occurring high‐frequency population missense variants provides insight into positions that are genetically tolerant. These findings support our hypothesis that variant information can be aggregated across homologous domains, and that aggregation may help to interpret variants of unknown significance.
3.4. Investigating a meta‐domain in detail
To illustrate how these meta‐domains can straightforwardly be used to improve variant interpretation we investigated one meta‐domain in detail; the “EGF‐like domain” (PF00008). This domain has 244 homologous occurrences in 60 different human genes (Figure 5). The “EGF‐like domain” has the second highest NCMVS in the context of HGMD DM missense variants, and the 13th highest based on high‐frequency population variants (Supp. Data S7). This suggests that the majority of variants often re‐occur at aligned positions across the 244 homologues as identical changes in amino acids. Based on what is known from EGF‐like domains, any changes to the conserved cysteines will cause loss of a stabilizing disulfide bond that are necessary for the structure of the domain (Wouters et al., 2005). As expected, we find that the highly conserved cysteines are indeed enriched for disease‐causing variants across the 244 homologues. Furthermore, all of the conserved cysteines are depleted for population‐based missense variants, with the exception of consensus position six, confirming the importance of these residues. For consensus position six we observe that population variation is present in only one homologue. This specific variant in NOTCH4 (p.Cys815Gly, rs150079294) has an allele frequency 0.1632% in ExAC. dbSNP suggests that this variant is benign based on a single study (Chassaing et al., 2016; Sherry et al., 2001), whereas our results further support the notion that this variant is problematic for this domain because of almost complete absence of common variation across the homologues. Even more interesting are the positions that are not evolutionary conserved (>0.6 relative entropy), but nevertheless depleted of population‐based missense variation. In this “EGF‐like domain” example, we find one such position at 21. In support of our hypothesis, we find multiple disease‐causing missense mutations in different homologous domains at this position. We find that these disease‐causing mutations have been previously linked to CADASIL (OMIM #125310, p.Tyr337Cys, p.Tyr1021Cys, p.Tyr1069Cys in NOTCH3 (Q9UM47). CADASIL is an adult‐onset autosomal dominant hereditary stroke disorder (Joutel et al., 1996). Other mutations aligned to this consensus position are p.Tyr690Asp in JAG1 (P78604) associated with Biliary atresia extrahepatic (OMIM %210500), a disorder in infants that is fatal within the first two years of life when untreated (Bates, Bucuvalas, Alonso, & Ryckman, 1998; Leyva‐Vega et al., 2010), and p.Arg628Cys in CRB2 (Q5IJ48) associated with Nephrotic syndrome steroid resistant (OMIM #616220), a childhood onset renal disorder (Ebarasi et al., 2015).
Figure 5.
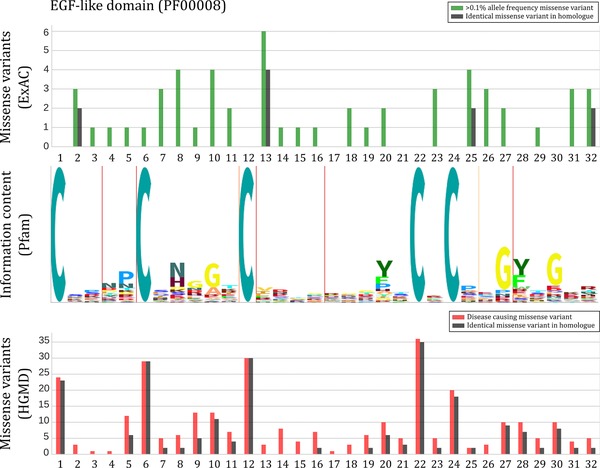
An example of the EGF‐like domain, represented as a meta‐domain. The “EGF‐like domain” (PF00008) occurring in 60 different human genes found to be significantly enriched for identical disease‐causing missense variants across 244 homologues. x‐axis shows the amino acid positions of this domain. The green bars in the top panel indicate how many missense variants with >0.1% allele frequency from ExAC are found over the 244 homologous domains. The black bars indicate the number of missense variants that are of identical chance in amino acid (i.e., having identical reference and alternate residues). The middle panel denotes the Pfam HMM sequence logo generated via the Skylign tool (Wheeler, Clements, & Finn, 2014) where the height of each stack of residues indicates the relative entropy for that position. The thin red vertical lines in the sequence logo denote regions prone to contain deletions and the orange lines are regions prone to insertions based on the Pfam HMM. In the bottom panel, red bars indicate the number of a disease‐causing variant found across the 244 homologous domains. Black bars again indicate identical mutations. A comparison with ClinVar was made as well, albeit the dataset is much sparser as compared to HGMD (Supp. Figure S7)
These results illustrate how meta‐domains can be straightforwardly used to improve the interpretation of genetic variants of unknown significance. We have made our mapping of genomic positions to meta‐domain identifiers and consensus positions available for the wider genetic community to make use of in Supp. Data S8.
4. DISCUSSION
Here, we combined two distinct concepts into a novel method for variant interpretation. Firstly, we used the observation that mutations at aligned positions in homologous proteins commonly lead to the same or similar effects on those proteins’ structure and function. Secondly, large datasets of population scale exome data have made it possible to determine the degree of intolerance to genetic variation for individual genes in order to identify potential disease genes. We combined these two concepts by aggregating population variation across homologous protein domain positions and thereby achieving single base resolution for genetic intolerance. As genetic data accumulates in the coming years, our method will become more and more accurate in predictions of intolerance at the single base pair level (Supp. Figures S2 and S3).
To quantify genetic tolerance in genes, protein domains and domain homologues (Figure 1) we made use of the d N/d S score rather than other well‐established tolerance scores such as pLI (Lek et al., 2016), RVIS (Petrovski et al., 2013), and subRVIS (Gussow et al., 2016). The d N/d S metric was originally intended for detecting selective evolutionary pressure in protein‐coding regions and genomes (Li, Wu, & Luo, 1985; Yang & Bielawski, 2000; Yang et al., 2000), and has previously been used by us and others to measure genetic tolerance and predict disease genes (Ge, Kwok, & Shieh, 2015, 2016; Gilissen et al., 2014). Our choice for this score was motivated by the fact that the mentioned tolerance scores typically capture a more general notion of tolerance to genetic variation and are not designed to measure tolerance for any specific genic region of interest.
Contrary to our expectations we found that 54% of disease‐causing missense variants are evolutionary variable. There are some explanations why we find this result: Firstly, we did not take into account whether disease‐causing variants asserted their effect in a dominant or a recessive fashion. We know that mutations in dominant disease genes are in general more conserved than mutations in recessive genes. Secondly, we know that not all disease‐causing variants have the same severity in terms of fitness. For example, mutations causing infertility will be much more selected against than mutations causing genetic deafness. Thirdly, a large percentage of HGMD DM variants used to be present in recent population databases and may therefore be incorrect (Cassa, Tong, & Jordan, 2013). Although in the version we used this number was significantly reduced, some may still be present (Abouelhoda, Faquih, El‐Kalioby, & Alkuraya, 2016; Pinard et al., 2016). Finally, our comparison does not account for unobserved (potentially lethal) variants, as many of these variants are likely to have never been observed, nor ever will be.
In our meta‐domains, we tested whether high‐frequency missense variants with an allele frequency > 0.1% in ExAC are repeatedly enriched or depleted on Pfam domain consensus positions. This strict cut‐off of 0.1% may cause us to miss variants with allele frequencies smaller than 0.1% at corresponding positions in homologues. We choose this cut‐off in order to exclude the possibility of artifacts in the ExAC database, and for increasing the likelihood that variation is truly benign. Setting a stricter threshold such as 0.5% decreases the number of ExAC missense variants in meta‐domains by 56%. Allowing for a less stringent cut‐off will add a substantial amount of genetic variation to our model that would improve our sensitivity, but likely at the cost of specificity (Supp. Figure S4 and Supp. Data S9). We expect there is still much to be gained from these “rare” variants found in population cohorts. Furthermore, we note that by aggregating genetic variation, the specific context such as haplotype information or interactions with other proteins may be lost. An aggregation may only encapsulate general biological or molecular functions attributed to the domain. Nonetheless, we believe these meta‐domains can be used to better interpret variants of unknown significance simply based on our pre‐calculated meta‐domains (Supp. Data S5 and S8), but also by incorporating these results in existing methods for variant effect prediction.
Supporting information
Supporting Material
Supporting Material
Supporting Material
Supporting Material
Supporting Material
Supporting Material
Supporting Material
Supporting Material
Supporting Material
Supporting Material
ACKNOWLEDGMENTS
We thank Susanne Roosing for her suggestions on data presentation, and Tom Heskes for his advice on the statistical analyses.
DISCLOSURE STATEMENT
The authors declare no conflict of interest.
Wiel L, Venselaar H, Veltman JA, Vriend G, Gilissen C. Aggregation of population‐based genetic variation over protein domain homologues and its potential use in genetic diagnostics. Human Mutation. 2017;38:1454–1463. https://doi.org/10.1002/humu.23313
Funding information Contract grant sponsors: The Netherlands Organization for Scientific Research (916‐14‐043 and 918‐15‐667); Radboud Institute for Molecular Life Sciences; Radboud University Medical Center (R0002793).
Communicated by A. Jamie Cuticchia
REFERENCES
- Abouelhoda, M. , Faquih, T. , El‐Kalioby, M. , & Alkuraya, F. S. (2016). Revisiting the morbid genome of Mendelian disorders. Genome Biology, 17, 235. [DOI] [PMC free article] [PubMed] [Google Scholar]
- Adzhubei, I. A. , Schmidt, S. , Peshkin, L. , Ramensky, V. E. , Gerasimova, A. , Bork, P. , … Sunyaev, S. R. (2010). A method and server for predicting damaging missense mutations. Nature Methods, 7, 248–249. [DOI] [PMC free article] [PubMed] [Google Scholar]
- Altschul, S. F. , Gish, W. , Miller, W. , Myers, E. W. , & Lipman, D. J. (1990). Basic local alignment search tool. Journal of Molecular Biology, 215, 403–410. [DOI] [PubMed] [Google Scholar]
- Ashenberg, O. , Gong, L. I. , & Bloom, J. D. (2013). Mutational effects on stability are largely conserved during protein evolution. Proceeding of the National Academy of Science of the United States of America, 110, 21071–21076. [DOI] [PMC free article] [PubMed] [Google Scholar]
- Bates, M. D. , Bucuvalas, J. C. , Alonso, M. H. , & Ryckman, F. C. (1998). Biliary atresia: Pathogenesis and treatment. Seminars in Liver Diseases, 18, 281–293. [DOI] [PubMed] [Google Scholar]
- Boutet, E. , Lieberherr, D. , Tognolli, M. , Schneider, M. , Bansal, P. , Bridge, A. J. , … Xenarios, I. (2016). UniProtKB/Swiss‐Prot, the manually annotated section of the UniProt KnowledgeBase: How to use the entry view. Methods in Molecular Biology, 1374, 23–54. [DOI] [PubMed] [Google Scholar]
- Camacho, C. , Coulouris, G. , Avagyan, V. , Ma, N. , Papadopoulos, J. , Bealer, K. , & Madden, T. L. (2009). BLAST+: Architecture and applications. BMC Bioinformatics, 10, 421. [DOI] [PMC free article] [PubMed] [Google Scholar]
- Cassa, C. A. , Tong, M. Y. , & Jordan, D. M. (2013). Large numbers of genetic variants considered to be pathogenic are common in asymptomatic individuals. Human Mutation, 34, 1216–1220. [DOI] [PMC free article] [PubMed] [Google Scholar]
- Chassaing, N. , Davis, E. E. , McKnight, K. L. , Niederriter, A. R. , Causse, A. , David, V. , … Calvas, P. (2016). Targeted resequencing identifies PTCH1 as a major contributor to ocular developmental anomalies and extends the SOX2 regulatory network. Genome Research, 26, 474–485. [DOI] [PMC free article] [PubMed] [Google Scholar]
- Ebarasi, L. , Ashraf, S. , Bierzynska, A. , Gee, H. Y. , McCarthy, H. J. , Lovric, S. , … Majumdar, A. (2015). Defects of CRB2 cause steroid‐resistant Nephrotic Syndrome. American Journal of Human Genetics, 96, 153–161. [DOI] [PMC free article] [PubMed] [Google Scholar]
- Fang, H. (2014). dcGOR: An R package for analysing ontologies and protein domain annotations. PLoS Computational Biology, 10, e1003929. [DOI] [PMC free article] [PubMed] [Google Scholar]
- Finn, R. D. , Attwood, T. K. , Babbitt, P. C. , Bateman, A. , Bork, P. , Bridge, A. J. , … Mitchell, A. L. (2017). InterPro in 2017—beyond protein family and domain annotations. Nucleic Acids Research, 45, D190–D199. [DOI] [PMC free article] [PubMed] [Google Scholar]
- Finn, R. D. , Clements, J. , Arndt, W. , Miller, B. L. , Wheeler, T. J. , Schreiber, F. , … Eddy, S. R. (2015). HMMER web server: 2015 update. Nucleic Acids Research, 43, W30–W38. [DOI] [PMC free article] [PubMed] [Google Scholar]
- Finn, R. D. , Coggill, P. , Eberhardt, R. Y. , Eddy, S. R. , Mistry, J. , Mitchell, A. L. , … Bateman, A. (2016). The Pfam protein families database: Towards a more sustainable future. Nucleic Acids Research, 44, D279–85. [DOI] [PMC free article] [PubMed] [Google Scholar]
- Fu, W. , O'Connor, T. D. , Jun, G. , Kang, H. M. , Abecasis, G. , Leal, S. M. , … Akey, J. M. (2012). Analysis of 6,515 exomes reveals the recent origin of most human protein‐coding variants. Nature, 493, 216–220. [DOI] [PMC free article] [PubMed] [Google Scholar]
- Ge, X. , Gong, H. , Dumas, K. , Litwin, J. , Phillips, J. J. , Waisfisz, Q. , … Shieh, J. T. C. (2016). Missense‐depleted regions in population exomes implicate ras superfamily nucleotide‐binding protein alteration in patients with brain malformation. npj Genomic Medicine, 1, 16036. [DOI] [PMC free article] [PubMed] [Google Scholar]
- Ge, X. , Kwok, P‐Y. , & Shieh, J. T. C. (2015). Prioritizing genes for X‐linked diseases using population exome data. Human Molecular Genetics, 24, 599–608. [DOI] [PMC free article] [PubMed] [Google Scholar]
- Gilissen, C. , Hehir‐Kwa, J. Y. , Thung, D. T. , van de Vorst, M. , van Bon, B. W. M. , Willemsen, M. H. , … Veltman, J. A. (2014). Genome sequencing identifies major causes of severe intellectual disability. Nature, 511, 344–347. [DOI] [PubMed] [Google Scholar]
- Gilissen, C. , Hoischen, A. , Brunner, H. G. , & Veltman, J. A. (2011). Unlocking Mendelian disease using exome sequencing. Genome Biology, 12, 228. [DOI] [PMC free article] [PubMed] [Google Scholar]
- Gilissen, C. , Hoischen, A. , Brunner, H. G. , & Veltman, J. A. (2012). Disease gene identification strategies for exome sequencing. European Journal of Human Genetics, 20, 490–497. [DOI] [PMC free article] [PubMed] [Google Scholar]
- Gussow, A. B. , Petrovski, S. , Wang, Q. , Allen, A. S. , & Goldstein, D. B. (2016). The intolerance to functional genetic variation of protein domains predicts the localization of pathogenic mutations within genes. Genome Biology, 17, 9. [DOI] [PMC free article] [PubMed] [Google Scholar]
- Harrow, J. , Frankish, A. , Gonzalez, J. M. , Tapanari, E. , Diekhans, M. , Kokocinski, F. , … Hubbard, T. J. (2012). GENCODE: The reference human genome annotation for The ENCODE Project. Genome Research, 22, 1760–1774. [DOI] [PMC free article] [PubMed] [Google Scholar]
- Hendrich, B. , & Bickmore, W. (2001). Human diseases with underlying defects in chromatin structure and modification. Human Molecular Genetics, 10, 2233–2242. [DOI] [PubMed] [Google Scholar]
- Joutel, A. , Corpechot, C. , Ducros, A. , Vahedi, K. , Chabriat, H. , Mouton, P. , … Tournier‐Lasserve, E. (1996). Notch3 mutations in CADASIL, a hereditary adult‐onset condition causing stroke and dementia. Nature, 383, 707–710. [DOI] [PubMed] [Google Scholar]
- Kircher, M. , Witten, D. M. , Jain, P. , O'Roak, B. J. , Cooper, G. M. , & Shendure, J. (2014). A general framework for estimating the relative pathogenicity of human genetic variants. Nature Genetics, 46, 310–315. [DOI] [PMC free article] [PubMed] [Google Scholar]
- Larkin, M. A. , Blackshields, G. , Brown, N. P. , Chenna, R. , McGettigan, P. A. , McWilliam, H. , … Higgins, D. G. (2007). Clustal W and Clustal X version 2.0. Bioinformatics, 23, 2947–2948. [DOI] [PubMed] [Google Scholar]
- Lek, M. , Karczewski, K. J. , Minikel E, V. , Samocha, K. E. , Banks, E. , Fennell, T. , … MacArthur, D. G. (2016). Analysis of protein‐coding genetic variation in 60,706 humans. Nature, 536, 285–291. [DOI] [PMC free article] [PubMed] [Google Scholar]
- Lelieveld, S. H. , Reijnders, M. R. F. , Pfundt, R. , Yntema, H. G. , Kamsteeg, E. , de Vries, P. , … Gilissen, C. (2016). Meta‐analysis of 2,104 trios provides support for 10 new genes for intellectual disability. Nat Neuroscience, 19, 1194–1196. [DOI] [PubMed] [Google Scholar]
- Leyva‐Vega, M. , Gerfen, J. , Thiel, B. D. , Jurkiewicz, D. , Rand, E. B. , Pawlowska, J. , … Spinner, N. B. (2010). Genomic alterations in biliary atresia suggest region of potential disease susceptibility in 2q37.3. American Journal of Medical Genetics A, 152A, 886–895. [DOI] [PMC free article] [PubMed] [Google Scholar]
- Li, W. H. , Wu, C. I. , & Luo, C. C. (1985). A new method for estimating synonymous and nonsynonymous rates of nucleotide substitution considering the relative likelihood of nucleotide and codon changes. Molecular Biology and Evolution, 2, 150–174. [DOI] [PubMed] [Google Scholar]
- MacArthur, D. G. , Balasubramanian, S. , Frankish, A. , Huang, N. , Morris, J. , Walter, K. , … Tyler‐Smith, C. (2012). A systematic survey of loss‐of‐function variants in human protein‐coding genes. Science, 335, 823–828. [DOI] [PMC free article] [PubMed] [Google Scholar]
- Masica, D. L. , & Karchin, R. (2016). Towards increasing the clinical relevance of in silico methods to predict pathogenic missense variants. PLoS Computational Biology, 12, e1004725. [DOI] [PMC free article] [PubMed] [Google Scholar]
- Melloni, G. E. M. , de Pretis, S. , Riva, L. , Pelizzola, M. , Céol, A. , Costanza, J. , … Zammataro, L. (2016). LowMACA: Exploiting protein family analysis for the identification of rare driver mutations in cancer. BMC Bioinformatics, 17, 80. [DOI] [PMC free article] [PubMed] [Google Scholar]
- Miller, M. L. , Reznik, E. , Gauthier, N. P. , Aksoy, B. A. , Korkut, A. , Gao, J. , … Sander, C. (2015). Pan‐cancer analysis of mutation hotspots in protein domains. Cell Systems, 1, 197–209. [DOI] [PMC free article] [PubMed] [Google Scholar]
- Miosge, L. A. , Field, M. A. , Sontani, Y. , Cho, V. , Johnson, S. , Palkova, A. , … Andrews, T. D. (2015). Comparison of predicted and actual consequences of missense mutations. Proceedings of the National Academy of Sciences of the United States of America, 112, E5189–98. [DOI] [PMC free article] [PubMed] [Google Scholar]
- Petrovski, S. , Wang, Q. , Heinzen, E. L. , Allen, A. S. , & Goldstein, D. B. (2013). Genic intolerance to functional variation and the interpretation of personal genomes. PLoS Genetics, 9, e1003709. [DOI] [PMC free article] [PubMed] [Google Scholar]
- Pinard, A. , Miltgen, M. , Blanchard, A. , Mathieu, H. , Desvignes, J‐P. , Salgado, D. , … Collod‐Béroud, G. (2016). Actionable genes, core databases, and locus‐specific databases. Human Mutation, 37, 1299–1307. [DOI] [PubMed] [Google Scholar]
- Sander, C. , & Schneider, R. (1991). Database of homology‐derived protein structures and the structural meaning of sequence alignment. Proteins, 9, 56–68. [DOI] [PubMed] [Google Scholar]
- Sherry, S. T. , Ward, M. H. , Kholodov, M. , Baker, J. , Phan, L. , Smigielski, E. M. , & Sirotkin, K. (2001). dbSNP: The NCBI database of genetic variation. Nucleic Acids Research, 29, 308–311. [DOI] [PMC free article] [PubMed] [Google Scholar]
- Spielmann, M. , & Mundlos, S. (2016). Looking beyond the genes: The role of non‐coding variants in human disease. Human Molecular Genetics, 25, R157–R165. [DOI] [PubMed] [Google Scholar]
- Stark, Z. , Tan, T. Y. , Chong, B. , Brett, G. R. , Yap, P. , Walsh, M. , … White, S. M. (2016). A prospective evaluation of whole‐exome sequencing as a first‐tier molecular test in infants with suspected monogenic disorders. Genetics Medicine, 18, 1090–1096. [DOI] [PubMed] [Google Scholar]
- Stavropoulos, D. J. , Merico, D. , Jobling, R. , Bowdin, S. , Monfared, N. , Thiruvahindrapuram, B. , … Marshall, C. R. (2016). Whole‐genome sequencing expands diagnostic utility and improves clinical management in paediatric medicine. npj Genomic Medicine, 1, 15012. [DOI] [PMC free article] [PubMed] [Google Scholar]
- Stenson, P. D. , Mort, M. , Ball E, V. , Shaw, K. , Phillips, A. D. , & Cooper, D. N. (2014). The Human Gene Mutation Database: Building a comprehensive mutation repository for clinical and molecular genetics, diagnostic testing and personalized genomic medicine. Human Genetics, 133, 1–9. [DOI] [PMC free article] [PubMed] [Google Scholar]
- Venselaar, H. , Te Beek, T. A. H. , Kuipers, R. K. P. , Hekkelman, M. L. , & Vriend, G. (2010). Protein structure analysis of mutations causing inheritable diseases. An e‐Science approach with life scientist friendly interfaces. BMC Bioinformatics, 11, 548. [DOI] [PMC free article] [PubMed] [Google Scholar]
- Walters‐Sen, L. C. , Hashimoto, S. , Thrush, D. L. , Reshmi, S. , Gastier‐Foster, J. M. , Astbury, C. , & Pyatt, R. E. (2015). Variability in pathogenicity prediction programs: Impact on clinical diagnostics. Molecular Genetics and Genomic Medicine, 3, 99–110. [DOI] [PMC free article] [PubMed] [Google Scholar]
- Wheeler, T. J. , Clements, J. , & Finn, R. D. (2014). Skylign: A tool for creating informative, interactive logos representing sequence alignments and profile hidden Markov models. BMC Bioinformatics, 15, 7. [DOI] [PMC free article] [PubMed] [Google Scholar]
- Wouters, M. A. , Rigoutsos, I. , Chu, C. K. , Feng, L. L. , Sparrow, D. B. , & Dunwoodie, S. L. (2005). Evolution of distinct EGF domains with specific functions. Protein Sci, 14, 1091–1103. [DOI] [PMC free article] [PubMed] [Google Scholar]
- Yang, Z. , Swanson, W. J. , & Vacquier, V. D. (2000). Maximum‐likelihood analysis of molecular adaptation in abalone sperm lysin reveals variable selective pressures among lineages and sites. Molecular Biology and Evolution, 17, 1446–1455. [DOI] [PubMed] [Google Scholar]
- Yang Z., & Bielawski J. P. (2000). Statistical methods for detecting molecular adaptation. Trends in Ecology and Evolution, 15, 496–503. [DOI] [PMC free article] [PubMed] [Google Scholar]
- Zhu, J. , He, F. , Song, S. , Wang, J. , & Yu, J. (2008). How many human genes can be defined as housekeeping with current expression data? BMC Genomics, 9, 172. [DOI] [PMC free article] [PubMed] [Google Scholar]
Associated Data
This section collects any data citations, data availability statements, or supplementary materials included in this article.
Supplementary Materials
Supporting Material
Supporting Material
Supporting Material
Supporting Material
Supporting Material
Supporting Material
Supporting Material
Supporting Material
Supporting Material
Supporting Material