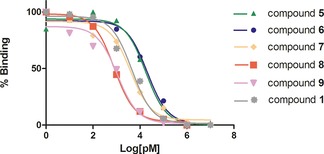
Figure 4.

Inhibition of the binding of biotinylated vitronectin to αvβ3 integrin. A representative curve was selected for each compound. X‐axis shows the concentration of the tested compounds 1, 5–9 in logarithmic scale; Y‐axis shows the percentage of inhibition of the binding of biotinylated vitronectin in the presence of the tested compounds. Experimental data were fitted with the software, as described in the Supporting Information.
