

Abstract
Background
Studies have sought associations of the opioid receptor mu 1 (OPRM1) A118G polymorphism (rs1799971) with alcohol-dependence, but findings are inconsistent. We summarize the information as to associations of rs1799971 (A > G) and the alcohol-dependence.
Methods
Systematically, we reviewed related literatures using the Preferred Reporting Items for Systematic Reviews and Meta-Analyses (PRISMA) guideline. Embase, PubMed, Web of Knowledge, and Chinese National Knowledge Infrastructure (CNKI) databases were searched using select medical subject heading (MeSH) terms to identify all researches focusing on the present topic up to September 2016. Odds ratios (ORs) along with the 95% confidence interval (95% CI) were estimated in allele model, homozygote model, heterozygote model, dominant model and recessive model. Ethnicity-specific subgroup-analysis, sensitivity analysis, heterogeneity description, and publication-bias assessment were also analyzed.
Results
There were 17 studies, including 9613 patients in the present meta-analysis. The ORs in the 5 genetic-models were 1.037 (95% CI: 0.890, 1.210; p = 0.64), 1.074 (95% CI: 0.831, 1.387; p = 0.586), 1.155 (95% CI: 0.935, 1.427; p = 0.181), 1.261 (95% CI: 1.008, 1.578; p = 0.042), 0.968 (95% CI: 0.758, 1.236; p = 0.793), respectively. An association is significant in the dominant model, but there is no statistical significance upon ethnicity-specific subgroup analysis.
Conclusion
The rs1799971 (A > G) is not strongly associated with alcohol-dependence. However, there are study heterogeneities and limited sample sizes.
Keywords: Meta-analysis, Rs1799971, OPRM1 A118G, Polymorphism, Alcohol-dependence
Background
Alcohol-dependence is a common disorder involving psychological and physical alcohol-dependence despite frequent complications [1]. Based on DSM-IV criteria, no less than 3 out of 7 of the following criteria must be met during 12 months for alcohol-dependence: tolerance; use is continued in spite of knowledge of related harms; recreational, occupational or social pursuits are reduced or given up due to alcohol use; time is spent obtaining alcohol or recovering from effects; unsuccessful efforts or persistent desires to cut down on alcohol-use; use for longer periods or in larger amounts than intended; and withdrawal symptoms or clinically defined alcohol withdrawal syndrome [2]. There are around 76 million people suffered from alcohol dependence worldwide, which is one of the leading psychiatric disorders of adult patients [3]. Its etiology is still unclear [4]. There were some studies indicating heritability of this disorder (ranging from 49% to 64%) [5, 6]. Several studies concerning genome-wide or phenome-wide associations of alcohol dependence were listed in Table 1 [5, 7–11]. These researches suggested that genetic factors might influence the patient susceptibility to alcohol dependence.
Table 1.
Previous studies about genome- or phenome-wide association studies of alcohol dependence
| Association type | Author | Year | Country | PMID | Subjects number | Key findings |
|---|---|---|---|---|---|---|
| Genome-wide association studies | Gelernter J et al. [7] | 2014 | USA | 24,166,409 | 16,087 | 1. They confirmed well-known risk loci mapped to alcohol-metabolizing enzyme genes, notably ADH1B in European-American (EA) and African-American (AA) populations and ADH1C in AAs, and identified novel risk loci mapping to the ADH gene cluster on chromosome 4 and extending centromerically beyond it to include GWS associations at LOC100507053 in AAs, PDLIM5 in EAs, and METAP in AAs. 2. They also identified a novel GWS association mapped to chromosome 2 at rs1437396, between MTIF2 and CCDC88A, across all of the EA and AA cohorts, with supportive gene expression evidence, and population-specific GWS for markers on chromosomes 5, 9 and 19. |
| Xu K et al. [8] | 2015 | USA | 26,036,284 | 9500 | 1. The results confirmed significant associations of the well-known functional loci at ADH1B with MaxDrinks in EAs and AAs. The region of significant association on chromosome 4 was extended to LOC100507053 in AAs but not EAs. 2. They also identified potentially novel significant common SNPs for MaxDrinks in EAs: rs1799876 at SERPINC1 on chromosome 1 and rs2309169 close to ANKRD36 on chromosome 2. |
|
| Mbarek H et al. [5] | 2015 | Netherlands | 26,365,420 | 7842 | 1. GWAS SNP effect concordance analysis was performed between GWAS and a recent alcohol dependence GWAS using DSM-IV diagnosis. The twin-based heritability of alcohol dependence-AUDIT was estimated at 60% (55–69%). 2. GCTA showed that common SNPs jointly capture 33% of this heritability. 3. The top hits were positioned within 4 regions (4q31.1, 2p16.1, 6q25.1, 7p14.1) with the strongest association detected for rs55768019. |
|
| Polimanti R et al. [11] | 2017 | USA | 26,458,734 | 5546 | 1. In the stage 1 sample, they observed 3 GWS SNP associations, rs200889048 and rs12490016 in EAs and rs1630623 in AAs and EAs meta-analyzed. 2. In the stage 2 sample, they replicated 278, 253 and 168 of the stage 1 suggestive loci in AAs, EAs, and AAs and EAs meta-analyzed, respectively. A meta-analysis of stage 1 and stage 2 samples identified 2 additional GWS signals: rs28562191 in EAs and rs56950471 in AAs |
|
| Meyers JL et al. [9] | 2017 | USA | 28,070,124 | 2382 | 1. Ten correlated SNPs located in an intergenic region on chromosome 3q26 were associated with fast beta (20–28 Hz) EEG power at P < 5 × 10⁻⁸. The most significantly associated SNP, rs11720469 is an expression quantitative trait locus for butyrylcholinesterase, expressed in thalamus tissue. 2. Four of the genome-wide SNPs were also associated with alcohol dependence, and two (rs13093097, rs7428372) were replicated in an independent AA sample. 3. Analyses in the AA adolescent/young adult subsample indicated association of rs11720469 with heavy episodic drinking (frequency of consuming 5+ drinks within 24 h). |
|
| Phenome-wide association studies | Polimanti R et al. [10] | 2016 | USA | 27,187,070 | 26,394 | 1. They replicated prior associations with drinking behaviors and identified multiple novel phenome-wide significant and suggestive findings related to psychological traits, socioeconomic status, vascular/metabolic conditions, and reproductive health. 2. They applied Bayesian network learning algorithms to provide insight into the causative relationships of the novel ADH1B associations: ADH1B appears to affect phenotypic traits via both alcohol-mediated and alcohol-independent effects. They replicated the novel ADH1B associations related to socioeconomic status (household gross income and highest grade finished in school). 3. For CHRNA3-CHRNA5 risk alleles, they replicated association with smoking behaviors, lung cancer, and asthma. There were also novel suggestive CHRNA3-CHRNA5 findings with respect to high-cholesterol-medication use and distrustful attitude. |
A relevant neurotransmitter system is related to endogenous opioids pathway [12]. Drinking alcohol can first increase levels of endogenous opioids (e.g. β-endorphin). Opioid reward system in return can elicit seeking additional alcohol. In addition, binding of μ-opioid receptors to β-endorphin could reinforce alcohol-dependence through increasing dopamine expressions at reward-centers [12] and then affect individual responses to alcohol. Therefore, genetic variations of OPRM1 might have an effect upon the risks of alcohol-dependence [13]. The rs1799971 is in the OPRM1 coding-area [13]. Though lots of researches have sought associations of the OPRM1 A118G- polymorphism with alcohol-dependence, there was no consensuses. [14] A Swedish group found that the A118G-polymorphism was connected to an 11% risk of alcohol dependence [15] while Bergen et al. found no significant association. [16] We were thus prompted to perform a meta-analysis to provide a full picture of current progress on this topic.
Methods
Article search and selection criteria
Two investigators searched CNKI, Embase, Web of Knowledge, and PubMed (up to Sep. 2016). Terms included “alcohol or alcoholic” and “rs1799971 or A118G or OPRM1”. Also, related references were scanned. Inclusion criteria and exclusion criteria are shown in Table 2.
Table 2.
Inclusion criteria for this meta-analysis
| Number | Inclusion criteria |
| 1 | Case-control studies. |
| 2 | The studies evaluated the associations between OPRM1 A118G polymorphism and alcohol dependence. |
| 3 | The studies included detailed genotyping data (total number of cases and controls, number of cases and controls with A/A, A/G, and G/G genotypes). |
| 4 | Studies focusing on human being. |
| Number | Exclusion criteria |
| 1 | The design of the experiments was not case-control. |
| 2 | The source of cases and controls, and other essential information were not provided. |
| 3 | The genotype distribution of the control population was not in accordance with the Hardy–Weinberg equilibrium (HWE). |
| 4 | Reviews and duplicated publications. |
Data extraction
We sought these information: authors’ names, publication-year, nation, ethnicity (Asian, Caucasian, or others), genotyping ways, P value for Hardy-Weinberg equilibrium (HWE),total numbers of controls and cases, controls and cases with OPRM1-A118G polymorphism, with A/A, A/G, and G/G genotypes, and control sources (population-based or hospital-based).
Methodological qualities
Based on the methodological quality scale (see Table 3), 2 investigators estimated the study qualities independently. Disagreements were resolved by discussions. In the methodological quality assessment scale, five items (sample sizes, quality control of genotyping methods, source of controls, case representativeness, and HWEs) were checked. The scores range between 0 and 10, with 10 indicating highest quality.
Table 3.
Scale for methodological quality assessment
| Criteria | Score |
|---|---|
| 1. Representativeness of cases | |
| RA diagnosed according to acknowledged criteria. | 2 |
| Mentioned the diagnosed criteria but not specifically described. | 1 |
| Not Mentioned. | 0 |
| 2. Source of controls | |
| Population or community based | 3 |
| Hospital-based RA-free controls | 2 |
| Healthy volunteers without total description | 1 |
| RA-free controls with related diseases | 0.5 |
| Not described | 0 |
| 3. Sample size | |
| > 300 | 2 |
| 200–300 | 1 |
| < 200 | 0 |
| 4. Quality control of genotyping methods | |
| Repetition of partial/total tested samples with a different method | 2 |
| Repetition of partial/total tested samples with the same method | 1 |
| Not described | 0 |
| 5. Hardy-Weinberg equilibrium (HWE) | |
| Hardy-Weinberg equilibrium in control subjects | 1 |
| Hardy-Weinberg disequilibrium in control subjects | 0 |
Statistical analysis
This analysis was in accord with the PRISMA checklist and guideline. ORs were computed in 3 steps: 1) for given individuals that have “B”, we computed the odds that the same individuals have “A”; 2) for given individuals that do not have “B”, we computed the odds that the same individuals have “A”; and 3) we divided the odds from step 1 by the odds from step 2, getting the ORs. The pooled ORs were estimated and used for comparisons in the 5 genetic models mentioned above. Ethnicity-specific subgroup-analyses were also made. To estimate the heterogeneities, we performed the I2 tests, Labbe plots, and Cochran’s Q-tests (see Table 4). As it seems likely that there are considerable phenotypic variations between populations in the different studies, we did all these analyses using the random-effects model. By contour-enhanced funnel plots and sensitivity-analysis plots (Table 4), we did publication-bias and sensitivity tests.
Table 4.
The statistical methods used in this meta-analysis and there explanation
| Statistic means | Goals and Usages | Explanation |
|---|---|---|
| Labbe plot | To evaluate heterogeneity between the included studies | In Labbe figure, if the points basically present as a linear distribution, it can be taken as an evidence of homogeneity. |
| Cochran’s Q test | To evaluate heterogeneity between the included studies | Cochran’s Q test is an extension to the McNemar test for related samples that provides a method for testing for differences between three or more matched sets of frequencies or proportions. Heterogeneity was also considered significant if P < 0.05 using the Cochran’s Q test. |
| I2 index test | To evaluate heterogeneity between the included studies | The I2 index measures the extent of true heterogeneity dividing the difference between the result of the Q test and its degrees of freedom (k – 1) by the Q value itself, and multiplied by 100. I2 values of 25%, 50% and 75% were used as evidence of low, moderate and high heterogeneity, respectively. |
| Sensitivity analysis | To examine the stability of the pooled results | A sensitivity analysis was performed using the one-at-a-time method, which involved omitting one study at a time and repeating the meta-analysis. If the omission of one study significantly changed the result, it implied that the result was sensitive to the studies included. |
| Contour-enhanced funnel plot | Publication bias test | Visual inspection of the Contour-enhanced funnel plots was used to assess potential publication bias. Asymmetry in the plots, which may be due to studies missing on the left-hand side of the plot that represents low statistical significance, suggested publication bias. If studies were missing in the high statistical significance areas (on the right-hand side of the plot), the funnel asymmetry was not considered to be due to publication bias |
A value of P < 0.01 was deemed of statistical significance. Statistical-analyses were conducted with Review Manager 5.3 and STATA 13.0.
Results
Search results and study characteristics
Figure 1 shows the processes of the literature-searching. 17 studies with 9613 patients were included. [15–31] Nine studies involved Caucasian subjects and were done in the USA, [15, 16, 24, 28, 30] Germany, [19, 22, 27] and Spain [18] (8026 subjects in total). Eight involved Asian subjects and were done in China, [23, 26, 29, 31] India, [17] Japan, [25] and Korea [20, 21] (1587 subjects in total). Fourteen studies were written in English, [15–25, 27, 28, 30] and three were in Chinese. [26, 29, 31] Alcohol dependence was defined by drinking history. Genotyping methods used included direct sequencing, polymerase chain reaction-restricted fragment length polymorphisms (PCR-RFLP), Puregene™ kit or standard phenol-chloroform method, TaqMan assay, and fluorescence resonance energy transfer method. Ten matchings for the controls were population-based, [15, 16, 18, 24–29, 31] 3 were hospital-based, [20–22] and 4 were mixed. [17, 19, 23, 30] The characteristics and methodological qualities are in Table 5.
Fig. 1.
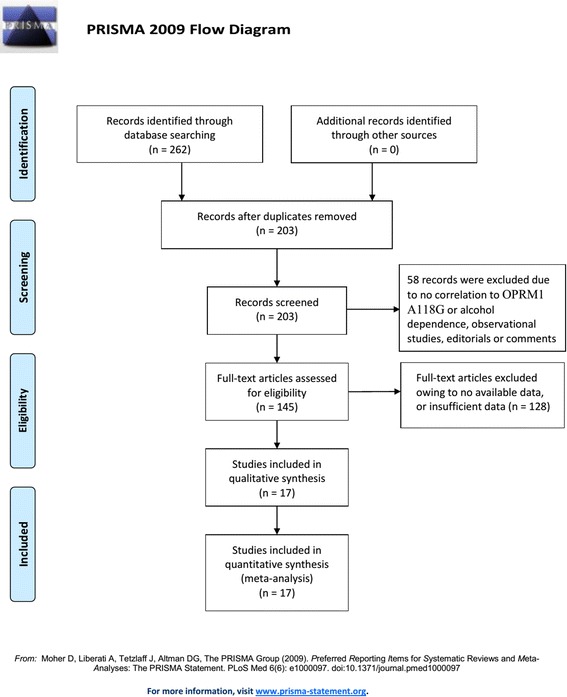
Literature search and selection of articles
Table 5.
Characteristics of studies included in the meta-analysis
| Author | Year | Country | Ethnicity | Disease type | Genotyping | Source of controls | Alcohol-dependence (n) | Controls (n) | P for HWE | Quality | ||||||
|---|---|---|---|---|---|---|---|---|---|---|---|---|---|---|---|---|
| Total | AA | AG | GG | Total | AA | AG | GG | |||||||||
| Bergen et al. | 1997 | USA | Caucasian | Alcohol-dependence | Direct sequencing and PCR-RFLP | Population-based | 160 | 123 | 35 | 2 | 264 | 204 | 59 | 1 | 0.1285 | 7 |
| Sander et al. | 1998 | German | Caucasian | Alcohol-dependence | PCR-RFLP | Population-based | 327 | 261 | 62 | 4 | 340 | 289 | 49 | 2 | 0.9606 | 6 |
| Franke et al. | 2001 | German | Caucasian | Alcohol-dependence | Direct sequencing and PCR-RFLP | Mixed | 221 | 170 | 50 | 1 | 365 | 284 | 74 | 7 | 0.4024 | 8 |
| Schinka et al. | 2002 | USA | Caucasian | Alcohol-dependence | Puregene™ kit or standard phenol-chloroform method | Population-based | 179 | 152 | 27 | 0 | 297 | 220 | 73 | 4 | 0.4531 | 7 |
| Kim et al. | 2004 | Korea | Asian | Alcohol-dependence | PCR-RFLP | Hospital-based | 100 | 46 | 47 | 7 | 128 | 54 | 53 | 21 | 0.2014 | 8 |
| Kim et al. | 2004 | Korea | Asian | Alcohol-dependence | PCR-RFLP | Hospital-based | 112 | 37 | 61 | 14 | 140 | 68 | 57 | 15 | 0.5582 | 7 |
| Loh et al. | 2004 | China Taiwan | Asian | Alcohol-dependence | PCR-RFLP | Mixed | 154 | 59 | 77 | 18 | 146 | 70 | 56 | 20 | 0.1136 | 8 |
| Bart et al. | 2005 | USA | Caucasian | Alcohol-dependence | PCR-RFLP | Population-based | 389 | 299 | 90 | 170 | 147 | 23 | Not available | 8 | ||
| Nishizawa et al. | 2006 | Japan | Asian | Alcohol-dependence | PCR-RFLP | Population-based | 64 | 12 | 37 | 15 | 74 | 26 | 33 | 15 | 0.4493 | 8 |
| Zhang et al. | 2006 | USA and Russia | Caucasian | Alcohol-dependence | PCR-RFLP | Mixed | 318 | 246 | 68 | 4 | 338 | 256 | 78 | 4 | 0.4713 | 7 |
| Deb et al. | 2010 | India | Asian | Alcohol-dependence | PCR-RFLP | Mixed | 53 | 16 | 32 | 5 | 82 | 44 | 30 | 8 | 0.3967 | 8 |
| Miranda et al. | 2010 | USA | Caucasian | Alcohol-dependence | TaqMan assays | Population-based | 27 | 13 | 14 | 160 | 134 | 26 | > 0.05 | 8 | ||
| Dou et al. | 2011 | China | Asian | Alcohol-dependence | PCR-RFLP | Population-based | 118 | 48 | 53 | 17 | 218 | 74 | 110 | 34 | 0.5127 | 6 |
| Koller et al. | 2012 | Germany | Caucasian | Alcohol-dependence | Fluorescence resonance energy transfer method | Hospital-based | 1845 | 1461 | 353 | 31 | 1863 | 1417 | 419 | 27 | 0.5275 | 9 |
| Huang et al. | 2012 | China | Asian | Alcohol-dependence | PCR-RFLP | Population-based | 45 | 33 | 11 | 1 | 45 | 33 | 12 | 0 | 0.3021 | 6 |
| Francesc | 2015 | Spain | Caucasian | Alcohol-dependence | PCR-RFLP | Population-based | 630 | 425 | 190 | 15 | 133 | 101 | 30 | 2 | 0.893 | 7 |
| Jin | 2015 | China | Asian | Alcohol-dependence | PCR-RFLP | Population-based | 58 | 41 | 12 | 5 | 50 | 39 | 9 | 2 | 0.1487 | 7 |
Meta-analysis results
Related results are listed in Table 6. The Labbe plots are as Fig. 2a–c. Overall, statistically significant associations of OPRM1-A118G polymorphism with alcohol-dependence was detected only in the dominant model (OR 1.261, 95% CI 1.008, 1.578; p = 0.042; Fig. 6). In the other four models, any associations were not significant (allele model: OR 1.037, 95% CI 0.890, 1.210; p = 0.640; Fig. 3; homozygote model: OR 1.074, 95% CI 0.831, 1.387; p = 0.586; Fig. 4; heterozygote model: OR 1.155, 95% CI 0.935, 1.427; p = 0.181; Fig. 5; recessive model: OR 0.968, 95% CI 0.758, 1.236; p = 0.793; Fig. 7).
Table 6.
The results of meta-analysis for various genotype models
| Genetic model | Heterogeneity test | Test of Association | Publication bias | ||||||||||||
|---|---|---|---|---|---|---|---|---|---|---|---|---|---|---|---|
| Name | Explanation | Ethnicity | Q value | d.f. | I-squared | Tau-squared | P Value | Heterogeneity | Effect model | Pooled OR | 95% CI | Z value | P value | Statistical significance | |
| Allele model | G vs. A | Caucasian | 17.38 | 6 | 65.5% | 0.0493 | 0.008 | Yes | Random | 0.985 | [0.797, 1.217] | 0.14 | 0.888 | No | No |
| Asian | 14.90 | 7 | 53.0% | 0.0564 | 0.037 | Yes | Random | 1.100 | [0.871, 1.390] | 0.80 | 0.421 | No | |||
| Total | 34.85 | 14 | 59.8% | 0.0487 | 0.002 | Yes | Random | 1.037 | [0.890, 1.210] | 0.47 | 0.640 | No | |||
| Homozygote model | GG vs. AA | Caucasian | 5.60 | 6 | 0.0% | NA | 0.469 | No | Random | 1.119 | [0.731, 1.714] | 0.52 | 0.605 | No | No |
| Asian | 10.22 | 7 | 31.5% | NA | 0.176 | No | Random | 1.146 | [0.743, 1.767] | 0.62 | 0.538 | No | |||
| Total | 15.81 | 14 | 11.4% | NA | 0.325 | No | Random | 1.118 | [0.830, 1.506] | 0.74 | 0.462 | No | |||
| Heterozygote model | AG vs. AA | Caucasian | 16.71 | 6 | 64.1% | 0.0575 | 0.010 | Yes | Random | 0.983 | [0.780, 1.237] | 0.15 | 0.882 | No | No |
| Asian | 15.58 | 7 | 55.1% | 0.1296 | 0.029 | Yes | Random | 1.433 | [1.015, 2.023] | 2.04 | 0.041 | No | |||
| Total | 42.72 | 14 | 67.2% | 0.1017 | 0.000 | Yes | Random | 1.155 | [0.935, 1.427] | 1.34 | 0.181 | No | |||
| Dominant model | AG + GG vs. AA | Caucasian | 41.43 | 8 | 80.7% | 0.1518 | 0.000 | Yes | Random | 1.185 | [0.882, 1.593] | 1.13 | 0.259 | No | No |
| Asian | 16.65 | 7 | 58.0% | 0.1310 | 0.020 | Yes | Random | 1.379 | [0.983, 1.934] | 1.86 | 0.063 | No | |||
| Total | 63.64 | 16 | 74.9% | 0.1467 | 0.000 | Yes | Random | 1.261 | [1.008, 1.578] | 2.03 | 0.042 | No | |||
| Recessive model | GG vs. AA + AG | Caucasian | 5.24 | 6 | 0.0% | NA | 0.513 | No | Random | 1.142 | [0.746, 1.747] | 0.61 | 0.542 | No | No |
| Asian | 6.21 | 7 | 0.0% | NA | 0.516 | No | Random | 0.919 | [0.673, 1.255] | 0.53 | 0.595 | No | |||
| Total | 12.06 | 14 | 0.0% | NA | 0.602 | No | Random | 0.991 | [0.771, 1.275] | 0.07 | 0.946 | No | |||
Fig. 2.
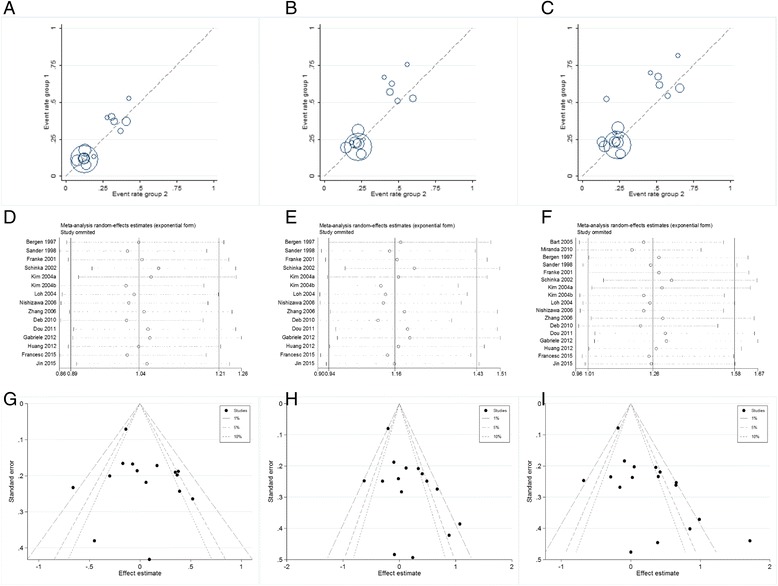
Labbe plots, sensitivity analysis plots, and contour-enhanced funnel plots of the included studies focusing on the association of the OPRM1 A118G polymorphism with alcohol dependence risk. Labbe plots in allele model (a), heterozygote model (b), and dominant model (c). Sensitivity analysis in allele model (d), heterozygote model (e), and dominant model (f). Contour-enhanced funnel plots in allele model (g), heterozygote model (h), and dominant model (i)
Fig. 6.
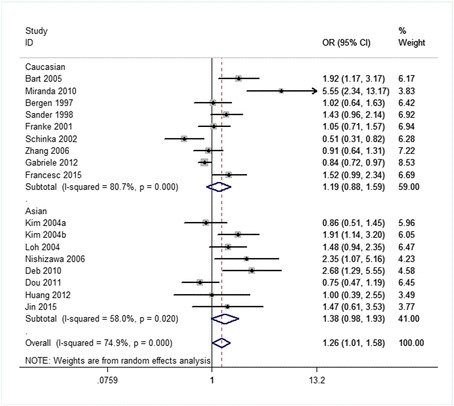
Forest plots (individual and pooled effects with 95% CI) regarding the association of the OPRM1 A118G polymorphism with alcohol dependence in the dominant model
Fig. 3.
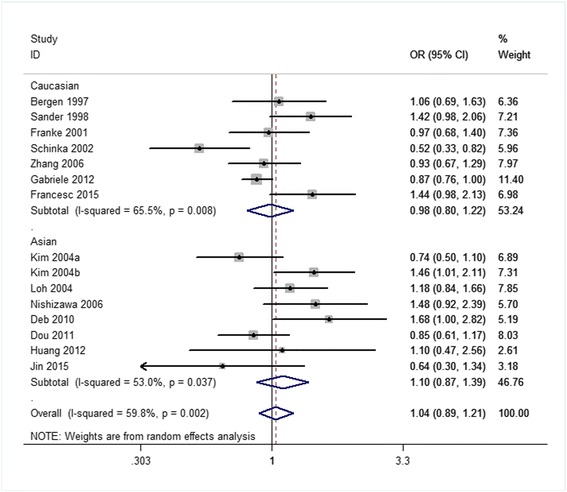
Forest plots (individual and pooled effects with 95% CI) regarding the association of the OPRM1 A118G polymorphism with alcohol dependence in the allele model
Fig. 4.
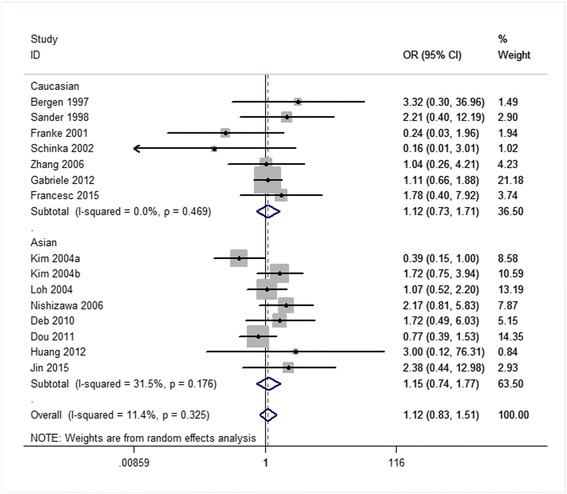
Forest plots (individual and pooled effects with 95% CI) regarding the association of the OPRM1 A118G polymorphism with alcohol dependence in the homozygote model
Fig. 5.
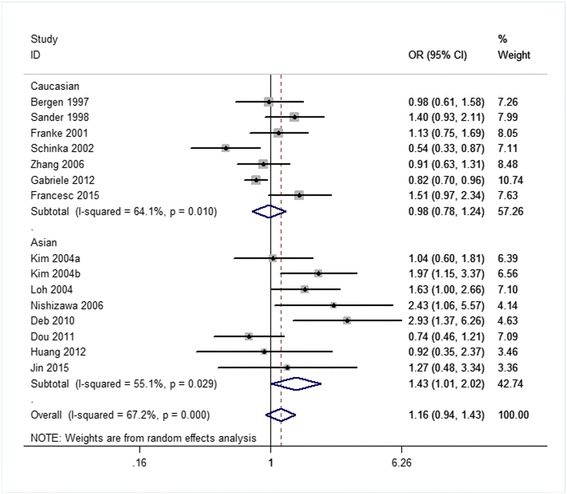
Forest plots (individual and pooled effects with 95% CI) regarding the association of the OPRM1 A118G polymorphism with alcohol dependence in the heterozygote model
Fig. 7.
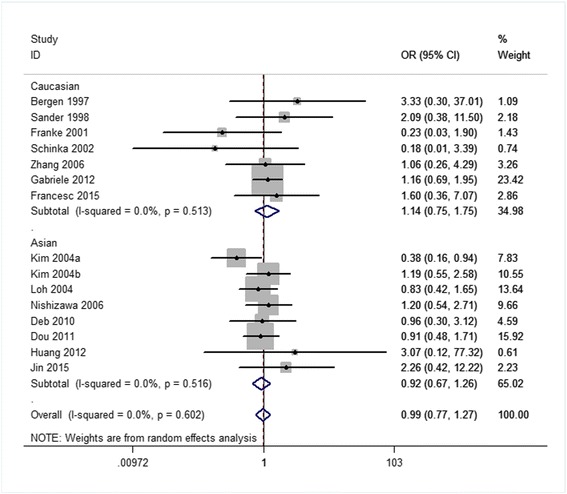
Forest plots (individual and pooled effects with 95% CI) regarding the association of the OPRM1 A118G polymorphism with alcohol dependence in the recessive model
The ethnicities are an Asian group and a Caucasian group. The corresponding results are shown in Table 6 and Figs. 3, 4, 5, 6, 7. For both the 2 subgroups, the OPRM1-A118G polymorphism had no association with alcohol-dependence in all these 5 genetic-models.
Sensitivity analysis and publication bias
The ORs were not influenced by removing any single article (Fig. 2d–f). We had searched all possible studies both in Chinese databases and English databases to reduce the publication bias. Contour-enhanced funnel plots demonstrated that the studies only had missing areas for high statistical significance instead of low significance areas, thus very little or none publication bias was detected (Fig. 2g–i).
Discussion
Alcohol dependence is estimated to exhibit heritability of more than 50% [5, 6], indicating genetic factors might play pivotal roles alcohol-dependence. Genome-wide or phenome-wide associations researches of alcohol-dependence was presented in Table 1. In view of the significances of μ-opioid receptor systems in physiologic mechanisms of reward centers, it is safe to say that OPRM1-polymorphisms had an influence on alcohol-dependence risks. [32, 33] Therefore, we focused our study on OPRM1 A118G, which is a functional allelic-variant with deleterious effects on protein and mRNA expressions. [34]
Close associations are suspected of the OPRM1 A118G polymorphism (A > G) with nicotine, alcohol, and opioid dependence. [13, 35, 36] Kapur et al. and Tan et al. discovered close associations between A118G-polymorphisms and heroin dependence. [37, 38] Modulation changes of kinase A are likely responsible for the close associations of the OPRM1 A118G polymorphism (A > G) with heroin dependence. [39] Recently, Frances et al. found that the OPRM1 A118G polymorphism (A > G) was associated with alcohol/tobacco-dependence in a Spanish population, and this association was related to several environmental and genetic factors. [18] However, the study from Rouvinen-Lagerstrom et al. suggested that the effect of A118G-polymorphism on the development of alcohol dependence was not statistically significant (P > 0.05). [40] In a study by Franke et al., data from ethnically homogenous samples detected no actual difference of the OPRM1 A118G polymorphism between alcohol dependent subjects and controls. [19]
We combed PubMed, Embase, Web of knowledge and CNKI databases in search of associations of alcohol dependence with the OPRM1 A118G polymorphism to cover the most information sourced from both Chinese and English studies. In our meta-analysis, significant associations between alcohol-dependence risks and A118G-polymorphisms were only found in the dominant model (OR 1.261, 95% CI 1.008, 1.578; p = 0.042). Association was non-significant in four other models. For subgroup analyses of Caucasian or Asian group each considered separately, the OPRM1 A118G polymorphism did not have association with alcohol dependence in all five genetic models.
In the contour-enhanced funnel plots, each circle represented a study. If studies appeared to be missing in areas of low statistical significance (the left part of the plot), the asymmetry is likely to be due to publication-biases. [41] In the present study, funnel plots indicated no publication bias.
There are potential limitations in our meta-analysis. The numbers of studies (nine and eight) as well as sample sizes for each ethnicity were limited. Type-II error could not be dismissed. [42] In addition, effects of gene-environment interactions and gene-gene interactions were not analyzed as not all eligible articles included these type of data. Within those studies with genomic interaction data, confounding factors were controlled and reported differently. Last, ORs adjusted by patient characteristics including genders, ages, living styles, medication-consumptions and other exposure-factors using meta-regression could be calculated with higher accuracy if related data were available in the majority of eligible studies.
Conclusions
The opioid receptor mu 1 (OPRM1) A118G polymorphism (rs1799971) is not associated with alcohol dependence in Caucasian nor Asian populations.
Acknowledgments
We thank our colleagues at the Department of Neurosurgery, Peking Union Medical College Hospital, Chinese Academy of Medical Sciences and Peking Union Medical College.
Funding
This study was supported by China Scholarship Council of the Ministry of Education, P. R. China. This study was funded by Peking Union Medical College Youth Research Funds (2016) (Project No. 3332016010; Grant recipient: Xiangyi Kong). The funders had no role in study design, data collection and analysis, decision to publish, or preparation of the manuscript.
Availability of data and materials
The data are within the manuscript.
Abbreviations
- 95% CI
95% confidence interval
- CNKI
Chinese National Knowledge Infrastructure
- HWE
Hardy-Weinberg equilibrium
- MeSH
Medical Subject Heading
- OPRM1
opioid receptor mu 1
- OR
odds ratio
- PCR-RFLP
polymerase chain reaction-restricted fragment length polymorphisms.
- PRISMA
Preferred Reporting Items for Systematic Reviews and Meta-Analyses
Authors’ contributions
XY K, H D, and S G contributed to the data collection and paper drafting; H D and T A contributed to the data analyzing; JP W and YG K contributed to the literature reviewing. All authors read and approved the final manuscript.
Ethics approval and consent to participate
Because this is only a systematic review of previous retrospective studies, and does not involve any human experiments or animal experiments, ethics approval and consent are not applicable.
Consent for publication
Not applicable.
Competing interests
The authors state that there are no conflicts of interest to disclose.
Publisher’s Note
Springer Nature remains neutral with regard to jurisdictional claims in published maps and institutional affiliations.
Contributor Information
Yanguo Kong, Email: kong0126@126.com.
Jingping Wang, Email: JWANG23@mgh.harvard.edu.
References
- 1.Batra A, Muller CA, Mann K, Heinz A. Alcohol dependence and harmful use of alcohol. Dtsch Arztebl Int. 2016;113(17):301–310. doi: 10.3238/arztebl.2016.0301. [DOI] [PMC free article] [PubMed] [Google Scholar]
- 2.Rose JS, Lee CT, Selya AS, Dierker LC. DSM-IV alcohol abuse and dependence criteria characteristics for recent onset adolescent drinkers. Drug Alcohol Depend. 2012;124(1–2):88–94. doi: 10.1016/j.drugalcdep.2011.12.013. [DOI] [PMC free article] [PubMed] [Google Scholar]
- 3.Thompson A, Wright AK, Ashcroft DM, van Staa TP, Pirmohamed M. Epidemiology of alcohol dependence in UK primary care: results from a large observational study using the clinical practice research Datalink. PLoS One. 2017;12(3):e0174818. doi: 10.1371/journal.pone.0174818. [DOI] [PMC free article] [PubMed] [Google Scholar]
- 4.Blazer DG, LT W. The epidemiology of alcohol use disorders and subthreshold dependence in a middle-aged and elderly community sample. Am J Geriatr Psychiatry. 2011;19(8):685–694. doi: 10.1097/JGP.0b013e3182006a96. [DOI] [PMC free article] [PubMed] [Google Scholar]
- 5.Mbarek H, Milaneschi Y, Fedko IO, Hottenga JJ, de Moor MH, Jansen R, Gelernter J, Sherva R, Willemsen G, Boomsma DI, et al. The genetics of alcohol dependence: twin and SNP-based heritability, and genome-wide association study based on AUDIT scores. Am J Med Genet B Neuropsychiatr Genet. 2015;168(8):739–748. doi: 10.1002/ajmg.b.32379. [DOI] [PubMed] [Google Scholar]
- 6.Chen D, Liu L, Xiao Y, Peng Y, Yang C, Wang Z. Ethnic-specific meta-analyses of association between the OPRM1 A118G polymorphism and alcohol dependence among Asians and Caucasians. Drug Alcohol Depend. 2012;123(1–3):1–6. doi: 10.1016/j.drugalcdep.2011.10.012. [DOI] [PubMed] [Google Scholar]
- 7.Gelernter J, Kranzler HR, Sherva R, Almasy L, Koesterer R, Smith AH, Anton R, Preuss UW, Ridinger M, Rujescu D, et al. Genome-wide association study of alcohol dependence:significant findings in African- and European-Americans including novel risk loci. Mol Psychiatry. 2014;19(1):41–49. doi: 10.1038/mp.2013.145. [DOI] [PMC free article] [PubMed] [Google Scholar]
- 8.Xu K, Kranzler HR, Sherva R, Sartor CE, Almasy L, Koesterer R, Zhao H, Farrer LA, Gelernter J. Genomewide association study for maximum number of alcoholic drinks in European Americans and African Americans. Alcohol Clin Exp Res. 2015;39(7):1137–1147. doi: 10.1111/acer.12751. [DOI] [PMC free article] [PubMed] [Google Scholar]
- 9.Meyers JL, Zhang J, Wang JC, Su J, Kuo SI, Kapoor M, Wetherill L, Bertelsen S, Lai D, Salvatore JE, et al. An endophenotype approach to the genetics of alcohol dependence: a genome wide association study of fast beta EEG in families of African ancestry. Mol Psychiatry. 2017;00:1–9. [DOI] [PMC free article] [PubMed]
- 10.Polimanti R, Kranzler HR, Gelernter J. Phenome-wide association study for alcohol and nicotine risk alleles in 26394 women. Neuropsychopharmacology. 2016;41(11):2688–2696. doi: 10.1038/npp.2016.72. [DOI] [PMC free article] [PubMed] [Google Scholar]
- 11.Polimanti R, Zhang H, Smith AH, Zhao H, Farrer LA, Kranzler HR, Gelernter J. Genome-wide association study of body mass index in subjects with alcohol dependence. Addict Biol. 2017;22(2):535–549. doi: 10.1111/adb.12317. [DOI] [PMC free article] [PubMed] [Google Scholar]
- 12.Heinz A, Beck A, Wrase J, Mohr J, Obermayer K, Gallinat J, Puls I. Neurotransmitter systems in alcohol dependence. Pharmacopsychiatry. 2009;42(Suppl 1):S95–S101. doi: 10.1055/s-0029-1214395. [DOI] [PubMed] [Google Scholar]
- 13.Gurel SC, Ayhan Y, Karaaslan C, Akel H, Karaca RO, Babaoglu MO, Yasar U, Bozkurt A, Dilbaz N, Ulug BD, et al. Mu-opioid receptor gene (OPRM1) polymorphisms A118G and C17T in alcohol dependence: a Turkish sample. Turk Psikiyatri Derg. 2016;27(2):0. [PubMed] [Google Scholar]
- 14.Ragia G, Veresies I, Veresie L, Veresies K, Manolopoulos VG. Association study of DRD2 A2/A1, DRD3 Ser9Gly, DbetaH -1021C>T, OPRM1 A118G and GRIK1 rs2832407C>A polymorphisms with alcohol dependence. Drug Metab Pers Ther. 2016;31(3):143–150. doi: 10.1515/dmpt-2016-0015. [DOI] [PubMed] [Google Scholar]
- 15.Bart G, Kreek MJ, Ott J, LaForge KS, Proudnikov D, Pollak L, Heilig M. Increased attributable risk related to a functional mu-opioid receptor gene polymorphism in association with alcohol dependence in central Sweden. Neuropsychopharmacology. 2005;30(2):417–422. doi: 10.1038/sj.npp.1300598. [DOI] [PubMed] [Google Scholar]
- 16.Bergen AW, Kokoszka J, Peterson R, Long JC, Virkkunen M, Linnoila M, Goldman D. Mu opioid receptor gene variants: lack of association with alcohol dependence. Mol Psychiatry. 1997;2(6):490–494. doi: 10.1038/sj.mp.4000331. [DOI] [PubMed] [Google Scholar]
- 17.Deb I, Chakraborty J, Gangopadhyay PK, Choudhury SR, Das S. Single-nucleotide polymorphism (A118G) in exon 1 of OPRM1 gene causes alteration in downstream signaling by mu-opioid receptor and may contribute to the genetic risk for addiction. J Neurochem. 2010;112(2):486–496. doi: 10.1111/j.1471-4159.2009.06472.x. [DOI] [PubMed] [Google Scholar]
- 18.Frances F, Portoles O, Castello A, Costa JA, Verdu F. Association between opioid receptor mu 1 (OPRM1) gene polymorphisms and tobacco and alcohol consumption in a Spanish population. Bosn J Basic Med Sci. 2015;15(2):31–36. doi: 10.17305/bjbms.2015.243. [DOI] [PMC free article] [PubMed] [Google Scholar]
- 19.Franke P, Wang T, Nothen MM, Knapp M, Neidt H, Albrecht S, Jahnes E, Propping P, Maier W. Nonreplication of association between mu-opioid-receptor gene (OPRM1) A118G polymorphism and substance dependence. Am J Med Genet. 2001;105(1):114–119. doi: 10.1002/1096-8628(20010108)105:1<114::AID-AJMG1074>3.0.CO;2-L. [DOI] [PubMed] [Google Scholar]
- 20.Kim SA, Kim JW, Song JY, Park S, Lee HJ, Chung JH. Association of polymorphisms in nicotinic acetylcholine receptor alpha 4 subunit gene (CHRNA4), mu-opioid receptor gene (OPRM1), and ethanol-metabolizing enzyme genes with alcoholism in Korean patients. Alcohol. 2004;34(2–3):115–120. doi: 10.1016/j.alcohol.2004.06.004. [DOI] [PubMed] [Google Scholar]
- 21.Kim SG, Kim CM, Kang DH, Kim YJ, Byun WT, Kim SY, Park JM, Kim MJ, Oslin DW. Association of functional opioid receptor genotypes with alcohol dependence in Koreans. Alcohol Clin Exp Res. 2004;28(7):986–990. doi: 10.1097/01.ALC.0000130803.62768.AB. [DOI] [PubMed] [Google Scholar]
- 22.Koller G, Zill P, Rujescu D, Ridinger M, Pogarell O, Fehr C, Wodarz N, Bondy B, Soyka M, Preuss UW. Possible association between OPRM1 genetic variance at the 118 locus and alcohol dependence in a large treatment sample: relationship to alcohol dependence symptoms. Alcohol Clin Exp Res. 2012;36(7):1230–1236. doi: 10.1111/j.1530-0277.2011.01714.x. [DOI] [PubMed] [Google Scholar]
- 23.Loh el W, Fann CS, Chang YT, Chang CJ, Cheng AT. Endogenous opioid receptor genes and alcohol dependence among Taiwanese Han. Alcohol Clin Exp Res. 2004;28(1):15–19. doi: 10.1097/01.ALC.0000106303.41755.B8. [DOI] [PubMed] [Google Scholar]
- 24.Miranda R, Ray L, Justus A, Meyerson LA, Knopik VS, McGeary J, Monti PM. Initial evidence of an association between OPRM1 and adolescent alcohol misuse. Alcohol Clin Exp Res. 2010;34(1):112–122. doi: 10.1111/j.1530-0277.2009.01073.x. [DOI] [PMC free article] [PubMed] [Google Scholar]
- 25.Nishizawa D, Han W, Hasegawa J, Ishida T, Numata Y, Sato T, Kawai A, Ikeda K. Association of mu-opioid receptor gene polymorphism A118G with alcohol dependence in a Japanese population. Neuropsychobiology. 2006;53(3):137–141. doi: 10.1159/000093099. [DOI] [PubMed] [Google Scholar]
- 26.Huang C, Jin AH, Li CH, Han HM, Pu XX. The relation between OPRM1 gene A118G polymorphism and alcoholic liver disease, alcohol-dependent in Korean-Chinese and Han nationality men of Yanbian area. Journal of Medical Science Yanbian University. 2012;35(3):199–205. [Google Scholar]
- 27.Sander T, Gscheidel N, Wendel B, Samochowiec J, Smolka M, Rommelspacher H, Schmidt LG, Hoehe MR. Human mu-opioid receptor variation and alcohol dependence. Alcohol Clin Exp Res. 1998;22(9):2108–2110. [PubMed] [Google Scholar]
- 28.Schinka JA, Town T, Abdullah L, Crawford FC, Ordorica PI, Francis E, Hughes P, Graves AB, Mortimer JA, Mullan M. A functional polymorphism within the mu-opioid receptor gene and risk for abuse of alcohol and other substances. Mol Psychiatry. 2002;7(2):224–228. doi: 10.1038/sj.mp.4000951. [DOI] [PubMed] [Google Scholar]
- 29.Jin JD, JH P. Relationship between A118G polymorphism of OPRM1 gene and alcohol dependence. China Journal of Modern Medicine. 2015;25(3):7–10. [Google Scholar]
- 30.Zhang H, Luo X, Kranzler HR, Lappalainen J, Yang BZ, Krupitsky E, Zvartau E, Gelernter J. Association between two mu-opioid receptor gene (OPRM1) haplotype blocks and drug or alcohol dependence. Hum Mol Genet. 2006;15(6):807–819. doi: 10.1093/hmg/ddl024. [DOI] [PMC free article] [PubMed] [Google Scholar]
- 31.Dou SJ, Jing Q. A association study of OPRM1 gene A118G polymorphism and alcohol dependence. Congress of Genetics Society of China Proceedings. 2011;239
- 32.Myers CE, Rego J, Haber P, Morley K, Beck KD, Hogarth L, Moustafa AA. Learning and generalization from reward and punishment in opioid addiction. Behav Brain Res. 2016;317:122–131. doi: 10.1016/j.bbr.2016.09.033. [DOI] [PMC free article] [PubMed] [Google Scholar]
- 33.Mechling AE, Arefin T, Lee HL, Bienert T, Reisert M, Ben Hamida S, Darcq E, Ehrlich A, Gaveriaux-Ruff C, Parent MJ, et al. Deletion of the mu opioid receptor gene in mice reshapes the reward-aversion connectome. Proc Natl Acad Sci U S A. 2016;113(41):11603–11608. doi: 10.1073/pnas.1601640113. [DOI] [PMC free article] [PubMed] [Google Scholar]
- 34.Ziauddeen H, Nestor LJ, Subramaniam N, Dodds C, Nathan PJ, Miller SR, Sarai BK, Maltby K, Fernando D, Warren L, et al. Opioid antagonists and the A118G polymorphism in the mu-opioid receptor gene: effects of GSK1521498 and naltrexone in healthy drinkers stratified by OPRM1 genotype. Neuropsychopharmacology. 2016;41(11):2647–2657. doi: 10.1038/npp.2016.60. [DOI] [PMC free article] [PubMed] [Google Scholar]
- 35.Verhagen M, Kleinjan M, Engels RC. A systematic review of the A118G (Asn40Asp) variant of OPRM1 in relation to smoking initiation, nicotine dependence and smoking cessation. Pharmacogenomics. 2012;13(8):917–933. doi: 10.2217/pgs.12.76. [DOI] [PubMed] [Google Scholar]
- 36.Xu X, Mao B, Wu L, Liu L, Rui J, Chen G. A118G polymorphism in mu-opioid receptor gene and Interactions with smoking and drinking on risk of Oesophageal squamous cell carcinoma. J Clin Lab Anal. 2017;31(1) [DOI] [PMC free article] [PubMed]
- 37.Tan EC, Tan CH, Karupathivan U, Yap EP. Mu opioid receptor gene polymorphisms and heroin dependence in Asian populations. Neuroreport. 2003;14(4):569–572. doi: 10.1097/00001756-200303240-00008. [DOI] [PubMed] [Google Scholar]
- 38.Kapur S, Sharad S, Singh RA, Gupta AK. A118g polymorphism in mu opioid receptor gene (oprm1): association with opiate addiction in subjects of Indian origin. J Integr Neurosci. 2007;6(4):511–522. doi: 10.1142/S0219635207001635. [DOI] [PubMed] [Google Scholar]
- 39.Henderson-Redmond AN, Yuill MB, Lowe TE, Kline AM, Zee ML, Guindon J, Morgan DJ. Morphine-induced antinociception and reward in "humanized" mice expressing the mu opioid receptor A118G polymorphism. Brain Res Bull. 2016;123:5–12. doi: 10.1016/j.brainresbull.2015.10.007. [DOI] [PMC free article] [PubMed] [Google Scholar]
- 40.Rouvinen-Lagerstrom N, Lahti J, Alho H, Kovanen L, Aalto M, Partonen T, Silander K, Sinclair D, Raikkonen K, Eriksson JG, et al. Mu-opioid receptor gene (OPRM1) polymorphism A118G: lack of association in Finnish populations with alcohol dependence or alcohol consumption. Alcohol Alcohol. 2013;48(5):519–525. doi: 10.1093/alcalc/agt050. [DOI] [PMC free article] [PubMed] [Google Scholar]
- 41.Peters JL, Sutton AJ, Jones DR, Abrams KR, Rushton L. Contour-enhanced meta-analysis funnel plots help distinguish publication bias from other causes of asymmetry. J Clin Epidemiol. 2008;61(10):991–996. doi: 10.1016/j.jclinepi.2007.11.010. [DOI] [PubMed] [Google Scholar]
- 42.Matsuda H. The importance of type II error and falsifiability. Int J Occup Med Environ Health. 2004;17(1):137–145. [PubMed] [Google Scholar]
Associated Data
This section collects any data citations, data availability statements, or supplementary materials included in this article.
Data Availability Statement
The data are within the manuscript.