Abstract
Please cite this paper as: Mak et al. (2012) The impact of pandemic influenza A (H1N1) 2009 on the circulation of respiratory viruses 2009–2011. Influenza and Other Respiratory Viruses 6(3), e6–e10.
Surveillance of respiratory viruses has been conducted for many years at the public health laboratory in Hong Kong. With the occurrence of pandemic influenza A (H1N1) 2009, we observed a change in the seasonality of influenza activity with a seemingly corresponding change in the activity of respiratory syncytial virus, parainfluenza virus, and adenovirus during 2009–2011. This phenomenon could most likely be explained by virus interference.
Keywords: Circulation pattern, interactivity, respiratory viruses
Introduction
The knowledge of seasonal and cyclic variation in incidence of viral infection not only is useful in clinical management of patients, it is also essential in planning outbreak control and preventive strategies. Influenza viruses, respiratory syncytial virus (RSV), parainfluenza viruses (PIV), adenoviruses, and rhinoviruses are the most common etiologic agents of the respiratory illness. 1 , 2 Influenza viruses have the greatest potential to produce severe disease especially in older individuals; RSV and PIV are clearly associated with severe disease in young children; and adenoviruses can also result in severe diseases, while rhinoviruses, in contrast, produce mild illnesses and likely to be asymptomatic. We had previously reported the circulation of respiratory viruses in Hong Kong from 1998 through 2003. 3 With the emergence of pandemic influenza A (H1N1) 2009 virus [henceforth: A(H1N1)pdm09 stands for pandemic influenza A (H1N1) 2009 virus to differentiate from seasonal influenza A (H1N1) virus, A(H1N1), as proposed by the World Health Organization 4 ], we analyzed respiratory illness surveillance data from 2004 through 2011 and examined the impact of the pandemic on the circulation of the influenza virus, RSV, PIV, and adenovirus.
Methods
The Virology division of the Centre for Health Protection (previously known as The Government Virus Unit) has been designated as National Influenza Centre since 1963. It provides laboratory diagnostic services to public and private hospitals and clinics in Hong Kong for disease surveillance. From January 1, 2004, to July 30, 2011, all respiratory specimens submitted to the Centre for Health Protection were routinely cultured using MDCK, LLC‐MK2, RD, and HEp2 cells and identified as described before. 3 , 5 For each specimen, virus isolated, and type/subtype of each viruses and patient’s demography were captured in the laboratory information system. The monthly proportion of positive specimen (PPS) in various age groups (<5, 5–14, 15–24, 25–59, and >59 years) for each virus out of a total number of specimens processed in the laboratory was computed. The age distribution of the type and subtype of the virus is also analyzed.
Results
From 2004 through 2008, the mean monthly number of respiratory specimens processed was 3617. Breakdown of the specimens by age showed high proportion (ranged from 73·1% to 78·2%) was from those <5 and >59 years age groups in roughly equal proportion. During the pandemic of A(H1N1)pdm09, the mean monthly specimen number reached 10374 with 53·1% of specimens collected from those between the age of 5–59 years. After 2009, the mean monthly specimen dropped to 5846 with again 72·2% coming from those <5 and >59 years age groups. Overall, the most commonly detected agents were influenza virus followed by PIV, RSV, and adenoviruses. From 2004 to 2010, the PPS for influenza ranged from 10·5% to 29·2%; PIV, 1·7% to 3·8%; RSV, 0·9% to 4·5%; and adenoviruses, 0·4% to 3·4%.
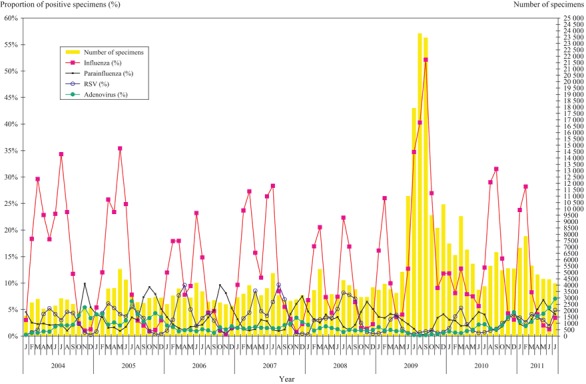
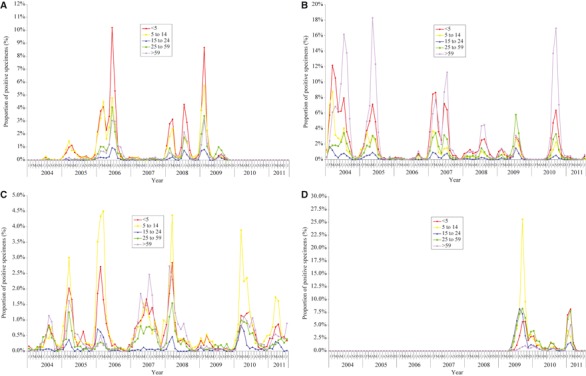
Except in 2005 when influenza A (H3N2) [A(H3N2)] remained high from March to June, two influenza peaks were generally found in each year from 2004 through 2010. The incidence of influenza has generally been found to increase in spring (February to March) and summer (July–August) as shown by the high PPS ranged from 12·7% to 29·6% for the spring peaks and 14·8% to 40·3% for the summer peaks (Figure 1). With the introduction of A(H1N1)pdm09 in May 2009, the infection reached its peak in September 2009 with the 5–14 age group affected most (Figure 2, also see Supporting Information for exact PPS). The spring of the following year after the pandemic saw a low activity of A(H1N1)pdm09 with a PPS of 12·7% in March 2010. A delayed influenza summer peak with a PPS of 31·5% because of the surge of A(H3N2) was noted in September 2010. In the spring of 2011, the A(H1N1)pdm09 returned as the predominating influenza virus. However, the activity diminished rapidly, and influenza activity has remained extremely low up to July 2011, the lowest ever seen during the study period.
Figure 1.

Number of specimens processed and the proportion of positive for various viruses.
Figure 2.

(A) The proportion of specimens positive for influenza A (H1N1) virus by age groups. (B) The proportion of specimens positive for influenza A (H3N2) virus by age groups. (C) The proportion of specimens positive for influenza B virus by age groups. (D) The proportion of specimens positive for pandemic influenza A (H1N1) 2009 virus by age groups.
As revealed by the PPS from 2004 through 2011, different age groups were affected to different extent by different subtype of influenza virus: A(H3N2) affecting mostly <5 and >59 years; A(H1N1) and A(H1N1)pdm09 affecting mainly <5 years and 5–14 years; and influenza B mainly <5 and 5–14 years with the >59 years moderately affected in some years (Figure 2, also see Supporting Information for exact PPS).
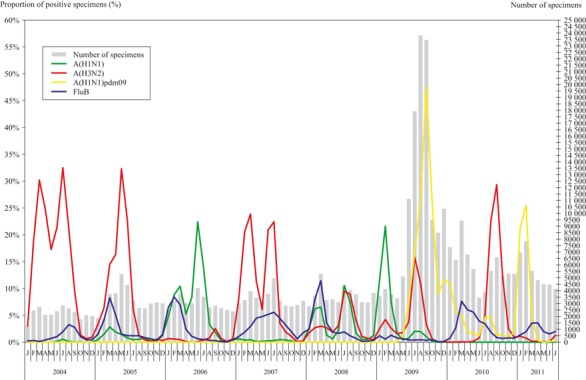
A(H3N2) has for many years remained the predominating circulating influenza virus. It contributed 91·6% in 2004, 76·5% in 2005, 74·8% in 2007, 34·1% in 2008 and 46·6% in 2010 of the influenza virus isolated from 2004 to 2010. It cocirculated with A(H1N1) in 2008 which accounted for 34·1% and 36·9%, respectively (Figure 3). Except in 2006 and 2009 when A(H1N1) and A(H1N1)pdm09 were predominant accounting for 72·0% and 71·0% of the influenza virus isolation, respectively, the curves of age‐specific PPS for influenza virus were U‐shaped with high rates among those <5 and >59 years. A distorted U‐shaped was seen in 2006 when the activity of A(H3N2) was the lowest between 2004 and 2010 with decreased rates observed among those aged >59 years. In 2009, during the outbreak of A(H1N1)pdm09, the age‐specific PPS for influenza virus showed M‐shaped curve with the age groups 5–14 and 25–59 years affected most.
Figure 3.

The proportion of specimens positive for influenza types/subtypes.
RSV occurred annually in spring (March to April) and summer (July to September) affecting children <5 years of age. Its activity generally overlaps with influenza. With the occurrence of A(H1N1)pdm09 during the traditional summer peak for RSV in 2009, the RSV summer peak was not observed. Although the spring peak returned in March 2010, the summer peak was again absent in 2010 (Figure 1). However, abnormal early rise of RSV activity was observed in the winter of 2010 that remained until the summer of 2011.
PIV could be detected all year round with relatively higher detection during winter (October to December). The magnitude of the occurrence fluctuated in different years. The predominant type detected was type 1 and type 3 with those <5 years mostly affected. However, an increase in the detection of PIV was observed in warmer month of May–June 2011 when influenza activity was unusually low for the time of the year, this pattern has not been observed previously (Figure 1).
Adenoviruses are generally found all year round with relatively higher detection during winter (November to December). Laboratory surveillance data showed a higher magnitude of occurrence in the summer of year 2005 and 2011 (Figure 1). Type 3 was the most commonly isolated serotype, and the affected persons were mainly in the <5 and 5–14 years age groups.
Discussion
We observed unseasonal pattern of respiratory viruses’ activity in the months following the pandemic of A(H1N1)pdm09: (i) a delay of the influenza summer peak to September 2010 and the lowest influenza activity in June–July 2011, (ii) disappearance of A(H1N1) since November 2009, (iii) an increase in the detection of adenoviruses in June–July 2011, (iv) an increase in the detection of parainfluenza viruses in May–June 2011, and (v) the disappearance of RSV summer peak in 2009 and 2010 and a rise of RSV activity in winter of 2010 that remained until July 2011.
While there are many factors that would favor such changes in circulation of the viruses, other than changes in viral antigenicity and specific herd immunity, the emergence of other respiratory viruses at an unusual time when influenza virus was conspicuously absent could most likely be explained by the lack of viral interference. Peak seasons of influenza generally saw a low activity of PIV and adenoviruses. When the dominating influenza virus came down to a trough, the other viruses became relatively active. However, the magnitude of the activity in different age groups required for the interaction to become epidemiologically visible remained to be determined. The interactivity between influenza virus and other respiratory viruses might be mediated by the antiviral state of the receptor cells. 6 It was shown that once influenza virus infection becomes established, infected cells start producing interferon and other cytokines to cause the cells to enter an antiviral state. This immune reaction could similarly be caused by other virus infection. The interactions between respiratory viruses in human host lead to changes in the circulating viruses and impact on disease pattern. Recent studies from France, 7 showing the interaction between pandemic A(H1N1)pdm09 and RSV, and from Sweden, 8 the interaction between A(H1N1)pdm09 and rhinovirus, also support this hypothesis.
Influenza A subtypes H1N1 [including A(H1N1) and A(H1N1)pdm09)] and H3N2 affected distinct spectra of age groups. The PPS for influenza A subtype H1N1 was higher in younger persons aged <5 and 5–14 than in older persons >59, while influenza A subtype H3N2 was high in both younger persons aged <5 and older persons >59. This suggested that those >59 years might have had protection from previous exposure to similar antigens as explained by the concept of “original antigenic sin” where the first encounter with an influenza virus in earlier age provides the strongest immunity in later years. 9 As the social network of younger population might be different from older population, the knowledge of circulating influenza A subtype would help to deploy resources appropriately for the preventive measures. 10
A surveillance system enables us to detect new and emerging viruses. A change in the prevalence of infection in different aged groups may signal the emergence of novel virus. Influenza demonstrated the best known example of seasonal variation of an infectious disease. Although advanced modeling supporting the concept of interactions is limited, as demonstrated in this work, the introduction of the novel A(H1N1)pdm09 changed the seasonality pattern of influenza virus and also of the other respiratory viruses. This observation of changing virus circulation most likely due to virus interference may yet provide another impetus to study different aspect of antiviral mechanisms.
Supporting information
Table S1. The proportion of positive specimen for influenza viruses by age groups.
Supporting info item
Supporting info item
References
- 1. Monto AS. Viral respiratory infections in the community: epidemiology, agents, and interventions. Am J Med 1995; 99:24S–27S. [DOI] [PMC free article] [PubMed] [Google Scholar]
- 2. Heijnen ML, Dorigo‐Zetsma JW, Bartelds AI, Wilbrink B, Sprenger MJ. Surveillance of respiratory pathogens and influenza‐like illnesses in general practices – the Netherlands, winter 1997–98. Euro Surveill 1999; 4:81–84. [DOI] [PubMed] [Google Scholar]
- 3. Lo JY, Tsang TH, Leung YH, Yeung EY, Wu T, Lim WW. Respiratory infections during SARS outbreak, Hong Kong, 2003. Emerg Infect Dis 2005; 11:1738–1741. [DOI] [PMC free article] [PubMed] [Google Scholar]
- 4. World Health Organization . Standardization of terminology of the pandemic A(H1N1)2009 virus. Available at http://www.who.int/influenza/gisrs_laboratory/terminology_ah1n1pdm09/en/ (Accessed 19 October 2011).
- 5. Cheng PK, Wong KK, Mak GC et al. Performance of laboratory diagnostics for the detection of influenza A(H1N1)v virus as correlated with the time after symptom onset and viral load. J Clin Virol 2010; 47:180–185. [DOI] [PubMed] [Google Scholar]
- 6. Khaitov MR, Laza‐Stanca V, Edwards MR et al. Respiratory virus induction of alpha‐, beta‐ and lambda‐interferons in bronchial epithelial cells and peripheral blood mononuclear cells. Allergy 2009; 64:375–386. [DOI] [PubMed] [Google Scholar]
- 7. Casalegno JS, Ottmann M, Bouscambert‐Duchamp M, Valette M, Morfin F, Lina B. Impact of the 2009 influenza A(H1N1) pandemic wave on the pattern of hibernal respiratory virus epidemics, France, 2009. Euro Surveill 2010;15:pii:19485. [PubMed] [Google Scholar]
- 8. Linde A, Rotzén‐Ostlund M, Zweygberg‐Wirgart B, Rubinova S, Brytting M. Does viral interference affect spread of influenza? Euro Surveill 2009;14:pii:19354. [PubMed] [Google Scholar]
- 9. Francis T Jr. On the Doctrine of Original Antigenic Sin. Proc Am Philos Soc 1960; 104:572–578. [Google Scholar]
- 10. de Jong JC, Lim WL. The seasonality of respiratory virus diseases: implications for SARS? in Peiris M, Anderson LJ, Osterhaus ADME, Stohr K, Yuen JY. (eds): Severe Acute Respiratory Syndrome. Oxford, UK: Blackwell Publishing Ltd, 2005; 131–138. [Google Scholar]
Associated Data
This section collects any data citations, data availability statements, or supplementary materials included in this article.
Supplementary Materials
Table S1. The proportion of positive specimen for influenza viruses by age groups.
Supporting info item
Supporting info item


