

Abstract
In systems biology, it is of great interest to identify new genes that were not previously reported to be associated with biological pathways related to various functions and diseases. Identification of these new pathway-modulating genes does not only promote understanding of pathway regulation mechanisms, but also allows identification of novel targets for therapeutics. Recently, biomedical literature has been considered as a valuable resource to investigate pathway-modulating genes. While the majority of currently available approaches are based on the co-occurrence of genes within an abstract, it has been reported that these approaches show only sub-optimal performances due to the fact that 70% of abstracts contain information only for a single gene. To overcome such limitation, we propose a novel statistical framework based on the concept of ontology fingerprint that uses gene ontology to extract information from large biomedical literature data. The proposed framework simultaneously identifies pathway-modulating genes and facilitates interpreting functions of these new genes. We also propose a computationally efficient posterior inference procedure based on Metropolis-Hastings within Gibbs sampler for parameter updates and the poor man’s reversible jump Markov chain Monte Carlo approach for model selection. We evaluate the proposed statistical framework with simulation studies, experimental validation, and an application to studies of pathway-modulating genes in yeast. The R implementation of the proposed model is currently available at https://dongjunchung.github.io/bayesGO/.
Keywords: Bayesian hierarchical model, biological pathway, gene ontology, literature search, ontology fingerprint
1. Introduction
System biology aims to develop computational and mathematical models to describe complex biological systems, by considering molecules, cell, and organisms as biological components constituting this system. In system biology, the study of interaction between these biological components is of main interest as it allows to understand the dynamics resulting in various functions and behaviors of the system. Biological pathway is the de facto functional unit in system biology and a pathway is defined as a set of genes interacting to make aggregate function. For example, the mitogen-activated protein kinase (MAPK) signaling pathway consists of 267 genes in the human genome and is involved in various cellular functions, including cell proliferation, differentiation and migration. More importantly, mutations of genes in this pathway have been reported to be involved in the development of multiple types of cancers. Hence, potential cancer treatments might be developed by reversing or blocking undesirable behaviors of the genes in this pathway. As implied in this example, discovering new genes that potentially modulate a pathway of interest does not only promote understanding of pathway regulation mechanism but also provide novel targets for therapeutics.
In spite of its importance, the identification of new pathway-modulating genes remains challenging because pathways often consist of many components, some pathways are only ambiguously or improperly defined, and the biological links between a pathway and genes influencing its activity may not be obvious. Hence, various genomic and genetic studies have been implemented to discover interaction among genes. For example, genetic interaction and co-expression patterns can be identified from genome-wide association studies and RNA-seq studies, respectively, while various relationships between a regulator and its target genes can be inferred with ChIP-seq and CLIP-seq experiments at transcriptional and translational levels, respectively. However, these approaches are limited as they focus on only one specific aspect of biology while two genes can be linked through various biological relationships such as genetic association, epigenetic association, protein-protein interaction, among others. Although some approaches like YeastNet [1] tried to overcome this limitation by combining the results from multiple sources to identify novel gene interactions, effective integration of these results is not a trivial task. More importantly, its performance can be affected by the quality of individual data sets [2].
Recently, biomedical literature has been considered as a valuable resource to investigate relationship among genes. Especially, PubMed (http://www.ncbi.nlm.nih.gov/pubmed), developed and maintained by the National Center for Biotechnology Information (NCBI) at the National Institutes of Health (NIH), is a free and popular resource for biomedical literature comprising over 24 million citations. In contrast to the approaches described in the previous paragraph, biomedical literature is not restricted to certain aspects of biology and relationship among genes is comprehensively characterized throughout the history of biomedical research. However, effective mining of valuable information from biomedical literature still remains a challenging task. Currently, the majority of approaches mining biomedical literature [3, 4] are based on the assumption that two genes are functionally related if they appear together within the same biomedical literature (Figure 1a). However, the utility of these approaches is limited by the fact that 70% of PubMed abstracts contain information about only a single gene (only about 83,000 PubMed articles are annotated with two or more human genes while over 160,000 annotated with only a single gene). In addition, information in abstracts is often utilized deterministically while uncertainty in discovery of gene-gene relationship is not taken into account properly.
Figure 1.
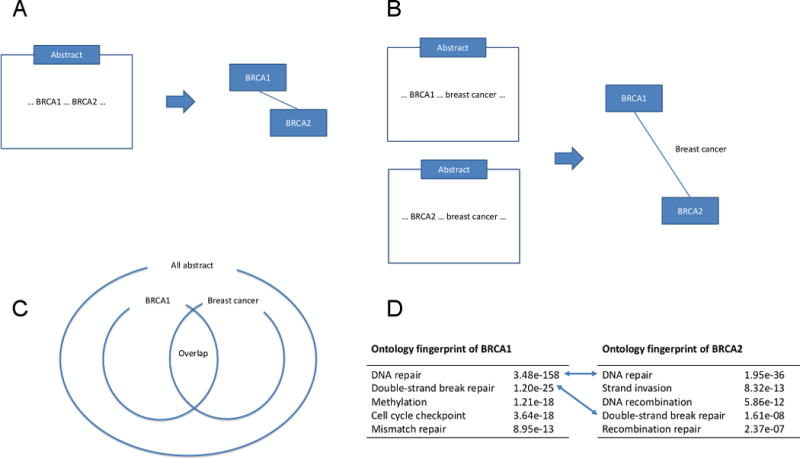
The Bayesian ontology fingerprint framework. In traditional approaches, two genes are claimed to be related if they often appear together in the same abstract (a). In contrast, in the ontology fingerprint framework, two genes are considered to be related if they are often described to be related to similar functions, or equivalently if they often share the same gene ontology (GO) terms (b). More precisely, we first implement a hypergeometric test for each gene and GO term pair to calculate the degree of enrichment of a GO term for a gene, while also taking into account the uncertainty in this association prediction (c). Then, the ontology fingerprint for a gene is defined as a set of GO terms over-represented in the abstracts linked to the gene, along with enrichment p-values corresponding to these terms (d). Finally, two genes are claimed to be related if similar GO terms are enriched for both of them, which is rigorously evaluated using our Bayesian hierarchical model.
In order to address these limitations of currently available methods, we propose a novel statistical framework for biomedical literature mining. Some key features of the proposed statistical framework can be summarized as follows. First, we address the limitation of co-occurrence-based approaches by utilizing the idea of ontology fingerprint. This approach does not only allow to identify indirect relationship among genes using gene ontology (GO) information, but also effectively extracts information from biomedical big data and summarizes them to manageable size. Second, the proposed Bayesian hierarchical model effectively identifies hidden pathway structure and addresses redundancy and correlation among GO terms. Third, our poor man’s reversible jump Markov chain Monte Carlo (RJMCMC) approach gracefully addresses the model selection problems introduced for identification of gene and GO term clusters. Finally, the proposed Metropolis-Hastings within Gibbs sampler allows the computationally efficient implementation of posterior inference.
This paper is structured as follows. In Section 2, we propose a novel statistical framework for biomedical literature mining, based on the idea of ontology fingerprint and a Bayesian hierarchical model. In Section 3, we evaluate the proposed method with simulation studies. In Section 4, we further evaluate the proposed method with experimental validation and apply it to biomedical literature mining studies of pathway-modulating genes in yeast. In Section 5, we discuss our future research directions.
2. Methods
2.1. Ontology Fingerprint
Recently, we developed the concept of ontology fingerprint [5] for biomedical literature mining to overcome the limitation of traditional approaches based on co-occurrence of genes in an abstract (Figure 1a). The key idea of ontology fingerprint is to consider indirect relationships between genes in biomedical literature mining. Specifically, we consider two genes to be related to each other if each of these two genes are described for similar biological functions in its corresponding abstract (Figure 1b). However, in such approaches, it is possible that two functionally identical genes can be described with similar but slightly different terms. Hence, it is critical to have a systematic way to describe functions of genes while their vocabulary is rich enough to reflect complexity of biology. Based on this rationale, we use the terms compiled in the Gene Ontology (GO) database (http://geneontology.org) for biomedical literature mining because it provides a set of structured, precisely defined, common, and controlled vocabularies to describe the role of genes and their products in any organism.
After we search abstracts using genes and GO terms, a hypergeometric test is performed on each pair of gene and GO term to determine the degree of enrichment of GO terms for a gene, where each abstract is considered as an observation in the space of literature (Figure 1c). Specifically, we calculate the hypergeometric p-value for the pair of i-th gene and t-th GO term as
where N is the total number of abstracts, Ni is the number of abstracts associated with i-th gene, Nt is the number of abstracts associated with t-th GO term, and Nti is the number of abstracts associated with both t-th GO term and i-th gene. Note that the mid p-value approach was used in this calculation to address the discreteness of the hypergeometric distribution. This approach does not only effectively extract information from abstracts and reduce search space to the manageable size, but also allows to take into account complexity in discovery of these relationships, e.g., specificity of description in an abstract, abstractness of GO terms, among others. Finally, the ontology fingerprint for a gene is defined as a set of GO terms over-represented in the abstracts linked to the gene, along with the enrichment p-values corresponding to these terms from hypergeometric tests (Figure 1d). While these enrichment p-values have great potential to improve biomedical literature mining, effective utilization of this information is not trivial.
In our previous work [5], we considered a correlation-like measure to quantify relationships among genes. However, this measure was not based on a data generative model and as a result, it was not easy to interrogate its properties and measure its uncertainties in inference for relationship among genes. In addition, inference procedures were laborious and inefficient because inference steps were not integrated. Specifically, relationships among genes were first determined using a hierarchical model and then, gene clusters were identified by applying existing clustering algorithms to the results from this fitted model. Finally, functions of each gene cluster were investigated by checking which GO terms are enriched for these genes. In order to effectively address these challenges, in this paper, we propose a novel Bayesian hierarchical model described in Section 2.2. We note that our previous work [5] only constitutes the basis for mining and preprocessing of biomedical literature. The proposed Bayesian hierarchical model to analyze these biomedical literature mining results is the unique contribution of this paper. We also note that our approach is not equivalent to a meta-analysis. Specifically, meta analysis aims to combine evidences for genes (e.g., p-values) across literature. In contrast, the proposed approach rather considers each abstract as a single observation and ignores evidence for genes provided in each literature.
This paper was directly motivated by the study of identifying pathway-modulating genes for yeast using the PubMed literature. In this study, we downloaded the 12/30/2009 version of PubMed abstracts in XML format and processed them to extract the PubMed ID and the text of each abstract. We extracted GO terms and their descriptions from the 12/20/2009 version of the GO database compiled by the Gene Ontology Consortium. We used a total of 46,524 abstracts linked to at least one yeast gene and 7,258 GO terms linked to these abstracts, to analyze 5,983 yeast genes. In order to avoid unspecific association between genes and GO terms, we used only the abstracts annotating at most 100 genes and also excluded general GO terms. Then, a hypergeometric test was performed on each pair of yeast gene and GO term (Figure 1c).
We summarized the p-values from these hypergeometric tests as a matrix, where rows and columns correspond to GO terms and genes, respectively. We note that multiple testing adjustment is not a critical issue here because we do not use p-values to make conclusions and multiple testing adjustment essentially only affects the emission distribution modeling. Based on this rationale, we used the original p-values instead of adjusted ones in the modeling. We also note that there are many missing cells in this matrix because if we do not observe a pair of a GO term and a gene in abstracts, then we do not have corresponding p-value at all. For example, 60% cells are missing even when we considered 100 rows (GO terms) and 116 columns (genes) with least number of missing cells (Section 4.2). One approach to handling these missing cells is to consider them as missing observations in the model, estimate (impute) them, and utilize them for the inference. However, in our modeling below, we ignore these missing cells instead of imputing them due to the following two reasons. First, accurate inference for these missing cells are not of main interest because they correspond to uninteresting gene-GO term pairs and these cells have only limited information to improve clustering of genes and GO terms. Second, we can speed up our inference multiple times faster by ignoring these missing cells, as it reduces the number of parameters significantly. Based on this rationale, we consider only the non-missing gene-GO term pairs as observations in the hierarchical model described below.
2.2. Bayesian Hierarchical Model
In this section, we describe a Bayesian hierarchical model to identify unreported pathway-modulating genes and facilitate functional interpretation of these genes, using the biomedical literature mining data described in Section 2.1. From the hypergeometric test described in Section 2.1, we have the p-value of the hypergeometric test (Yti) for the gene i = 1, ⋯, G and the GO term t = 1, ⋯, T. For modeling purposes, we take a probit transformation of these p-values, which facilitates easier data visualization and modeling [6], i.e., Zti = Φ−1 (Yti), where Φ (·) is the cumulative distribution function for standard normal distribution. We assume that G genes constitute unobserved K gene clusters based on the exploratory analysis of data (Figure S1a) and genes in the same cluster are considered to be related to similar functions. Note that here we assume that a gene can belong to only a single gene cluster. In addition, there is also strong correlation among GO terms (Figure S1b), mainly because gene ontology is designed as a directed acyclic graph (DAG) structure [7]. In order to take this into account, we further assume that T GO terms constitute V unobserved GO term clusters. Note that in theory, we can model the relationship among GO terms as a DAG, as gene ontology is originally designed. However, in our application, accurate estimation of the relationship among GO terms is not of main interest and it suffices to utilize the relationship among GO terms to improve interpretation of gene clustering results. Moreover, modeling the relationship among GO terms as a DAG will increase the computational burden significantly, which is not desirable when we consider its role in our model. Based on this rationale, we model the relationship among GO terms as clusters instead of a DAG. We denote the membership of i-th gene to a gene cluster as Mi and the membership of t-th GO term to a GO term cluster as Lt, where Mi ∈ {1, ⋯, K} and Lt ∈ {1, ⋯, V }. Finally, in order to reflect the fact that each gene cluster can be described with a set of related GO terms, we introduce a binary indicator for the enrichment of t-th GO term for i-th gene, denoted as Eti, where Eti = 1 if t-th GO term is enriched for i-th gene and Eti = 0 otherwise.
The main distribution hierarchy of the proposed model is as follows.
for t = 1, ⋯, T and i = 1, ⋯, G. Note that here we assume K and V to be known. In Section 2.3, we will discuss how we implement data-driven selection of K and V using the poor man’s reversible jump Markov chain Monte Carlo approach.
Emission distribution for hypergeometric test p-values
Conditional on the enrichment status (Eit), we model the emission distribution for the probit-transformed p-value from hypergeometric test for t-th GO term and i-th gene (Zti), using a mixture of Gaussian densities. Specifically, if t-th GO term is not enriched for i-th gene (Eti = 0), we assume that (Zti|Eti = 0, μi0, τi0) ~ N(μi0, 1/τi0), for t = 1, ⋯, T and i = 1, ⋯, G. Note that this corresponds to the empirical null distribution approach [6], which is often employed in genomic applications such as differential gene expression analysis. On the other hand, when t-th GO term is enriched for i-th gene (Eti = 1), we assume that (Zti|Eti = 1, μi1, τi1) ~ N (μi1, 1/τi1). Note that here we consider gene-specific distributions of enriched p-values because we expect that there might be huge variation in degree of study (e.g., number of abstracts describing each gene) among genes, which results in significantly different shapes of distributions for p-values. This was also confirmed in our exploratory data analysis.
Enrichment of GO terms for genes
Conditional on the cluster index for i-th gene (Mi) and the cluster index for t-th GO term (Lt), we model the enrichment of t-th GO term for i-th gene (Eti) using Bernoulli trials. In our application, it is reasonable to assume that genes belonging to the same gene cluster can be described with similar GO terms because genes in the same pathway are involved in similar biological processes. On the other hand, it is also reasonable to assume that GO terms in the same GO term cluster are associated with similar set of genes because these GO terms describe similar biological processes that characterize functions of a pathway (Figure S1b). We incorporate such information about enrichment structure into the model by making a single distribution shared among gene-GO term pairs belonging to the same gene and GO term clusters. Based on this ratioale, we model the enrichment of t-th GO term for i-th gene as (Eti|Θ, Lt, Mi) ~ Bernoulli(θLtMi), for t = 1, ⋯, T and i = 1, ⋯, G.
2.3. Model Selection
One of the challenging issues in clustering problems is how to determine unknown number of clusters. In this paper, we model the clustering of genes and the clustering of GO terms using the poor man’s Reversible Jump Markov Chain Monte Carlo (RJMCMC), which is a special case of Metropolised Carlin and Chib algorithm [8, 9]. This approach often avoids complicated component split and combine procedures, which are challenging in the application of RJMCMC. On the other hand, this method still retains advantages of RJMCMC, such as the data-driven model selection within posterior sampling and the reflection of uncertainty due to model selection on inference.
Gene clustering
We first describe the modeling of membership of i-th gene to a gene cluster. Let us denote the maximum possible number of gene clusters as Kmax while K be the effective number of gene clusters, i.e., K ≤ Kmax. In other words, we assume that there are K number of gene clusters while we consider up to Kmax number of gene clusters. Then, we generate the cluster index for i-th gene (Mi) as follows.
for i = 1, ⋯, G and k = 1, ⋯, Kmax. In this framework, can be interpreted as relative proportion of genes in k-th cluster while ϕk indicates whether k-th cluster participates in the model or not. Then, final value for proportion of genes in k-th cluster (αk) is calculated using only the clusters that participate in the model (ϕk = 1).
GO term clustering
We model the membership of t-th GO term to a GO term cluster in a similar way. Again, let us denote the maximum possible number of GO term clusters as Vmax and the effective number of GO term clusters as V, i.e., V ≤ Vmax. Then, we generate the cluster index for t-th GO term (Lt) as follows.
for t = 1, ⋯, T and υ = 1, ⋯, Vmax.
Determination ofKmax and Vmax
As Kmax and Vmax determine only upper bounds for the numbers of gene clusters and GO term clusters, it suffices to set them large enough so that K < Kmax and V < Vmax. In our experience of analyzing real datasets, we found that a good rule of thumb is to set Kmax = 0.1G and Vmax = 0.1T. Moreover, it is also straightforward to check whether Kmax or Vmax are not large enough by monitoring K and V values across the MCMC iterations. Specifically, if Kmax or Vmax are set too low, K and V frequently hit their upper bounds (i.e., K = Kmax or V = Vmax) and in this case, we can simply increase Kmax and Vmax values and re-run the MCMC.
2.4. Posterior Inference
Key quantities
The proposed Bayesian framework provides key quantities that allow to identify novel pathway-modulating genes and facilitate easy interpretation of these genes. First, the number of gene clusters (pathways) and the number of GO term clusters can be inferred from Pr(Σk ϕk|·) and Pr(Συ λυ|·), respectively. Genes modulating the same pathway can be identified using Pr(Mi|·), while Pr(Lt|·) can be used to identify a group of GO terms describing similar functions. Finally, function for a pathway can be investigated by checking the pattern of Pr(Eti|·).
Prior specification
We consider semi-conjugate priors for the emission distributions and a conjugate prior for the enrichment status, i.e., μi1 ~ N (ζ1, 1/ξ1), τi1 ~ Gamma (2, 1), μi0 ~ N (ζ0, 1/ξ0), τi0 ~ Gamma (2, 1), and θυk ~ Beta (θ01, θ02) while we restrict the range of μi0 to (−5, 0) to avoid identifiability issues. Note that the range (−5, 0) in the probit scale corresponds to (2.87e − 7, 0.5) in the scale of original p-values, which is wide enough to cover centers of background p-values. Hyperpriors are specified in weakly informative ways, i.e., ζ1 ~ N (0, 1002), ξ1 ~ Gamma (2, 1), ζ0 ~ N (0, 1002), ξ0 ~ Gamma (2, 1), θ01 ~ Gamma (0.1, 0.1), θ02 ~ Gamma (0.1, 0.1), η ~ Beta (1, 1), ε ~ Beta (1, 1), α0 ~ Gamma (0.1, 0.1), and β0 ~ Gamma (0.1, 0.1). Sensitivity analysis in Section 3 in the supplementary materials indicates that the posterior inference results are only marginally affected by misspecification of priors.
Posterior sampling
We carried out the posterior sampling with the mixed Gibbs-Metropolis algorithm. We summarize the algorithm as follows.
For i = 1, ⋯, G and t = 1, ⋯, T, update Eti from its Bernoulli full conditional.
For i = 1, ⋯, G, update Mi from its categorical full conditional.
For t = 1, ⋯, T, update Lt from its categorical full conditional.
For υ = 1, ⋯, Vmax, update λυ from its Bernoulli full conditional.
For k = 1, ⋯, Kmax, update ϕk from its Bernoulli full conditional.
For υ = 1, ⋯, Vmax and k = 1, ⋯, Kmax, update θυk from its Beta full conditional.
Update η from its Beta full conditional.
Update ε from its Beta full conditional.
For i = 1, ⋯, G, update μi1 from its Normal full conditional.
For i = 1, ⋯, G, update τi1 from its Gamma full conditional.
For i = 1, ⋯, G, update μi0 from its Normal full conditional.
For i = 1, ⋯, G, update τi0 from its Gamma full conditional.
Update ζ1 from its Normal full conditional.
Update ξ1 from its Gamma full conditional.
Update ζ0 from its Normal full conditional.
Update ξ0 from its Gamma full conditional.
Update (α*, β*, α0, β0, θ01, θ02) using a Metropolis-Hastings algorithm.
Sections 1 and 2 in the supplementary materials provide complete details about the posterior inference and implementation, including full conditional distributions. We note that most of the parameter updates (Steps 1 – 16) can be efficiently implemented using Gibbs samplers based on explicit forms of full conditional distributions. For example, even our suboptimal JAGS implementation of the proposed model to analyze 74 genes and 112 GO terms in Section 4.1 took only 80 minutes for the MCMC updates of two chains, each of 30,000 iterations, using a single 2.10 GHz CPU. For all the analysis results in Sections 3 and 4, the burn-in period of 20,000 samples with 2 chains was used to evaluate the convergence of the chains and, after the burn-in, a sample of 10,000 iterations was obtained as the converged posterior sample. We evaluated convergence of two chains with Gelman-Rubin statistics [10] and visual inspection of trace plots. Diagnostics plots for the real data applications in Section 4 can be found in Figures S5 – S8. No significant violation of convergence was detected in these diagnostics. Finally, we evaluated the proposed model using the posterior predictive checking based on the real data applications in Sections 4.1 and 4.2 and the results (Figure S9) indicate that the proposed model nicely fits the real data.
3. Simulation Studies
We first evaluated the proposed Bayesian hierarchical model using simulation studies based on 100 genes and 100 GO terms. Specifically, We considered the following four simulation settings, which mimic various cases that occur in the real data such as ones in Sections 4.1 and 4.2. True gene clusters (Mi), GO term clusters (Lt), and enrichment matrix (Eti) corresponding to these four settings are depicted in Figures 2a, 2c, 3a, and 3c.
Simulation setting # 1 (Figure 2a): 4 gene clusters have their own GO term clusters, where sizes of gene and GO term clusters are generated from Multinomial(100, (0.25, 0.25, 0.25, 0.25)).
Simulation setting # 2 (Figure 2c): 3 gene clusters have their own GO term clusters and there also exist genes and GO terms without association. Sizes of gene and GO term clusters (3 clusters and a group of background genes/GO terms) are generated from Multinomial(100, (0.25, 0.25, 0.25, 0.25)).
Simulation setting # 3 (Figure 3a): 3 gene clusters have their own GO term clusters with various cluster sizes, where sizes of gene and GO term clusters are generated from Multinomial(100, (0.5, 0.25, 0.25)).
Simulation setting # 4 (Figure 3c): 3 gene clusters have their own GO term clusters while one additional GO term cluster is shared across these 3 gene clusters. Sizes of gene clusters are generated from Multinomial(100, (0.33, 0.33, 0.33)) while sizes of GO term clusters are generated from Multinomial(100, (0.25, 0.25, 0.25, 0.25)).
Given the settings above, we generated probit-transformed p-values (Zti) from N (0, 1) if Eti = 0 (i.e., background) and from N (μi1, 1/τi1) if Eti = 1 (i.e., signal) for i = 1, ⋯, 100 and t = 1, ⋯, 100, where μi1 ~ U (−5, −1) and τi1 ~ U (0.1, 0.3) for i = 1, ⋯, 100. In addition, we also considered the simulation data generated with μi1 ~ U (−10, −5) and τi1 ~ U (0.5, 1) to evaluate the effect of signal-to-noise ratios (Figures S2a, S2c, S3a, S3c).
Figure 2.
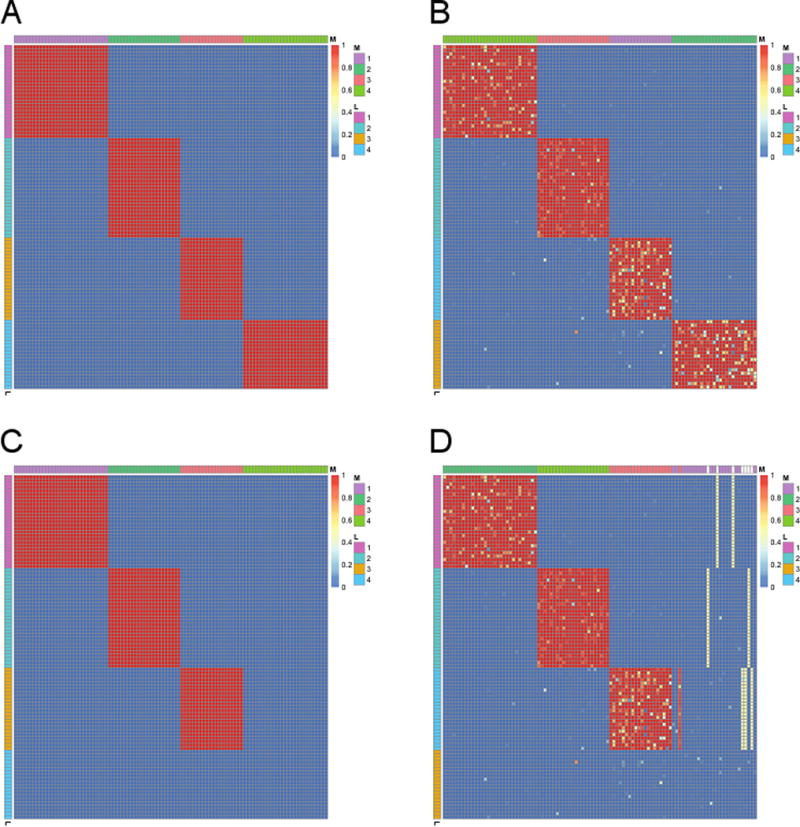
True and estimated enrichment matrices (Eti) for simulation studies #1 (a, b) and #2 (c, d). In each heat map, rows and columns correspond to GO terms and genes, respectively. Yellow and red colors indicate that a GO term is enriched for a gene (Eti close to one; signal) and otherwise (Eti close to zero; background), respectively. Side colorbars on the left and on the top indicate GO term indices (Lt) and gene cluster indices (Mi), respectively.
Figure 3.
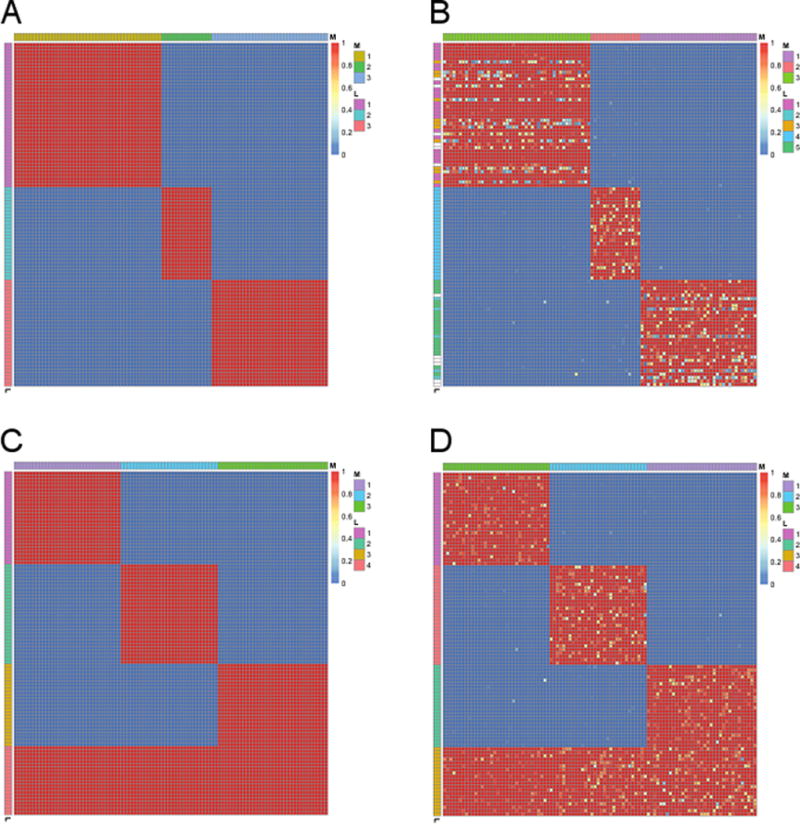
True and estimated enrichment matrices (Eti) for simulation studies #3 (a, b) and #4 (c, d). In each heat map, rows and columns correspond to GO terms and genes, respectively. Yellow and red colors indicate that a GO term is enriched for a gene (Eti close to one; signal) and otherwise (Eti close to zero; background), respectively. Side colorbars on the left and on the top indicate GO term indices (Lt) and gene cluster indices (Mi), respectively.
Overall, the proposed model could successfully identify true gene clusters (Mi) and GO term clusters (Lt) with high confidence while also recovering the enrichment matrix (Eti) that is almost identical to the true one even when signal-to-noise ratio is relatively weak (Figures 2b, 2d, 3b, 3d; see Figures S2b, S2d, S3b, S3d for the settings with higher signal-to-noise ratio). We note that our second simulation study has especially practical implication because it corresponds to the case that some uninformative genes and GO terms are also included in the data due to insufficient prior knowledge. In this case, the proposed model identified 4 gene clusters (Mi) and 4 GO term clusters (Lt), where genes without associated GO terms constitute one cluster and similarly, GO terms without associated genes constitute one cluster (Figure 2d). This can be practically useful property because it provides easy post-processing guideline. Specifically, if we identify gene or GO term clusters without strong enrichment after we fit the proposed model, we can simply throw them away as a group instead of checking each gene or GO term individually.
During this study, we recognized that applications of bi-clustering algorithms to the matrix of probit-transformed p-values could potentially be alternative solutions to identify gene and GO term clusters because bi-clustering algorithms aim to cluster rows and columns simultaneously. In order to investigate this possibility, we studied popular bi-clustering algorithms, including the Cheng and Church algorithm [11] and the Plaid model [12], all of which are implemented in the R package biclust. However, bi-clustering methods actually turned out to be sub-optimal solutions for this problem due to the following two reasons. First, while many real biomedical literature datasets, such as ones considered in Sections 4.1 and 4.2, have significant amount of missing cells in the matrix of probit-transformed p-values, most bi-clustering algorithms are not tailored for a dataset with large proportion of missing cells. Second, even when we assume that there are no missing cells at all, these bi-clustering algorithms failed to identify correct gene and GO term clusters for the simulation datasets above (Figure S4). This is mainly because these algorithms tried to identify a block that can explain a large proportion of matrix after reordering rows and columns. Specifically, the Cheng and Church algorithm identifies blocks by minimizing the averaged squared errors while the Plaid model identifies blocks by minimizing the sum of squared errors. Hence, these methods essentially prefer to identify a larger block with smaller within-variance. However, in many real biomedical literature datasets such as ones considered in Sections 4.1 and 4.2, signal components (GO terms associated with genes) usually have larger variances than background components (GO term-gene pairs without association) while background components also correspond to a large proportion in the data matrix. As a result, biclutering algorithms prefer to identify blocks corresponding to backgrounds rather than signals. In contrast, the proposed model does not suffer from these issues because it takes into account such background and signal structure. We also considered various transformations of p-values (e.g., Yti, 1 − Yti, Φ−1 (Yti), and Φ−1 (1 − Yti)) and confirmed that this conclusion still remains valid. Finally, from the practical point of view, it is often not trivial to use these biclustering algorithms because these methods have multiple tuning parameters, which are not easy to tune and highly data-specific. In contrast, the proposed statistical model does not require such tuning and the only data-specific parameters are the maximum numbers of gene and GO term clusters, which are relatively easy to specify. In summary, the proposed model does not only outperform popular biclustering approaches, but also provides practical benefits compared to them, such as easier tuning and natural handling of missing values.
4. Application to the Yeast PubMed Data
4.1. Experimental validation
As an additional evaluation of the proposed model in addition to the simulation studies, in this section, we implemented an experimental validation study for the proposed model using yeast (Saccharomyces cerevisiae). Specifically, we utilized the experimental validation data from [5], which provides 30 sphingolipid pathway genes selected by the sphingolipid expert (“known genes”), 14 genes that were experimentally validated to be associated with the sphingolipid pathway (“positive control genes”), and 30 genes that were experimentally shown not to be associated with the sphingolipid pathway (“negative control genes”) in yeast. We considered these 74 genes here, while 14 and 30 genes in the second and third groups are considered as positive and negative controls, respectively. Then, we considered 112 GO terms that appeared most often with these 74 genes in the analysis.
We first evaluated GO term clustering performance. Based on the median number of GO term clusters (Συ λυ = 6; Figure S10a), we post-processed GO term clustering results by assuming 6 clusters (Section 2 in the supplementary materials) and the clusters 1 – 6 have 13, 5, 59, 12, 11, and 12 GO terms, respectively (Figure S11a). When we removed GO terms that were assigned to a cluster less than 90% of MCMC iterations (maxυ P (Lt = υ|·) ≤ 0.9) from each cluster, the GO term clusters 1 – 6 have 2, 4, 17, 0, 6, and 9 GO terms, respectively (Table S1). Essentially, the proposed model could effectively group GO terms describing similar biological functions, i.e., ceramide metabolic processes (cluster 1), sphingolipid metabolic processes (cluster 2), steroid metabolic processes and positive regulation of metabolic processes (cluster 3), fatty acid metabolic processes (cluster 5), and transferase activities (cluster 6). Furthermore, this result indicates that incorporating GO terms that are not well associated with genes of interest into the analysis does not degrade performance of the proposed model, and such GO terms can be easily detected based on the patterns of GO term clustering results. This again confirms our observation in our second simulation study with background genes.
We next evaluated the gene clustering performance for the 74 genes we considered. Based on the median number of gene clusters (Σk ϕk = 4; Figure S10b), we post-processed gene clustering results by assuming 4 clusters and the clusters 1 – 4 have 10, 19, 15, and 30 genes, respectively (Figure S11b; Table 1). When we removed genes that were assigned to a cluster less than 90% (maxk P (Mi = k|·) ≤ 0.9) from each cluster, the clusters 1 – 4 have 1, 9, 5, and 11 genes, respectively (Table 1). The known genes were assigned to the gene clusters 2 – 4, while all the positive control genes were assigned to the gene cluster 4. Negative control genes were almost equally distributed across four clusters but most of them were removed after the filtering step. Moreover, no known or positive control genes were assigned to the gene cluster 1 to which one thirds of the negative control genes were assigned. This result indicates that the proposed model has power to distinguish the negative control genes from the known and the positive control genes. As it is interesting for the known genes (i.e., the genes that are considered to belong to the same biological pathway, according to the expert) to make multiple clusters, we further studied whether there are any differences between known genes in clusters 2, 3, and 4. Specifically, we checked the pathway “sphingolipid metabolism” reported in the Saccharomyces Genome Database (http://www.yeastgenome.org/), the most well established pathway database for yeast genome (Figure S12). The known genes assigned to the gene cluster 2 are specifically associated with the two units, “dihydrosphingosine (DHS)” and “phytosphingosine (PHS)”, while the known genes assigned to the gene cluster 3 are essentially involved in all the steps in this pathway. The known genes assigned to the gene cluster 4 are specifically associated with the two units, “serine palmitoyltransferase” and “ceramide synthase”. This also explains why all the positive control genes belong to cluster 4 because these genes were experimentally validated using myriocin, which is known to specifically inhibit serine palmitoyltransferase and ceramide. This result shows that the proposed model has sensitivity to separate out biologically distinct gene clusters that could potentially be missed even by human experts.
Table 1.
Evaluation of gene clustering results for the experimental validation. The first block of table shows the gene clustering results compared with the known genes, the positive control genes, and the negative control genes. The second block of table shows the results after the filtering step (removing genes that were assigned to a cluster less than 90% of MCMC iterations (maxk P (Mi = k|·) ≤ 0.9) from each cluster).
| Gene cluster | 1 | 2 | 3 | 4 |
|---|---|---|---|---|
| (before filtering) | ||||
| Known genes | 11 | 12 | 7 | |
| Positive control genes | 2 | 12 | ||
| Negative control genes | 10 | 6 | 3 | 11 |
|
| ||||
| (after filtering) | ||||
| Known genes | 8 | 5 | 6 | |
| Positive control genes | 5 | |||
| Negative control genes | 1 | 1 | ||
In order to further characterize three gene clusters, we investigated the GO terms associated with each gene cluster (Eti; Figure 4a). First of all, Figure 4b shows that the GO term cluster 2 (sphingolipid pathway) is specifically associated with the known genes while there were almost no abstract describing the positive and negative control genes with the GO terms in cluster 2. This makes good sense because known genes were chosen based on prior knowledge about association with sphingolipid pathway, while positive and negative control genes were not previously reported to be associated with sphingolipid pathway. Moreover, Figure 4b shows that there are multiple subgroups of genes within the known genes with respect to their associations with GO term clusters 1, 5, and 6. On the one hand, the known genes were assigned to the gene clusters 2 – 4 and all of these three gene clusters were associated with the GO term cluster 2 (sphingolipid pathway). On the other hand, the gene cluster 2 is associated with the GO term cluster 5 (fatty acid metabolic processes), the gene cluster 3 is associated with the GO term cluster 1 (ceramide metabolic processes), and the gene cluster 4 is associated with both the GO term clusters 1 (ceramide metabolic processes) and 6 (transferase activities). This again confirms our observation that there are three subgroups of genes among the known genes, and it also further explains that these three gene subgroups are mainly different in their functions for other metabolisms and transferase activities. This result illustrates sensitivity of the proposed model in identification of pathway-modulating genes and it also shows that enrichment patterns of GO terms for genes (Eti) can be an effective tool to facilitate functional interpretation for novel pathway-modulating genes.
Figure 4.
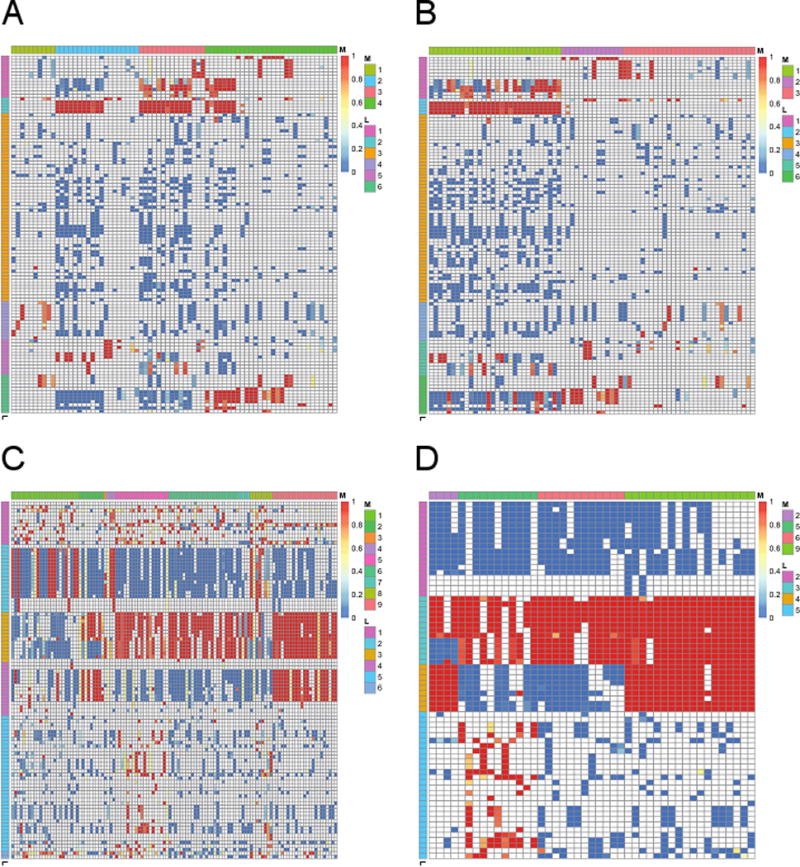
Association of GO terms with genes (Eti). (a) and (b) show the results for experimental validation study and (c) and (d) show the results for de novo identification of pathway-modulating genes. In each figure, pink and lightblue colors indicate strong (Eti close to one) and weak evidence (Eti close to zero) for association, and white colors means missing cells. Side colorbars on the left indicate the GO term cluster indices (Lt). Side colors on the top indicate gene cluster indices (Mi) in (a), (c), and (d), while they mean known genes (1), positive control genes (2), and negative control genes (3) in (b). For the de novo identification of pathway-modulating genes, we provide the results for all GO terms (rows) and genes (columns) in (c) and the results for the GO terms (rows) and genes (columns) that were assigned to a cluster in more than 90% of MCMC iterations (maxυ P (Lt = υ|·) > 0.9 and maxk P (Mi = k|·) > 0.9) in (d). Here, the colors in side colorbar on the top correspond to the gene clusters 2, 5, 6, and 9.
4.2. de novo identification of pathway-modulating genes
As we confirmed the power of the proposed model in identification of pathway-modulating genes and interpretation of their functions, we now apply the proposed hierarchical model to more arbitrary chosen set of genes, in order to evaluate its de novo knowledge discovery performance. Specifically, we considered 116 genes with the largest number of observed p-values and chose 100 GO terms that were observed most often with these 116 genes. Note that unlikely the previous section, no biological expert knowledge was used to select these 116 genes. Based on the median number of GO term clusters (Συ λυ = 6; Figure S10c), we post-processed GO term clustering results by assuming 6 clusters and the clusters 1 – 6 have 12, 19, 14, 15, 38, and 2 GO terms, respectively (Figure S11c). When we removed GO terms that were assigned to a cluster less than 90% of MCMC iterations (maxυ P (Lt = υ|·) ≤ 0.9) from each cluster, the GO term clusters 1 – 6 have 0, 18, 13, 9, 28, and 0 GO terms, respectively (Table S2). We found that GO term clusters 2 – 5 correspond to condition-dependent catabolic processes and positive regulation of biological processes (GO term cluster 2), glycolysis and catabolic processes (GO term cluster 3), metabolic processes (GO term cluster 4), and cell wall organization, homeostasis and localization (GO term cluster 5), respectively. Note that all the GO term clusters related to metabolic and catabolic processes (GO term clusters 2, 3, and 4) are not significantly affected by the filtering step, which implies high confidence clusters.
We next evaluated gene clustering results for the 116 genes under consideration. Based on the median number of gene clusters (Συ λυ = 6; Figure S10d), we post-processed gene clustering results by assuming 10 clusters but only 9 clusters remained after the post-processing of cluster indices. The gene clusters 1 – 9 have 24, 9, 1, 3, 19, 25, 4, 8, and 23 genes, respectively (Figure S11d; Table 2). When we removed genes that were assigned to a cluster less than 90% (maxk P (Mi = k|·) ≤ 0.9) from each cluster, the gene clusters 1, 3, 4, 7, and 8 were totally eliminated and the gene clusters 2, 5, 6, and 9 have 4, 11, 12, and 18 genes, respectively (Table 2). We further investigated these gene clustering results using the KEGG database [13] as a ground truth because the pathway annotation provided by the KEGG database is human curated and considered as high quality. Here, we first focus on the “Glycolysis/Gluconeogenesis” (“sce00010”) pathway in the KEGG database because this pathway overlapped most with the 116 genes we considered. The gene clusters 9 (18 genes) and 6 (12 genes) together shared 15 genes with the 21 genes that were previously reported to be associated with this pathway in the KEGG database (Table 2). Specifically, these 15 genes include GLK1, FBP, PGI1, TDH1, TDH3, FBA1, PCK1, ADH1, ADH2, ALD6, ENO2 (gene cluster 9), PDC5, ACS1, ACS2, and CDC19 (gene cluster 6). In addition, the proposed model also identified 15 novel genes that might be potentially related to the glycolysis pathway, including IDP2, ILV5, GPD1, GRR1, BIO5, HXT4, STB5 (gene cluster 9), SNF3, RGT2, ACH1, MIG1, SUC2, SIP3, CIT3, and YAP3 (gene cluster 6). We found that both the gene clusters 9 and 6 are strongly associated with the GO term clusters 3 (Figures 4c and 4d) related to glycolysis and catabolic processes (Table S2), which explains why these two gene clusters showed a good overlap with the KEGG pathway “Glycolysis/Gluconeogenesis”. On the other hand, the gene cluster 9 is also associated with the GO term cluster 4 related to metabolic processes, which might explain differences between these two gene clusters in the sense of biological processes. Finally, the proposed model identified the gene cluster 5, which does not show significant overlap with any of the known KEGG pathways. This gene cluster consists of 11 genes including TIS11, GIS1, HPS26, RTS3, INO1, INO4, PIR3, FIT2, YAP1, SIN4, and ERG28. While this gene cluster is also associated with the GO term cluster 3 (glycolysis and catabolic processes), it is specifically associated with the GO term cluster 5 related to diverse biological processes such as cell wall organization, homeostasis and localization. Further investigation of this novel gene cluster (i.e., pathway) should be of great interest. These results show the power of the proposed model in identification of novel pathways, pathway-modulating genes, and gene subgroups within each pathway.
Table 2.
Evaluation of gene clustering results for the de novo identification of pathway-modulating genes. The first block of table shows the gene clustering results compared with the KEGG pathway database, based on how many genes in the KEGG pathway “Glycolysis/Gluconeogenesis” (“sce00010”) overlap each gene cluster. The second block of table shows the results after the filtering step (removing genes that were assigned to a cluster less than 90% of MCMC iterations (maxk P (Mi = k|·) ≤ 0.9) from each cluster).
| Gene cluster | 1 | 2 | 3 | 4 | 5 | 6 | 7 | 8 | 9 |
|---|---|---|---|---|---|---|---|---|---|
| (before filtering) | |||||||||
| Glycolysis | 1 | 2 | 4 | 2 | 12 | ||||
| Other pathways | 23 | 9 | 1 | 3 | 17 | 21 | 2 | 8 | 11 |
|
| |||||||||
| (after filtering) | |||||||||
| Glycolysis | 4 | 11 | |||||||
| Other pathways | 4 | 11 | 8 | 7 | |||||
5. Discussion
In this paper, we proposed the unified statistical framework for biomedical literature mining, based on the idea of ontology fingerprint and a Bayesian hierarchical model, with the following desirable properties. First, its pathway-modulating gene identification is not limited to a single aspect of biology because it is based on the biomedical literature mining approach. Second, the proposed method can overcome the limitations of traditional approaches based on co-occurrence of genes in an abstract by identifying indirect relationship among genes using gene ontology information. Third, the proposed model gracefully addresses redundancy in GO terms and correlation among them by modeling clusters of GO terms instead of assuming independence among them. Fourth, the estimated association pattern of GO terms for genes facilitates easy interpretation of novel pathway-modulating genes. Fifth, our Bayesian hierarchical model provides the integrated automatic model selection procedures for gene and GO term clusters using the poor man’s RJMCMC approach. Finally, our Metropolis-Hasting within Gibbs algorithm allows computationally efficient posterior inference. We believe that this proposed framework could provide a rigorous and interpretable statistical framework to improve biomedical literature mining. In addition, its software (R package ‘bayesGO’ that is publicly available at https://dongjunchung.github.io/bayesGO/) will further allow wider application of the proposed model.
There are a number of future directions for our work. First, the proposed model currently assumes that a gene can belong to only a single gene cluster. However, a gene may have multiple functions, and thus may belong to multiple groups/pathways at the same time. Hence, the proposed model can be improved further by allowing overlapping gene membership. Second, the proposed Bayesian hierarchical model can be extended by incorporating other related information. For example, prior knowledge for reported pathways and hierarchical structure of GO terms can be incorporated by modifying prior distributions for gene (Mi) and GO term clusters (Lt). Similarly, the reported assignment of GO terms to genes (such as ones reported in the Gene Ontology Annotation (GOA) database (http://www.ebi.ac.uk/GOA)) can be incorporated as prior distributions for gene-GO term associations (Eti). Third, the proposed model is designed more for well-annotated and nearly completely-sequenced genomes because it utilizes GO terms to identify gene clusters. We believe that this would be practically a reasonable assumption as a large number of genomes (including human, mouse, rat, and yeast, among others) has been well sequenced and annotated. In addition, before we calculated hypergeometric test p-values (Yti), we also extended the dictionary of GO terms significantly by considering its ancestors in the GO tree and using the string match. Specifically, while the original GOA file provides only 16,910 annotation pairs between a GO term and an abstract, our preprocessing (considering ancestors in the GO tree and using the string match) allows to identify 1,074,255 annotation pairs between a GO term and an abstract. As a result, our preprocessing step allows us to overcome this issue to some degree. However, it would still be interesting to modify the proposed model so that it can also investigate under-studied genes, especially those that are still not annotated with GO terms even after this preprocessing step. Fourth, as usually the case for various literature mining and the meta analysis approaches, the findings generated by the proposed model can also be affected by experimental and publication biases. We believe that the proposed model should be relatively weakly affected by these biases because it is based on the p-values generated from hypergeometric tests applied to abstracts rather than the abstracts themselves. However, the data preprocessing steps to generate p-values can still be further improved by taking into account this issue when we apply hypergeometric tests to the abstracts. Fifth, in this paper, we used Metropolis-Hasting within Gibbs sampler for posterior inference. However, from a practical point of view, improved computational efficiency would be beneficial to scale up our proposed method for larger scale biological applications. For example, we can consider to use approximation approaches such as maximum a posteriori (MAP) estimation, e.g., via simulated annealing, along with parallel and GPU computing. Finally, in this paper, we considered yeast data in the real data analysis because yeast is one of the most well-studied model organisms and it is also easy to experimentally validate predicted novel candidate genes using yeast. As the proposed method showed superior performance in the analysis of yeast data, it would be of great interest to utilize the proposed method to analyze more complicated organisms such as human and mouse.
Supplementary Material
Acknowledgments
We thank Sean Courtney and Gary Hardiman for the valuable discussion on biological interpretation of Yeast PubMed data analysis results. This work was supported by the National Institutes of Health (grant numbers R56 LM010680, R01 GM122078 and R21 CA209848).
References
- 1.McGary KL, Lee I, Marcotte EM. Broad network-based predictability of Saccharomyces cerevisiae gene loss-of-function phenotypes. Genome Biology. 2007;8(12):R258. doi: 10.1186/gb-2007-8-12-r258. [DOI] [PMC free article] [PubMed] [Google Scholar]
- 2.Chen J, Bardes EE, Aronow BJ, Jegga AG. ToppGene Suite for gene list enrichment analysis and candidate gene prioritization. Nucleic Acids Research. 2009;37(suppl 2):W305–W311. doi: 10.1093/nar/gkp427. [DOI] [PMC free article] [PubMed] [Google Scholar]
- 3.Jenssen TK, Lægreid A, Komorowski J, Hovig E. A literature network of human genes for high-throughput analysis of gene expression. Nature Genetics. 2001;28(1):21–28. doi: 10.1038/ng0501-21. [DOI] [PubMed] [Google Scholar]
- 4.Fontaine JF, Priller F, Barbosa-Silva A, Andrade-Navarro MA. Genie: literature-based gene prioritization at multi genomic scale. Nucleic Acids Research. 2011;39(suppl 2):W455–W461. doi: 10.1093/nar/gkr246. [DOI] [PMC free article] [PubMed] [Google Scholar]
- 5.Qin T, Matmati N, Tsoi LC, Mohanty BK, Gao N, Tang J, Lawson AB, Hannun YA, Zheng WJ. Finding pathway-modulating genes from a novel Ontology Fingerprint-derived gene network. Nucleic Acids Research. 2014;42(18):e138–e138. doi: 10.1093/nar/gku678. [DOI] [PMC free article] [PubMed] [Google Scholar]
- 6.Efron B. Large-scale inference: Empirical Bayes methods for estimation, testing, and prediction. Vol. 1. Cambridge University Press; 2010. [Google Scholar]
- 7.Ashburner M, Ball CA, Blake JA, Botstein D, Butler H, Cherry JM, Davis AP, Dolinski K, Dwight SS, Eppig JT, et al. Gene ontology: Tool for the unification of biology. Nature Genetics. 2000;25(1):25–29. doi: 10.1038/75556. [DOI] [PMC free article] [PubMed] [Google Scholar]
- 8.Carlin BP, Chib S. Bayesian model choice via Markov chain Monte Carlo methods. Journal of the Royal Statistical Society. Series B (Methodological) 1995;57(3):473–484. [Google Scholar]
- 9.Dellaportas P, Forster JJ, Ntzoufras I. On bayesian model and variable selection using mcmc. Statistics and Computing. 2002;12(1):27–36. [Google Scholar]
- 10.Gelman A, Rubin DB. Inference from iterative simulation using multiple sequences. Statistical Science. 1992;7(4):457–472. [Google Scholar]
- 11.Cheng Y, Church G. Biclstering of expression data; Proceedings of the Eighth International Conference on Intelligent Systems for Molecular Biology (ISMB); 2000. [Google Scholar]
- 12.Lazzeroni L, Owen A. Plaid models for gene expression data. Statistica Sinica. 2002;12(1):61–86. [Google Scholar]
- 13.Kanehisa M, Goto S. KEGG: Kyoto Encyclopedia of Genes and Genomes. Nucleic Acids Research. 2000;28(1):27–30. doi: 10.1093/nar/28.1.27. [DOI] [PMC free article] [PubMed] [Google Scholar]
Associated Data
This section collects any data citations, data availability statements, or supplementary materials included in this article.