Abstract
Lysosomes are the terminal end of the endocytic pathway having acidic environment required for active hydrolases that degrade the cargo delivered to these compartments. This process of cargo delivery and degradation by endo-lysosomes is a tightly regulated process and important for maintaining cellular homeostasis. Cargos like EGF (Epidermal Growth Factor), Dil-LDL (3,3’-Dioctadecylindocarbocyanine-Low Density Lipoprotein), Dextran, DQ-BSA (Dye Quenched-Bovine Serum Albumin) etc., are routinely used by researchers to analyze the role of various proteins in endocytic pathway. Trafficking of DQ-BSA in cells depleted of or over-expressing the gene of interest is a useful assay for identifying the role of various proteins in endocytic trafficking pathway. The protocol describes the DQ-Red BSA trafficking assay that can be used to study endocytic trafficking in various cell types.
Keywords: DQ-BSA, Lysosome, Cargo, Endocytosis, Cell culture, HeLa
Background
Cells are constantly exchanging materials with their extracellular environment and in this process they internalize cargo in vesicles at the plasma membrane. This internalized cargo is delivered to the early endosomes from where it either goes back to the plasma membrane via recycling endosomes or enters the canonical endocytic pathway. Once destined to be degraded, the cargo moves to late endosomes and finally fuses with lysosomes where the active hydrolases digest the cargo ( Jovic et al., 2010 ). These endocytic compartments have characteristic pH of their lumen. The early endosomes have a pH in the range of 5.9-6.8, late-endosomes have pH range of 4.9-6.0, and lysosomes are most acidic with pH ranging from 4.5-5.0 (Maxfield and Yamashiro, 1987). The acidic environment of lysosomes is necessary for the activity of hydrolases present in its lumen and degradation of cargo ( Garg et al., 2011 ; Khatter et al., 2015a and 2015b).
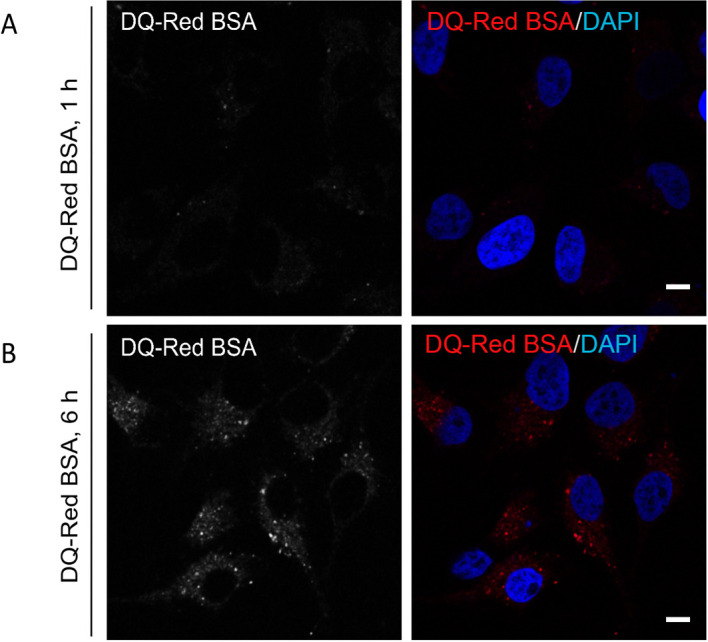
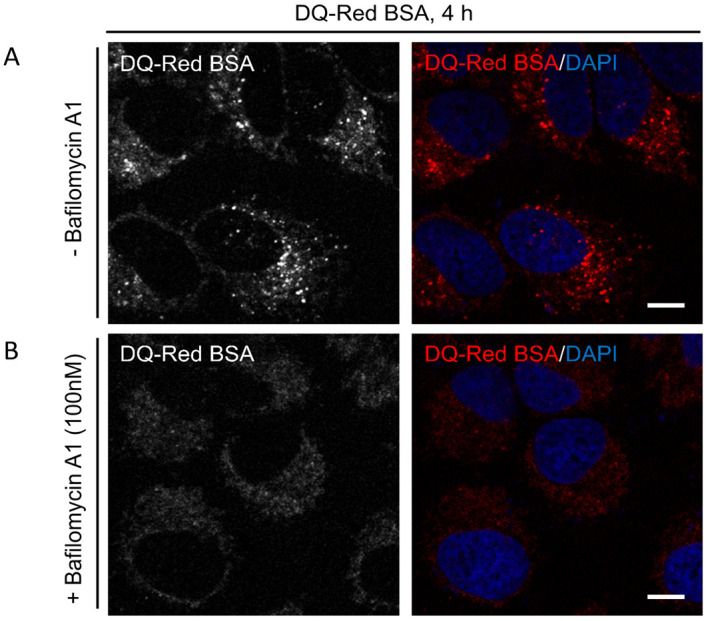
Here we discuss the trafficking assay using DQ-Red BSA as cargo, which is a BSA (bovine serum albumin) derived cargo heavily labeled with BODIPY TR-X dye, resulting in self quenching of the dye. Degradation of DQ-Red BSA in acidic, hydrolase active endo-lysosomes results in smaller protein fragments that have isolated fluorophores, hence de-quenching the dye that can be visualized as a bright fluorescence in cells. The excitation and emission maxima for this dye are ~590 nm and ~620 nm respectively. Trafficking of DQ-Red BSA can be used to study the delivery of cargo to lysosomes ( Pols et al., 2013 ; Marwaha et al., 2017 ; see Figure 1). Under normal conditions, DQ-Red BSA traffics to lysosomes and is cleaved by lysosomal hydrolases, resulting in bright red fluorescent signal (Figure 2). Disruption of cargo delivery to lysosomes such as by depletion of a certain gene product or treatment with chemical inhibitors (such as Bafilomycin A) impairs proteolysis of DQ-Red BSA and thus weak or no fluorescence is observed (see Figure 3).
Figure 1. Schematic representation of DQ-Red BSA cargo uptake and processing in cells.

DQ-Red BSA is endocytosed in cells and traffics through early endosomes to late endosomes which then fuse with acidic hydrolase containing lysosomes. This leads to the formation of endo-lysosomes that degrade DQ-Red BSA, de-quenching the fluorescence of the dye attached to this cargo. DQ-Red BSA is heavily labeled with fluorescent dyes that lead to quenching of their fluorescence (shown by pink fluorophores attached to the cargo). Once DQ-Red BSA has reached the degradative endo-lysosomes, the cargo is broken down into smaller fragments which lead to the de-quenching of the fluorophores (shown as bright red spots in endo-lysosomes).
Figure 2. De-quenching of DQ-Red BSA fluorescence at different time points post endocytosis.

Representative single-plane confocal micrographs of HeLa cells showing fluorescence (red signal) of DQ-Red BSA after an uptake of 1 h (A) and 6 h (B) time points. At the end of the uptake time point, cells were fixed and stained with DAPI (blue) to mark the cell nucleus. A bright fluorescence punctae of DQ-Red BSA is visible post 6 h uptake as compared to 1 h, indicating its delivery to acidic compartments of the cell. Scale bars = 10 µm.
Figure 3. DQ-BSA uptake and delivery to lysosomes.

Representative single-plane confocal micrographs of HeLa cells incubated with DQ-Red BSA in 1% serum containing media for indicated time point in the absence (A) or presence (B) of 100 nM Bafilomycin A1, a V-ATPase inhibitor that disrupts lysosome fusion. The cell nucleus is stained using DAPI (blue). Scale bars = 10 µm.
Materials and Reagents
Coverglass slips (VWR, catalog number: 89015-725)
BD Falcon15 ml centrifuge tubes (Corning, Falcon®, catalog number: 352096)
BD Falcon 35 mm cell culture dish (Corning, Falcon®, catalog number: 353001)
24-well plate (Corning, Falcon®, catalog number: 353226)
Glass slide (HiMedia Laboratories, catalog number: CG029)
HeLa cells (ATCC, catalog number: CCL-2)
siRNA (Dharmacon)
Xtremegene HD transfection reagent (Roche)
DMEM (Lonza, catalog number: 12-604F)
NEAA (Thermo Fisher Scientific, GibcoTM, catalog number: 11140050)
GlutaMax (Thermo Fisher Scientific, GibcoTM, catalog number: 35050061)
HEPES (Thermo Fisher Scientific, GibcoTM, catalog number: 15630080)
DQ-Red BSA (Thermo Fisher Scientific, InvitrogenTM, catalog number: D12051)
DAPI (Thermo Fisher Scientific, InvitrogenTM, catalog number: D1306)
HI FBS (Thermo Fisher Scientific, GibcoTM, catalog number: 10082147)
1x DPBS (Lonza, catalog number: 17-512F)
16% paraformaldehyde (PFA) (Electron Microscopy Sciences, catalog number: 15700)
Fluoromount G (Southern Biotech, catalog number: 0100-01)
Stock solution of DQ-Red BSA (see Recipes)
DAPI stock solution (see Recipes)
Equipment
CO2 incubator (Eppendorf, New BrunswickTM, model: Galaxy® 170 R)
Confocal microscope (ZEISS, model: LSM 710)
Software
ImageJ software (NIH)
Procedure
-
Trafficking–DQ-Red BSA in HeLa cells
Note: This protocol provides general guidelines and a procedure to perform trafficking assay using DQ-Red BSA as a cargo in HeLa cells. For other cell types, check which culture media and culture supplements the cell line you are using requires before starting cultures.The suggested cell number, concentration of DQ-BSA to be used, and transfection conditions are provided as a starting point. We recommend users to optimize these conditions based on the cell types they are using for the assay in order to obtain best results.
-
Cells are seeded on coverglass slips according to the experiment to be performed, for example siRNA transfection or plasmid transfection for over-expression studies.
Note: For RNAi studies, seed 60,000 HeLa cells in a 35 mm cell culture dish containing 4 glass coverslips. After a period of 16 h, transfer individual glass coverslips to 24-well cell culture plate and siRNA treatment is performed as described in the next step. For overexpression related experiments, seed 0.18 million HeLa cells in a 35 mm cell culture dish containing 4 glass coverslips, and post 16 h of cell seeding, transfections is carried out as described below. The users are recommended to optimize the cell seeding density based on the cell type and their growth rates. In general, for RNAi studies that go upto 48-72 h, the starting cell density should be kept around 15-20%. For overexpression studies, the confluency of the cells should be around 40% at the day of transfection.
Perform the gene silencing or overexpression of exogenous plasmids in cells. siRNA is transfected using Dharmafect (GE) reagent according to the manufacturer’s protocol and plasmid DNA transfection is carried out using XtremegeneHD (Roche).
-
Proceed with the assay once effective gene silencing is achieved upon siRNA treatment or expression of an exogenous gene is observed upon transfection of plasmid in case of over-expression studies.
Note: For RNAi studies using Dharmafect (GE) reagents, > 80% silencing of an endogenous gene can be achieved within 48 h after siRNA transfection into HeLa cells. Similarly, expression of exogenous plasmid can be achieved within 16 h post-transfection using Xtremegene HD transfection reagent (Roche) in HeLa cells. However, users are recommended to determine the optimal conditions (siRNA concentration, period of siRNA treatment, transfection reagent, concentration of plasmid etc.) in order to achieve effective silencing of gene of interest or expression of transfected gene for their cell line of choice. Once these parameters are optimized, proceed with the trafficking assay post transfection.
-
Prepare the media for trafficking in a BD Falcon 15 ml centrifuge tube as follows:
Trafficking media: DMEM + 1% serum + 1% NEAA + 1% GlutaMax + 1% HEPES
Note: 300 µl for one well of a 24-well plate is sufficient to submerge the cells. Increase the volume of media required according to the dish size.
Warm the media at 37 °C.
DQ-BSA preparation: stock concentration–2 mg/ml; working concentration–10 µg/ml.
-
Calculate the amount of DQ-Red BSA required and add to trafficking media pre-warmed at 37 °C. Keep this mix at 37 °C for another 5 min.
Note: Always make sure to spin the stock DQ-Red BSA (see Recipes) tube prior to making the ligand-trafficking media mix i.e., DQ-Red BSA mixed with trafficking media. This will ensure settling down of any DQ-BSA aggregates that may interfere with the trafficking assay and analysis of results.
Wash the cells seeded on coverslips once with pre-warmed 1x DPBS.
Add the ligand-trafficking media mix to cells and incubate at 37 °C in a 5% CO2 humidified cell culture chamber for 1 h and 6 h, respectively.
After the desired time points, fix cells with 4% PFA prepared in 1x DPBS for 10 min at room temperature.
To mark the nucleus, DAPI staining can be performed. Make DAPI stock solution of 1 mg/ml in sterile water, and use 1:1,000 dilution for staining the cells. Incubate coverslips with DAPI containing solution for 20 min followed by three washes with 1x DPBS and mount the coverslips on a glass slide using Fluoromount G.
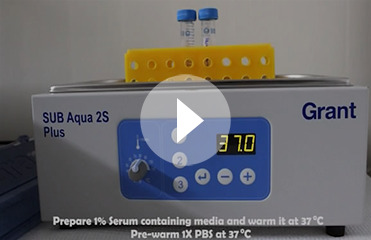
For more information, readers are encouraged to see Video 1.
-
-
Imaging, quantification and data analysis
The cells are imaged on a single plane using confocal microscope (LSM 710, ZEISS).
Analysis the image using ImageJ software (NIH).
-
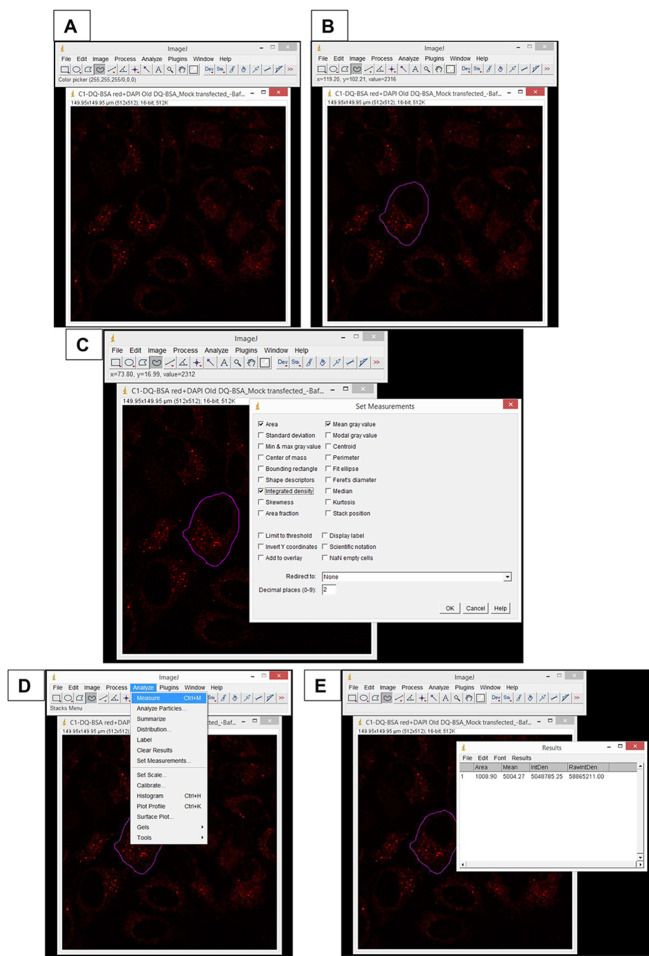
Quantify the Corrected Total Cell Fluorescence (CTCF) as described:
Open the desired confocal image (.lsm file format) in ImageJ software.
Split channels and keep the window of desired channel open.
Select the cell by making an outline using ‘freehand selection’ tool.
Go to ‘Analyze’ → ‘Set measurements’ → ‘Select area, integrated density and mean gray value’.
Go to ‘Analyze’ again → Click on ‘Measure’.
A result window opens from where the values are copied to an Excel sheet.
For measuring the background intensity of the image, select 5 random areas in the image that do not have cells and repeat the above mentioned steps.
CTCF = Average Integrated intensity - (Average area x Average mean of background).
Calculate the CTCF for each cell and plot the mean value. For more information, readers are encouraged to see Figure 4.
-
For analyzing the number of DQ-Red BSA puncta in cells, use ‘Analyze Particle’ tool of ImageJ software and perform the quantification as described below:
Open the desired confocal image in ImageJ software.
Split channels of the image and select the channel of your interest. Close rest of the channels.
If there are multiple cells in an image, then crop out the cell of interest in the selected channel.
Duplicate the image (Shortcut–Ctrl + Shift + D).
Select any one of the two duplicate images and follow the steps written below.
Go to ‘Image’ → ‘Adjust’ → ‘Threshold’ → select for the Algorithm from the drop box and see which one highlight the punctate structures best in your image or set the threshold ‘manually’ → ‘Apply’.
Go to ‘Analyze’ → ‘Set measurements’ → select ‘Mean gray value, Area and Limit to threshold’.
In the same window, redirect to–select the image other than that was selected in step 4e → Press ‘OK’.
Go to ‘Analyze’ → ‘Analyze Particles’ → select ‘Display results and summarize’ → press ‘OK’.
Two result windows will open. One will have the data from every individual particle whereas the other one will be the summary having the average of the values from all the particles in the cell analyzed. Copy the data to an Excel sheet and analyze.
The result summary file shows the total count of particles analyzed, which is the number of DQ-Red BSA punctae in a cell. For more information, readers are encouraged to see Figure 5.
Video 1. Demonstration of how to perform DQ-Red BSA trafficking assay.

The video describes the steps of DQ-Red BSA trafficking assay including preparation of cargo containing media, important precautions to be taken and the method of performing the experiment.
Figure 4. Screenshots of important steps of CTCF analysis using ImageJ.
Figure 5. Screenshots of important steps of particle count analysis using ImageJ.
Data analysis
For calculating the ‘Corrected Total Cell Fluorescence (CTCF)’ and analyzing the ‘number of DQ-Red BSA punctae’, readers are encouraged to see Figures 4 and 5, respectively. For more information, please see ‘Marwaha, R., Arya, S. B., Jagga, D., Kaur, H., Tuli, A. and Sharma, M. (2017). The Rab7 effector PLEKHM1 binds Arl8b to promote cargo traffic to lysosomes. J Cell Biol 216(4): 1051-1070’.
Recipes
-
Stock solution of DQ-Red BSA
DQ-Red BSA is provided as 1 mg lyophilized powder
To make a stock of 2 mg/ml of DQ-Red BSA, dissolve in 500 µl 1x DPBS
Mix thoroughly by vortexing and pipetting
Store at 4 °C after reconstitution
Protect from light by covering the vial with an aluminum foil
-
DAPI stock solution
1 mg/ml in sterile water
Note: Use stock solution at a 1:1,000 dilution for staining cells
Acknowledgments
This protocol was adapted and modified from a previously published study ( Pols et al., 2013 ). The authors would like to thank Imran Sayeed (third year BS-MS student at IISER Mohali) for his contribution in preparing the video. R. Marwaha acknowledges financial support from the Indian Institute of Science Education and Research Mohali (IISER Mohali). M. Sharma acknowledges financial support from the Wellcome Trust/Department of Biotechnology (DBT). This work was supported by the Wellcome Trust/DBT India Alliance Intermediate Fellowship awarded to M. Sharma (IA/I/12/1/500523). M. Sharma also acknowledges the infrastructure and financial support from IISER Mohali. The authors declare no competing financial interests.
Citation
Readers should cite both the Bio-protocol article and the original research article where this protocol was used.
References
- 1.Garg S., Sharma M., Ung C., Tuli A., Barral D. C., Hava D. L., Veerapen N., Besra G. S., Hacohen N. and Brenner M. B.(2011). Lysosomal trafficking, antigen presentation, and microbial killing are controlled by the Arf-like GTPase Arl8b. Immunity 35(2): 182-193. [DOI] [PMC free article] [PubMed] [Google Scholar]
- 2.Jovic M., Sharma M., Rahajeng J. and Caplan S.(2010). The early endosome: a busy sorting station for proteins at the crossroads. Histol Histopathol 25(1): 99-112. [DOI] [PMC free article] [PubMed] [Google Scholar]
- 3.Khatter D., Raina V. B., Dwivedi D., Sindhwani A., Bahl S. and Sharma M.(2015). The small GTPase Arl8b regulates assembly of the mammalian HOPS complex on lysosomes. J Cell Sci 128(9): 1746-1761. [DOI] [PMC free article] [PubMed] [Google Scholar]
- 4.Khatter D., Sindhwani A. and Sharma M.(2015). Arf-like GTPase Arl8: Moving from the periphery to the center of lysosomal biology. Cell Logist 5(3): e1086501. [DOI] [PMC free article] [PubMed] [Google Scholar]
- 5.Marwaha R., Arya S. B., Jagga D., Kaur H., Tuli A. and Sharma M.(2017). The Rab7 effector PLEKHM1 binds Arl8b to promote cargo traffic to lysosomes. J Cell Biol 216(4): 1051-1070. [DOI] [PMC free article] [PubMed] [Google Scholar]
- 6.Maxfield F. R. and Yamashiro D.J.(1987). Endosome acidification and the pathways of receptor-mediated endocytosis. Adv Exp Med Biol 225:189-98. [DOI] [PubMed] [Google Scholar]
- 7.Pols M. S., C. ten Brink, Gosavi P., Oorschot V. and Klumperman J.(2013). The HOPS proteins hVps41 and hVps39 are required for homotypic and heterotypic late endosome fusion. Traffic 14(2): 219-232. [DOI] [PubMed] [Google Scholar]


