

Abstract
Retinal regeneration and self-repair, whether in response to injury or degenerative disease, are severely impeded by glial scar formation by Müller cells (specialized retinal macroglia). We have previously demonstrated that the activation of Müller cells and gliosis in the degenerative retina are significantly suppressed by the subretinal transplantation of a mixture of olfactory ensheathing cells (OECs) and olfactory nerve fibroblasts. However, the underlying molecular mechanism has remained elusive. Here we transplanted purified rat OECs into the subretinal space of pigmented Royal College of Surgeons (RCS) rats, a classic rodent model of retinal degeneration. Using behavioral testing and electroretinography, we confirmed that the grafted OECs preserved the visual function of rats for 8 weeks, relative to vehicle controls (phosphate-buffered saline). Histological evaluation of outer nuclear layer thickness and composition demonstrated that more photoreceptors and ON-bipolar cells were preserved in the retinas of OEC-treated RCS rats than in controls. The grafted OECs migrated into the outer plexiform layer, inner nuclear layer, and inner plexiform layer. They interacted directly with Müller cells in the retina of RCS rats, in three distinct patterns, and secreted matrix metalloproteinases 2 and 3. Previous studies have demonstrated that rat OECs express delta-like ligand (DLL), while Müller cells express Notch3, the receptor for DLL. Here we found that the grafted OECs significantly decreased the expression, by retinal cells, of Notch signaling pathway components (including Notch3, Notch4, DLL1, DLL4, Jagged1, Hes1, and Hes5) 2 weeks after the cell transplantation and that this effect persisted for a further 2 weeks. Based on these findings, we suggest that transplanted OECs inhibit the activation of Müller cells and the associated gliosis, at least partly through suppression of the Notch pathway.
Keywords: Retinitis pigmentosa, Olfactory ensheathing cells (OECs), Müller cells, Matrix metalloproteinase 2/3, Notch pathway
Introduction
Müller cell activation and proliferation are involved in many retinal disorders. The overactivation of Müller cells often leads to glial scar formation in the subretinal space1. This can compromise the blood–retinal barrier and disrupt the retinal vasculature, resulting in poor blood perfusion in the choroidal capillaries and low oxygen pressure within the tissues, and eventually apoptosis of rod/cones2,3. The pigmented Royal College of Surgeons (RCS) rat strain, a genetic mutation in the Mer protooncogene, tyrosine kinase (MerTK) gene, the human analog of which is associated with autosomal recessive retinitis pigmentosa, is a widely used animal model of inherited retinal degeneration2–4. Morphological changes in the photoreceptor outer segments of RCS rats appear as early as postnatal day 16 (P16), and the apoptosis of photoreceptor cells peaks at P30, when the glial scar forms as a result of Müller cell overactivation1.
Olfactory ensheathing cells (OECs) are a unique type of macroglial cell, which exhibit the characteristics of both astrocytes and Schwann cells, and are required for the continuous growth of new axons in the central nervous system (CNS) tissues of the adult mammalian olfactory system5. In addition, OECs have the capacity to modify the characteristics of the constituent cells of a glial scar and promote the regeneration of CNS axons6–9. Thus, OEC grafts have previously been used to repair the damaged CNS10–13. A previous study by our group showed that a mixture of OECs and olfactory nerve fibroblasts (ONFs) injected into the subretinal space of RCS rats survived for at least 8 weeks. Moreover, the OECs migrated into the space surrounding the injection point and suppressed the gliotic injury response of Müller cells14. However, the molecular mechanisms that underlie the migration of OECs, their interactions with glial scar tissue, and the associated improvement in visual function remain poorly understood.
Numerous studies have highlighted the sustained expression of matrix metalloproteinases (MMPs) during certain phases of tissue repair, and their contribution to cell migration, neurogenesis, axonal growth, and guidance into damaged tissue during tissue repair15–17. Some reports have demonstrated that OECs can express extracellular matrix (ECM) molecules, like laminin, collagen type IV, and fibronectin, which are all known to act as growth-promoting substrates for olfactory axonal growth18–20.
“Notch” signaling is a highly conserved pathway, which regulates the cell-to-cell interactions required for cell fate determination and can lead to the promotion of gliogenesis21–23. Ligand binding at the Notch receptor leads to the release of the Notch intracellular domain (NICD), which in turn leads to the increased expression of Hes genes and glial fibrillary acidic protein (GFAP)24,25. In the CNS, Notch is sufficient to direct nonastrocytic progenitors toward an astrocytic fate26. In addition, Notch signaling in astrocytes induces certain characteristic elements necessary for reactive gliosis. Astrocytes deficient in GFAP and vimentin may have less Notch signal pathway competence27–29. Retinal development closely parallels that of the rest of the CNS. Müller cell development is tightly controlled by Notch signaling and is dependent on the action of Hes526.
The aims of this study were to measure the secretion of MMP-2 and MMP-3 by purified OECs, which were transplanted into a degenerative retina, and to evaluate the involvement of these metalloproteinases in the migration of OECs and their interaction between OECs and Müller cells in the degenerative retina. Our results demonstrated that Notch signaling is involved in Müller cell gliosis, and downregulation of this pathway was likely to be an underlying mechanism of the visual function improvement after OEC transplantation in a rodent model of retinal degeneration.
Materials and Methods
OEC Culture and Purification
All animals were housed according to the Third Military Medical University (TMMU) guidelines. All surgical procedures and postoperative care were conducted in accordance with protocols approved by the TMMU Institutional Animal Care and Use Committee (IACUC). OECs were harvested from adult male RCS-rdy+ rats (weighing 250 g; a congenic strain of RCS rats), which carry the normal MerTK gene, and transplanted into the subretinal space of RCS rats (both RCS rats and RCS-rdy+ rats were gifts from Beckman Vision Center, University of California, San Francisco School of Medicine, San Francisco, CA, USA). Primary cultures of OECs were prepared from the olfactory bulbs of these rats and purified by differential cell adhesiveness as described previously30. Animals were anesthetized by intramuscular injection of pentobarbital sodium (10 mg/kg; Sigma-Aldrich, St. Louis, MO, USA). Olfactory bulbs were dissected and put into a 35-mm dish. After removal of the pia, the olfactory nerve fibers and glomerular layers were removed. The bulb was then cut into 1 × 1 × 1-mm3 segments and incubated with 0.1% trypsin (Gibco, Grand Island, NY, USA) for 15 min at 37°C. Trypsinization was stopped by the addition of Dulbecco's modified Eagle's medium (DMEM; Invitrogen, Carlsbad, CA, USA) containing 10% fetal bovine serum (FBS; Gibco) and 1% penicillin/streptomycin (PS; Gibco). The cells were cultured with DMEM/F-12 (1:1 mixture; HyClone; GE Healthcare Life Sciences, Issaquah, WA, USA) containing 10% FBS and 1% PS and plated onto 35-mm dishes coated with poly-L-lysine. Cells were cultured for 5 days, and then the culture medium was changed every 2 days for 2 weeks. When cells reached confluence, they were trypsinized and used for immunocytochemistry and subretinal transplantation. Lentiviruses carrying the enhanced green fluorescent protein (LV-GFP; GeneChem, Shanghai, P.R. China) were used to label the OECs prior to transplantation. The production and purification of LV-GFP were according to previous reports31. In brief, cells were cultured for 8 days in a six-well plate, and when they reached a density of 104–105 cells per well they were infected with LV-GFP that had been diluted for 24 h in cell type-specific medium.
Primary Müller Cell Culture
Briefly, RCS-rdy+ rats aged P8–P10 were enucleated, and the eyeballs (globes) were incubated for 6–8 h in DMEM. Eyeballs were transferred to a dissociation solution [DMEM containing 0.1% trypsin, 0.02% ethylenediaminetetraacetic acid (EDTA; Gibco, and 70 U/ml collagenase (Sigma-Aldrich)] and incubated at 37°C in a CO2 incubator for 1 h. Eyeballs were then washed with DMEM containing 10% FBS and 1% PS. The retina was dissected with care to avoid contamination of the retinal pigment epithelium (RPE) and ciliary epithelium. The retina was mechanically dissociated into small aggregates and cultured in DMEM containing 10% FBS. After culture for 7 days, the floating retinal aggregates and debris were removed. The attached Müller cells were trypsinized and cultured in DMEM containing 10% FBS for an additional 5 days. Once cells reached confluence, they were trypsinized for purification and immunocytochemistry32.
Subretinal Transplantation
As per our previous studies14,33,34, after culture for 14 days OECs were detached using 0.25% trypsin and 0.02% EDTA, centrifuged, and washed with DMEM containing 10% FBS. OECs were then transplanted into the subretinal space of P30 RCS rats. To do this, the superior temporal part of the sclera was exposed, the subretinal space was reached with a 30-gauge needle, and an incision of the sclera, choroid, and RPE of the eye was made at a position 2 mm from the limbus. Three microliters of cells suspended in phosphate-buffered saline (PBS), containing approximately 1 × 10⁵ cells, was slowly injected into the subretinal space using a 10-μl glass micropipette14. The contralateral eye was used as a control and treated with the same surgical procedures but with subretinal injection of the same volume of PBS rather than suspended OECs. Postsurgical fundus examination showed that all rats had ideal bleb detachment of the retina at the injection site.
Electroretinography (ERG)
ERG recordings were performed as previously described33. Briefly, animals were dark adapted overnight and prepared for recording under dim red light. Pupils were dilated with compound tropicamide eye drops. A drop of carboxymethylcellulose sodium lubricant was applied on the corneas before recording to prevent dehydration and allow electrical contact with the recording electrode. Subcutaneous needle electrodes in the scalp and tail served as the reference and ground electrode, respectively. The signals were amplified and filtered with a 0.1- to 300-Hz bandpass filter without notch filtering. Data were acquired, and stimulus delivery was controlled by the RETI-port software, running on Roland Electrophysiological Systems hardware (Brandenburg, Germany). We tested a cohort of eight rats prior to the transplantation procedure (time zero), and further cohorts at weekly intervals, up to 8 weeks postprocedure. The number of rats undergoing ERG at weeks 0 to 8 (relative to the transplantation) was 8, 8, 8, 8, 8, 6, 6, 3, and 3, respectively. In each animal, one eye was assigned to an active intervention group and one to a control group. The active intervention group received a 3-μl subretinal transplantation of OECs suspended in PBS (OEC group), and the control (sham-operated, vehicle control) group received a 3-μl subretinal injection of PBS only (PBS group). To quantify dark-adapted b-waves, recordings were made of the responses to presentations of a single flash stimulus (duration <5 ms), which was repeated three times to verify the response reliability. To improve the signal-to-noise ratio, the interstimuli intervals were longer than 30 s.
Behavioral Testing
Vision was quantified using a “virtual optomotor system,” as described previously for mice35. Briefly, animals were placed on a platform in the center of a square surrounded by four computer monitors. Each rat (n = 8) was placed on the platform in a quiet environment before the test until it became accustomed to the test conditions, and then tracked the rotation of a virtual cylindrical grating displayed on the monitors using reflexive head movements. The acuity threshold was quantified by increasing the spatial frequency of the grating, using a psychophysics staircase progression, until the tracking response was lost.
Immunocytochemistry
Cells were plated on poly-L-lysine precoated coverslips and fixed in 4% paraformaldehyde (PFA) for 10 min. After washing with 0.01 M PBS, cells were permeabilized with 0.5% Triton X-100 (Amresco, Solon, OH, USA) for 5 min and incubated with 1% goat serum (Zhongshan Jinqiao, Beijing, P.R. China) in PBS at room temperature for 1 h. Cells were then incubated with primary antibodies (Table 1) overnight at 4°C. After the primary antibody was washed off with PBS, donkey anti-goat fluorescein isothiocyanate (FITC; 1:200; Wuhan Boster Biological Technology, Wuhan, P.R. China), goat anti-rabbit cyanine 3 (Cy3; 1:500; Wuhan Boster Biological Technology), or goat anti-mouse FITC (1:200; Wuhan Boster Biological Technology) secondary antibodies were applied for 1 h at room temperature in the dark. Nuclei were counterstained with 4′,6-diamidino-2-phenylindole (DAPI) (Beyotime, Shanghai, P.R. China) for 10 min in the dark. Coverslips were then washed in PBS, rinsed in distilled water, and mounted using antifade mounting medium (Beyotime). Specimens were viewed under a fluorescence microscope (Olympus DP71; Olympus, Tokyo, Japan). Images were captured with an Optronics Magnafire camera (Optronics, Goleta, CA, USA). Confocal microscopy was performed at the Central Laboratory in TMMU using a Leica confocal microscope (Leica Microsystems, Wetzlar, Germany).
Table 1.
Primary Antibodies Used in Immunocytochemistry
| Antibody | Manufacturers, Species Antibody Was Raised in, Mono- Versus Polyclonal, Catalog, or Lot Number | Dilution Used |
|---|---|---|
| NGFRp75 | Santa Cruz, rabbit polyclonal sc-6188, CA, USA | 1:50 |
| MMP-2 | Santa Cruz, rabbit polyclonal sc-10736 | 1:50 |
| MMP-3 | Bioss, rabbit polyclonal bs-0413R, CHN | 1:200 |
| DLL1 | Abcam, rabbit polyclonal ab10554, UK | 1:200 |
| DLL4 | Santa Cruz, rabbit polyclonal sc-28915 | 1:50 |
| Notch3 | Sigma-Aldrich, rabbit polyclonal N5038, MO, USA | 1:300 |
| CRALBP | Santa Cruz, mouse monoclonal sc-59487 | 1:50 |
| Delta | Santa Cruz, goat polyclonal C-20 | 1:50 |
| PKCα | Novus biological, mouse monoclonal NB600––201, CO, USA | 1:500 |
| GFAP | Abcam, rabbit polyclonal ab7260 | 1:500 |
| β-Actin | Cell Signal Technology, mouse monoclonal, Danvers, MA, USA | 1:2,000 |
| S-100β | Abcam, rabbit monoclonal ab-52642 | 1:500 |
Immunohistochemistry
At 1, 2, 4, and 8 weeks after OEC/sham transplantation, the rats were anesthetized with intraperitoneal (IP) pentobarbital sodium and transcardially perfused with 4% PFA in normal saline. After the globes (eyeballs) were removed, a cut was made at approximately 2 mm from the corneoscleral junction. The lens and vitreous were removed, and the eyecups were immersed in 4% PFA (pH 7.4) at 4°C for 1 h, then transferred to 30% sucrose, and stored at 4°C overnight. Sections (10 μm thick) were cut using a cryostat (Leica Microsystems) at −20°C. The sections were numbered in order, air dried overnight at room temperature, and stored at −20°C. The sections were washed with 0.1 M PBS, permeabilized with 0.5% Triton X-100 for 5 min, and blocked with 1% goat serum in PBS at room temperature for 1 h. Primary antibodies were incubated overnight at 4°C. Primary antibodies and their dilutions are listed in Table 1. After the primary antibody was washed off with PBS, goat anti-mouse Cy3 secondary antibodies (1:500) were applied for 1 h at room temperature in the dark. Nuclei were counterstained with DAPI in the dark. Sections were washed in PBS, rinsed in distilled water, and mounted using antifade mounting medium (Beyotime). The sections were photographed under the fluorescence microscope, and the thickness of the ONL was measured using the ImageJ software [National Institutes of Health (NIH), Bethesda, MD, USA].
Preparation of Concentrated OEC Medium
DMEM/F-12 containing 10% FBS and 1% PS was used as a basal culture medium. To prepare the conditioned medium, derived from the purified OEC culture, the supernatants of purified OECs (cultured for 5, 8, 11, and 14 days) were collected and concentrated 20-fold using an AmiconUltrafree-4 centrifugal filter (EMD Millipore, Billerica, MA, USA) with a nominal molecular weight limit of 30 kDa. Both the conditioned medium and basal culture medium were stored at −80°C for later use.
Measurement of MMP-2/MMP-3 Levels by ELISA
At time points 1 to 4 weeks after transplantation, the retinas from the OEC group, PBS group, and blank group (this group did not receive any surgery, provided baseline concentration of MMP-2/MMP-3 in the retina of RCS rats; n = 3 at each time point) were isolated and rinsed in 0.01 M PBS, drained, and lysed in ice-cold lysis buffer (20 mM PBS, 320 mM sucrose, 1 mM EDTA, 0.2% Tween 20; Sigma-Aldrich). The lysates were centrifuged at 12,000 × g for 5 min at 4°C. Protein content was determined using the bicinchoninic acid (BCA) protein assay (Beyotime) according to the manufacturer's protocol. The concentrations of MMP-2 and MMP-3 were measured using the mouse MMP-2/MMP-3 enzyme-linked immunosorbent assay (ELISA) kit (Wuhan Boster Biological Technology) according to the manufacturer's instructions. The reaction was quenched by the addition of 1 M sulfuric acid (H2SO4). The absorbance of each sample was measured using a plate reader at a wavelength of 450 nm.
Migration Assay and Analysis
The assay was performed using 8-μm-pore 24-well Transwell® plates (Millipore)36. OEC migration experiments were repeated three times per group. There were three experimental groups: (1) Müller cells + OECs, (2) ONFs + OECs, and (c) Müller cells + OECs + 10 μm tissue inhibitor of metalloproteinase 2 (TIMP-2; Sigma-Aldrich)37. ONFs were obtained when we used differential time attach ment to purify the primary cultured OECs. Both ONFs and Müller cells were plated onto 24-well dishes at a density of 5 × 10³ cells/cm2. Purified OECs were added to the top of the Transwell insert in DMEM/F-12 medium with 10% FBS (2,500 cells/300 ül) and cocultured with Müller cells in a 37°C incubator with 5% CO2. In group 3, 10 μm TIMP-2 was also added into the Transwell insert. After a 24-h incubation period, cells remaining on the upper surface of the chamber were cleaned away using a cotton swab. The migrated cells were fixed with methanol, stained with gentian violet (Sigma-Aldrich), and then directly counted under a microscope in three fields (magnification: 100×).
RNA Extraction and Real-Time Polymerase Chain Reaction (RT-PCR)
Retinal RNA Extraction. At 1, 2, 3, and 4 weeks after OEC transplantation, total RNA was isolated from retinas after using the TRIzol® reagent (Invitrogen) according to the manufacturer's protocol.
Cell RNA Extraction. Müller cells were primary cultured. The complete pancreatic enzyme digestion method was used to passage and purify Müller cells38. RNA was extracted from primary cultured Müller cells (P0) and purified Müller cells of passage 1 (P1) and P3. Total RNA was also isolated from cells after using the TRIzol® reagent (Invitrogen) according to the manufacturer's protocol.
Total RNA was purified using the TURBO DNA-free™ Kit (Applied Biosystems, Foster City, CA, USA). Total RNA (1 μg) was reverse transcribed into complementary DNA using the iScript™ Select cDNA Synthesis Kit (Bio-Rad, Hercules, CA, USA). The primers used in this study are shown in Table 2. RT-PCR was carried out using the iQ™ SYBR® Green PCR Kit (Bio-Rad) on an Applied Biosystems 7500 RT-PCR machine. The RT-PCR protocol used was as follows: 94°C for 5 min; 45 cycles of 94°C for 30 s, 59°C for 30 s, and 72°C for 30 s; and 72°C for 10 min. The experiments were repeated at least three times. Glyceraldehyde 3-phosphate dehydrogenase (GAPDH) was used as an internal control, and the cycle threshold (Ct) values of tested genes were normalized to GAPDH. The relative expression was determined using the 2-ΔΔCt method and represented as a percentage change from baseline.
Table 2.
Designing RT-PCR Primers
| Genes (Rat) | Forward Primer | Reverse Primer |
|---|---|---|
| GAPDH | AGAGAAGCTGTGCTATGTTGCCCT | ACCGCTCATTGCCGATAGTGATGA |
| Notch1 | AGTAGCTCCTAAGAGCACAACCCA | TATAGCGCAGACACTGCTTCCCAA |
| Notch2 | TCGCTGTGAGATGGACATCAACGA | TGCCCATTGTTTACACACGGGTTG |
| Notch3 | TGCTCGGGATGTGGATGAATGTCT | ACAGGTCCCTCCATTGAAACAGGA |
| Notch4 | AGGCAACTTCGTGGAAGGAAGGAA | AATCCGGGCATCCTAAACCCTCTT |
| DLL1 | AAGAGAAGAGCACCTCAACGCTCA | ACCGACTGGTACTTGGTGTCCTTT |
| DLL4 | ACAGTACCTTGACCTGTGCGGATT | TCTGTTCAGGCACTGACCTCCATT |
| Jagged1 | AAATACACGTGGCCATTTCTGCCG | AGCTCAGCAGAGGAACCAGGAAAT |
| Jagged2 | TGGGACAATGACACCACACCAGAT | TGTTGCAGGTGGCACTGTAGTAGT |
| Hes1 | CAACACGACACCGGACAAACCAAA | TGGAATGCCGGGAGCTATCTTTCT |
| Hes5 | TACCTGAAGCACAGCAAAGCCTTC | TAAAGCAGCTTCATCTGCGTGTCG |
| CRALBP | CTGAGTTTGGAGGAATCTTGC | TGGATTTGGGGGAGAGTTC |
GADPH, glyceraldehyde 3-phosphate dehydrogenase; DLL, delta-like ligand; Hes1/5, hairy and enhancer of split-1/5; CRALBP, cellular retinaldehyde-binding protein.
Western Blot
The retinas of 12 rats (n = 3 for both the OEC and PBS group, at both 2 and 4 weeks posttransplant procedure) were isolated and rinsed in 0.01 M PBS, drained, and lysed in ice-cold tissue lysis buffer [10% phenylmethane sulfonyl fluoride (PMSF) + 90% radioimmuno-precipitation assay (RIPA) buffer; Beyotime]. The protein samples were mixed with 5× sodium dodecyl sulfate (SDS) sample buffer (Beyotime) and then subjected to SDS-polyacrylamide gel electrophoresis (SDS-PAGE; Beyotime). After electroblotting onto the polyvinylidene fluoride (PVDF; Bio-Rad) membranes, the membranes were blocked in 5% nonfat milk and incubated with different primary antibodies at 4°C overnight (Table 1). The following day, the membranes were washed three times with 1× PBS containing 0.1% Tween 20 (PBST) for three times, then incubated with horseradish peroxidase-conjugated sheep anti-mouse (1:3,000; Santa Cruz Biotechnology, Dallas, TX, USA) or sheep anti-rabbit immunoglobulin G (1:3,000; Santa Cruz Biotechnology) as secondary antibodies for 1 h at room temperature. The bands on the membranes were visualized using chemiluminescence detection reagents (Sigma-Aldrich) after washing three times with 1× PBST Densitometric analysis was performed using ImageJ software. β-Actin was used as a loading control.
Statistical Analysis
All data were expressed as mean±standard deviation (SD). Analyses were performed using SPSS 10.0 (IBM, Armonk, NY, USA). Two-way analysis of variance (ANOVA) was used to compare differences between groups followed by Tukey's post hoc test. Values of p < 0.05 were considered statistically significant.
Results
OEC Transplantation Led to Relative Preservation of Visual Function and Number of Photoreceptors and Metabotropic Bipolar (ON-Bipolar) Cells in the Retina
To study whether OEC transplantation preserved retinal function in RCS rats, scotopic ERGs were tested weekly for 8 weeks after surgery (Fig. 1). In the PBS group, the b-wave amplitude dramatically decreased from 2 weeks after the transplantation, consistent with the progressive degeneration of rods (Fig. 1A and B). No significant differences of a-wave amplitude were found between these groups under −10 db stimuli intensity. However, the b-wave amplitude in the OEC-treated eyes was significantly larger than that seen in the PBS-treated eyes. The amplitude of b-wave was analyzed at 3 weeks (293.3 ± 99.2 vs. 165.6 ± 96.4 uv, p < 0.01) and 8 weeks (89.7 ± 4.9 vs. 33.6 ± 3.8 uv, p < 0.05) after surgery (Fig. 1B).
Figure 1.
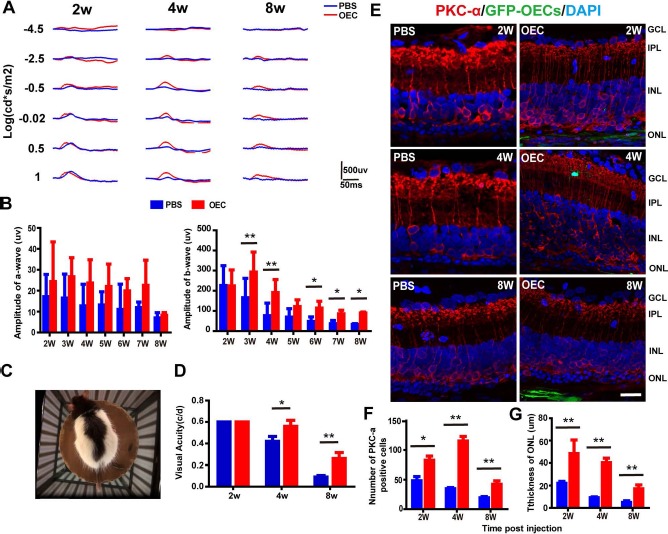
Subretinal olfactory ensheathing cell (OEC) transplantation improved visual function and protected photoreceptors and metabotropic bipolar (ON-bipolar) cells in Royal College of Surgeons (RCS) rats. (A) Representative electroretinography (ERG) waveforms of one rat at different time points after OEC/phosphate-buffered saline (PBS) transplantation (2, 4, and 8 weeks). Red trace, OEC transplantation; blue trace, subretinal injection of PBS (control). (B, left) A-wave amplitude following OEC (red) and PBS (blue) injection at 2 to 8 weeks. No significant differences were observed between groups. (B, right) Same as the left, but showing data for b-wave amplitude. After 2 weeks, the b-wave amplitude in the OEC-treated eyes was significantly higher than that in the PBS-treated (control) eyes. Data are shown as mean±standard deviation. (C, D) Changes in visual acuity with time. (C) Top-down photograph of the behavioral apparatus and the rat being tested. (D) Visual acuity of the OEC-treated (red) and PBS-treated (blue) eyes at 2, 4, and 8 weeks after transplantation (n = 8); cyc/deg, cycles/degree. (E) Double immunolabeling with protein kinase Cα (PKCα, red) and green fluorescent protein (GFP)-OECs (green) in the retinas of the PBS and OEC groups at 2, 4, and 8 weeks after transplantation. Background staining with 4′,6-diamidino-2-phenylindole (DAPI; blue). (F) Number of PKCα+ cells and (G) mean thickness of the outer nuclear layer (ONL) in OEC-treated and PBS-treated retinas. *p < 0.05, **p < 0.01. INL, inner nuclear layer; IPL, inner plexiform layer; GCL, ganglion cell layer. Scale bar: 50 μm.
Data from the virtual reality optomotor system revealed that both the OEC and PBS groups had an average visual acuity of 0.8 cycles/degree (cyc/deg) at 2 weeks after transplantation, and visual acuity decreased over time in both groups. However, by 4 weeks after transplantation, the visual acuity of the OEC group was 1.2 times that of the PBS group (0.76 ± 0.05 vs. 0.62 ± 0.04 cyc/deg; p < 0.05). By 8 weeks, this difference had increased, with the acuity of the OEC group being 3.1 times that of the PBS group (0.26 ± 0.05 vs. 0.09 ± 0.01 cyc/deg; p < 0.01) (Fig. 1C and D).
To study the histological changes in the retina associated with these functional results, we performed immunolabeling of ON-bipolar cells (metabotropic bipolar cells, which contribute to the b-wave39) with protein kinase Cα (PKCα) after GFP-OEC transplantation. As illustrated in the example retinal cryosection slides (Fig. 1E), the expression of PKCα+ cells was higher in the OEC group than the PBS group. Group data were analyzed (Fig. 1F) at 2 weeks (82.7 ± 7.0 vs. 48.3 ± 7.0, p < 0.05), 4 weeks (115.3 ± 7.8 vs. 34.7 ± 2.1, p < 0.01), and 8 weeks (42.3 ± 5.9 vs. 19.3 ± 2.1, p < 0.01) after surgery.
In addition, we measured the thickness of the retina ONL. While the thickness of the ONL fell in both groups over time, the ONL in the OEC group was significantly thicker than that of the PBS group at all time points (Fig. 1G). At 8 weeks after surgery, the thickness of the ONL in the OEC group was 3.4 times that in the PBS group (p < 0.01).
Migration of Grafted OECs in the Retina of RCS Rats and their Patterns of Interaction with Müller Cells
To elucidate how transplanted OECs suppressed the gliotic reaction of the Müller cells, confocal microscopy was used to observe the relationship between transplanted OECs and recipient Müller cells. After primary culture of OECs for 14 days (Fig. 2A), cells were characterized by immunofluorescence staining with nerve growth factor receptor p75 (NGFRp75) and S-100β. Approximately 90% of the cultured cells were both NGFRp75+ and S-100β+ OECs (Fig. 2B). To track the OECs after they were transplanted into subretinal space, the cells were infected with lentivirus-GFP. Over 90% of the cells expressed GFP (Fig. 2C).
Figure 2.
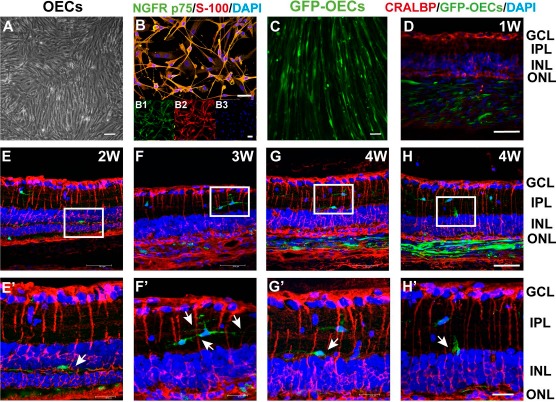
Interaction patterns between grafted OECs and recipient Müller cells. (A) The morphology of OECs after primary culture for 14 days. (B) Merged image showing immunostaining to identify OECs. Insets show separate color channels; (B1) Nerve growth factor receptor p75-positive (NGFRp75+) (green); (B2) S-100β+ (red); (B3) DAPI+ (blue). (C) OECs labeled by lentiviruses carrying the enhanced GFP (LV-GFP) (green). (D–H′) Example patterns of the interaction between OECs and Müller cells. (E′–H′) Higher magnification images of the areas shown in white boxes in (E–H). White arrows indicate the phenotype of a migrated OEC in the retina of RCS rats. GFP-OECs, green; cellular retinaldehyde-binding protein (CRALBP) (Müller cell marker), red; DAPI, blue. Scale bars: 100 μm (A–C), 50 μm (D–H), 20 μm (E′–H′).
The immunofluorescence results showed that GFP-labeled OECs migrated into the inner nuclear layer (INL) and inner plexiform layer (IPL) 2 to 4 weeks after the transplantation and interacted with Müller cells (Fig. 2D–H′). In the first week after surgery, most OECs stayed in the transplantation site and did not immediately migrate into the INL (Fig. 2D). From 2 to 4 weeks, OECs migrated into the INL and IPL and interacted with Müller cells. There were three observed interaction patterns between transplanted OECs and recipient Müller cells: (1) the cell body of some OECs interacted with the processes of Müller cells (Fig. 2F, F′, G, and G′); (2) the processes of some OECs interacted with the processes of several Müller cells (Fig. 2H and H′); and (3) the cell body of some OECs interacted with the body of Müller cells (Fig. 2E and E′). These results suggest that transplanted OECs interacted with recipient Müller cells after they migrated into the outer plexiform layer (OPL), INL, or IPL.
Changes of MMP-2 and MMP-3 Levels in OECs
To explore the mechanism by which transplanted OECs migrated into the OPL, INL, or IPL, we detected the expression of MMP-2 and MMP-3 using double immunofluorescence staining and ELISA. Double immunofluorescence staining results showed that the OEC-specific markers were colocated with MMP-2 (Fig. 3A) and MMP-3 (Fig. 3B).
Figure 3.

OECs expressed and secreted MMP-2 and MMP-3 in vitro and in vivo. (A, B) Double immunostaining (merge and separate channels) showing the expression of matrix metalloproteinase 2 (MMP-2) and MMP-3 on the OECs after culture for 14 days [NGFRp75, green; MMP-2 and MMP-3, red; DAPI, blue]. (C, D) Results of enzyme-linked immunosorbent assay (ELISA) for MMP on retinal lysates, showing the concentration of MMP-2 and MMP-3 in the OEC culture medium and control medium after culture for 5, 8, 11, and 14 days. (n = 9). (E, F) Concentration of MMP-2 and MMP-3 in the blank group, OEC group, and PBS group at 1, 2, 3, and 4 weeks after transplantation, as measured by ELISA of retinal lysates (n = 9). (G) Examples of Transwell assay images. (H) Quantified group Transwell assay results showing significant migration of OECs when cocultured with Müller cells and significantly inhibited migration after tissue inhibitor of metalloproteinase 2 (TIMP-2) was added (n = 3). *p < 0.05, **p < 0.01. Scale bars: 50 μm (A, C), 100 μm (G).
Next, to determine whether MMPs expressed in OECs were secreted from the cell, ELISA was used to determine the level of MMP proteins in the culture medium. ELISA results showed that the MMP-2 and MMP-3 concentration in the OEC culture medium, after culture for 8, 11, and 14 days, was significantly higher than the control medium (Fig. 3C and D). These results suggest that OECs secreted MMP-2 and MMP-3 in vitro.
Furthermore, we examined the expression of MMP-2 and MMP-3 in the blank control, OEC, and PBS groups 1–4 weeks after transplantation using an ELISA assay. Similarly, we found that the MMP-2 concentration in the OEC-treated retinas was significantly higher at 3 and 4 weeks after surgery, compared with the blank and PBS groups (OEC group 1.90±0.21 vs. blank group 1.25±0.17 vs. PBS group 1.21±0.16 at 3 weeks, p < 0.01; OEC group 3.38±0.29 vs. blank group 1.34±0.16 vs. PBS group 1.45±0.16 at 4 weeks, p < 0.01). There was no significant difference in the MMP-2 and MMP-3 concentration between the PBS and blank groups (Fig. 3E and F). These data suggest that cultured OECs expressed and secreted MMP-2 and MMP-3 in vivo and in vitro.
In the Transwell migration assay, the number of migrated cells was 11.1 ± 2.9 times higher in the Müller cells + OECs (M + O) group than that in the ONFs + OECs (O + O) group (p < 0.05). In the presence of TIMP-2, an inhibitor of MMPs (M + O + T group), OEC transmigration was completely inhibited (migration of the M + O + T group 0.09±0.04 times that of the M + O group; p < 0.01) (Fig. 3G and H).
Transplanted OECs Suppressed the Gliotic Reaction of Müller Cells
As we have shown previously14,33, transplantation of OECs into the retinas of RCS rats suppressed the gliotic reaction of Müller cells. Here immunostaining of GFAP, a marker of retinal gliosis, revealed reduced GFAP expression in OEC-treated retinas, compared to PBS-treated retinas (Fig. 4A). Quantification using group data (Fig. 4B) showed that the GFAP intensity was significantly reduced at all time points in the OEC-treated retinas, compared to controls (OEC group 5.29 ± 1.06 vs. PBS group 13.38 ± 3.34 at 2 weeks, p < 0.01; OEC group 2.81 ± 0.91 vs. PBS group 8.35 ± 1.18 at 4 weeks, p < 0.01; OEC group 6.56 ± 1.86 vs. PBS group 10.52 ± 1.94 at 8 weeks, p < 0.01). Furthermore, Western blotting (Fig. 4C) revealed significantly lower expression of GFAP in the lysate from OEC-treated retinas than control retinas at all time points measured (OEC group 0.62 times at 2 weeks, 0.39 times at 4 weeks, 0.73 times at 8 weeks, compared to PBS group, respectively; p < 0.01) (Fig. 4D).
Figure 4.

Transplanted OECs suppressed the gliotic reaction of Müller cells. (A) OEC- and PBS-treated retinas at 2, 4, and 8 weeks [Müller cells, as stained by glial fibrillary acidic protein (GFAP), red; DAPI, blue]. (B) Quantitative group analysis of the relative fluorescence intensity of GFAP. (C) Example Western blot of GFAP in both groups (b-actin, loading control). (D) Group comparison of the levels of GFAP protein expression in OEC-treated and PBS-treated retinas at 2, 4, and 8 weeks. *p < 0.05, **p < 0.01. Scale bar: 50 μm.
The lower levels of GFAP, evidenced by both methods of quantification, confirmed our previous findings that OECs suppressed the gliosis associated with Müller cells in retinal degeneration.
Changes in Notch Signaling Between OECs and Müller Cells in the Retina of RCS Rats
Since Müller cell gliosis was inhibited significantly after the transplantation of OECs, and Notch signaling is known to be involved in this type of gliosis, the activity of the Notch signaling pathway in the Müller cells was next studied.
Isolated and cultured Müller cells of RCS rats exhibited flattened and spindle-like appearance after three passages (Fig. 5A). Cultured cells were immunopositive for the specific Müller cell surface marker, cellular retinaldehyde-binding protein (CRALBP) (Fig. 5A). Notch3 immunoreactivity was observed in cultured Müller cells (Fig. 5A, left) using double immunofluorescence staining. Furthermore, cultured OECs were found to be immunopositive for delta-like ligand 1 (DLL1) and DLL4, two ligands for Notch receptors (Fig. 5A, right).
Figure 5.

Components of the Notch pathway decreased after OEC transplantation in RCS rat retinas. (A) Müller cells, left five panels: The primary cultured Müller cells appeared flattened and spindle-like after three passages of purification. Immunocytochemical analysis showed that the cells were CRALBP+. Double immunostaining indicated that Notch3 was expressed on Müller cells [Müller cells, CRALBP, red; Notch3, green; DAPI, blue]. (A) OECs, right two panels: delta-like ligand 1 (DLL1) and DLL4 were expressed on OECs (DLL1 and DLL4, green; DAPI, blue). (B) The mRNA expression of CRALBP and Notch3 in purified Müller cells by RT-PCR after one and three passages. Left: Bar chart of expression levels; right: plot of Notch3 mRNA expression versus CRALBP mRNA expression, with regression line (r2 = 0.998, p < 0.01). (C) Double-labeled immunofluorescence staining against CRALBP (red) and Notch3 (green) in PBS-treated eyes and OEC-treated eyes (D) Quantitative group analysis of the relative fluorescence intensity of the Notch3. (E, F) Changes in mRNA levels of components of the Notch pathway at 2 and 4 weeks after treatment. (G) Example of Western blot for Notch3 and DLL4 protein levels at 2 and 4 weeks after OEC or PBS treatment. (H) Quantified group analysis of protein levels (by Western blot) of Notch3 levels at 2 and 4 weeks after OEC or PBS treatment. β-Actin is a loading control. (I) Same as panel (H), but for DLL4. Bars and error bars represent mean±standard deviation (n = 3). *p < 0.05, **p < 0.01. Scale bars: 50 μm.
Both the mRNA expression of CRALBP and Notch3 increased in purified Müller cells after one and three passages, when compared with those in primary (P0) cultured cells (CRALBP gene expression from 1.58- to 3.77-fold and Notch3 from 1.63- to 3.96-fold compared with P0, respectively; p < 0.01). Additionally, linear regression between the mRNA expression level of Notch3 and CRALBP at P0, P1, and P3 revealed a positive relationship (r2 = 0.998, p < 0.01) (Fig. 5B).
Taken together, these results indicated that expressed Notch3 protein, on cultured Müller cells, and Notch3 mRNA expression levels increased with the purification of Müller cells. This is consistent with a previous study showing that Notch3 was expressed and detectable on retinal Müller glial cells40.
Since the activation of the Notch signaling pathway contributes to promoting glial cell fate specification41,42, we next detected the expression of Notch3 on Müller cells in the OEC and PBS groups using immunofluorescence staining. We found that specimens from the PBS-treated group, labeled with anti-GFAP, showed strong labeling of hypertrophic Müller cells, with subretinal growth evident at both the outer border and in the inner retina (Fig. 5C, left). OEC-treated counterparts revealed weakly labeled Müller cell fibers (Fig. 5C, right). Group data confirmed that the expression levels of Notch3 were significantly reduced in the OEC group at 2 and 4 weeks after the surgery, compared with the PBS group (Fig. 5D).
We next measured the mRNA expression levels of a number of Notch signaling pathway components, including DLL1, DLL4, Jagged1, Hes1, and Hes5, using RT-PCR. Two weeks after the transplantation procedure, the mRNA expression levels of Notch3 (OEC group 0.76 ± 0.21 times that of PBS group, p < 0.05), DLL1 (OEC group 0.76 ± 0.09 times that of PBS group, p < 0.05), DLL4 (OEC group 0.81 ± 0.21 times that of PBS group, p < 0.05), Jagged1 (OEC group 0.57 ± 0.12 times that of PBS group, p < 0.05), Hes1 (OEC group 0.78 ± 0.06 times that of PBS group, p < 0.05), and Hes5 (OEC group 0.16 ± 0.17 times that of PBS group, p < 0.01) were all reduced in the OEC-treated group compared with the PBS-treated group (Fig. 5E). Four weeks after the transplantation, the expression levels of Notch2 (OEC group 0.73 ± 0.09 times that of PBS group, p < 0.05), Notch3 (OEC group 0.13 ± 0.02 times that of PBS group, p < 0.01), Notch4 (OEC group 0.41 ± 0.04 times that of PBS group, p < 0.05), DLL1 (OEC group 0.54 ± 0.04 times that of PBS group, p < 0.05), DLL4 (OEC group 0.15 ± 0.05 times that of PBS group, p < 0.01), and Jagged1 (OEC group 0.52 ± 0.1 times that of PBS group, p < 0.05) were all significantly decreased in the OEC group compared with the PBS group (Fig. 5F). However, there was no significant difference in the expression levels of Hes1 and Hes5 between the two groups at 4 weeks (Fig. 5E and F).
Western blots (Fig. 5G) confirmed that the relative level of Notch3 protein in the OEC-treated group was 0.79 times that of the PBS-treated group at 2 weeks (median: 0.79 ± 0.02 vs. 1; p < 0.05) and 0.39 times at 4 weeks (median: 0.39 ± 0.07 vs. 1; p < 0.01) (Fig. 5H). The level of the Notch ligand, DLL4, in the OEC-treated group was 0.62 times that in the PBS group at 2 weeks (median: 0.62 ± 0.1 vs. 1; p < 0.05) and 0.39 times at 4 weeks (median: 0.39 ± 0.04 vs. 1; p < 0.01) (Fig. 5I).
Taken together, these data suggest that, after a transplantation of OECs into the subretinal space of RCS rats, the Notch signaling components such as DLL1, DLL4, Jagged1, Hes1, and Hes5 were downregulated, which is consistent with reduced DLL signaling from OECs to their neighboring cells.
Discussion
Transplanted OECs Could Delay Visual Function Deterioration in Retinal Degeneration
In the present study, we used ERG and behavior test to explore visual function in eyes that had received a subretinal transplantation of OECs, compared to vehicle controls (subretinal PBS injection). We did not see significant differences in a-wave amplitude between groups, but b-waves were significantly more robust in OEC-grafted rats. The behavior test showed that OEC-treated eyes performed significantly better than the PBS-treated eyes at 4 and 8 weeks. The best visual acuity in the OEC group was 0.76 cyc/deg, compared with a visual acuity of 0.62 cyc/deg in the PBS group at 4 weeks, and 0.26 cyc/deg the in OEC group versus 0.09 cyc/deg in the PBS group at 8 weeks. Interestingly, when we compared our ERG, behavior test, and histological data, we found that the rats with robust b-waves had a greater number of preserved ONL cells and PKCα+ cells, whereas those OEC-grafted rats with limited b-wave responses tended to have preserved photoreceptors.
One explanation for these results may be that the ERG is a gross light-evoked field potential recorded from the retina, and even in normal rats, no obvious a-wave is evoked by dim light43. However, perhaps because of the amplification effects between photoreceptors and bipolar cells43, the b-wave of the ERG (which represents the function of ON-bipolar cells39) was maintained to 8 weeks in OEC-grafted RCS rats. This finding was consistent with the results of histological staining for PKCα.
Since the number of transplanted cells used in this study was limited, this may explain why the inhibition of gliosis was not more complete, and as the degeneration proceeded, the visual function could not be preserved for a longer time.
Transplanted OECs Migrated and Interacted with Müller Cells
Previously, we found that transplanted OECs moved within the subretinal space and migrated into each layer of the retina, including the ONL, OPL, INL, and IPL14. Questions arose from that work regarding the underlying molecular mechanisms, namely, (1) How can the transplanted OECs migrate into various layers of retina? (2) Is there an interaction between OECs and Müller cells? (3) If an interaction exists, how do OECs affect Müller cells?
In this study, we addressed these questions by analyzing the molecular profiles of donor OECs and recipient Müller cells. Using a combination of cell biology, immunology, and imaging techniques, our results showed that MMP-2 and MMP-3 were highly expressed in cultured OECs of the outer olfactory bulb layer and secreted and released by OECs into the medium. These results are in agreement with a previous study37, which showed that MMPs are involved in the migration of OECs in vitro on ECM substrates.
Furthermore, we here showed, using ELISA, that the MMP-2 and MMP-3 levels in the conditional medium of cultured OECs were significantly increased compared with controls, which suggests that cultured OECs have the ability to secrete MMP-2 and MMP-3 in vitro. Consistent with this, our in vivo results showed that the expression of MMP-2 and MMP-3 was upregulated in the retinal tissues of RCS rats who received subretinal transplantation of OECs.
MMP-2 and MMP-3 belong to the MMP family of proteolytic enzymes that cleave ECM and degrade extracellular macromolecules that are important in tissue remodeling, cell migration, angiogenesis, and neurogenesis44,45. Besides their role in promoting migration, MMPs secreted by OECs (and MMP-2 in particular) can degrade axonal growth inhibitory chondroitin sulfate proteoglycans (CSPGs)46 and other inhibitory molecules47, which may allow for a regeneration-promoting environment for axonal growth in the CNS. Therefore, transplanted OECs migrate and enter various layers of the retina to interact with inner cells, possibly through their secretion of MMP-2 and MMP-3.
Our confocal microscopy results showed that inner retina OECs interacted with Müller cells after OECs migrated into the INL and IPL of the retina. We observed at least three patterns of intercellular communication between the transplanted OECs and Müller cells, namely, interaction between the cell body of OECs and the body of Müller cells; between the cell body of OECs and Müller cell processes; and between the processes of OECs and Müller cell processes. These results suggest that transplanted OECs interacted with Müller cells in the recipient retina after they migrated into the IPL or INL and that they may have intercommunicated with Müller cells.
These findings are consistent with previous studies that have observed functional recovery after OEC transplantation into lesioned spinal cord, caused by regenerated fibers reconnecting to appropriate targets below the lesion48,49. One link between regeneration and functional recovery is histological evidence of fibers growing through the graft and into the caudal stump of the spinal cord to interact with astrocytes8. In this study, what is the likely significance of the interaction patterns between OECs and Müller cells? Results from previous studies indicate that OECs transplanted into the injured CNS are able to decrease GFAP expression in reactive astrocytes by secretion of soluble factors and, possibly, also by direct contact between cells9,50,51. Moreover, OECs express a number of molecules involved in ECM remodeling, including neuregulins and some neurotrophins, which could contribute to their ability to intermingle with cells from the neural scar and change the hostile environment into an environment more conducive to axon regeneration52. However, whether similar mechanisms are utilized by OECs upon interaction with Müller cells in the retina is not clear. Fairless et al.53 report that OECs are capable of forming cadherin-associated intercellular contacts at their interface with astrocytes. So interpreting our results, we speculate that different interaction patterns between transplanted OECs and Müller cells may correspond to different soluble factors expressed by OECs. However, further studies are needed to demonstrate the inferences we make about mechanisms of migration and interaction.
The Notch Pathway Was Downregulated After OEC Transplantation
Notch signaling is a cell-to-cell signaling pathway that is activated by binding of a number of different cell surface ligands—including the δ family (δ1, δ3, and δ4) and the Jagged family (Jagged1 and Jagged2)—to transmembrane receptors (Notch1, Notch2, Notch3, and Notch4) on the surface of adjacent cells21. The Notch pathway has been extensively studied in the developing retina, but there is currently no evidence that Notch signaling influences the gliotic phenotypes of Müller cells in the degenerative retina.
To test the possibility that Notch signaling is involved in the phenotypes caused by OEC transplantation, we first detected the expression of Notch signaling pathway components in Müller glia and transplanted OECs. The results of our immunofluorescence staining experiments showed, first, that the Notch ligands DLL1 and DLL4 were expressed in cultured OECs derived from the olfactory bulb. Second, Notch3 was highly expressed in Müller cells, which is consistent with a report that shows that Notch3 regulates the fate determination of Müller cells40. In the present study, we demonstrated that after OEC transplantation, there was a massive outgrowth of processes from Müller cells, which interweaved intimately with the grafted OECs. This is consistent with studies showing that OECs interweave with astrocytes after transplantation in spinal cord injury9.
Gliosis can certainly be influenced by astrocytes via cell-to-cell contact-dependent signaling mechanisms, such as the Notch signaling pathway54. In this study, we focused on the Notch signaling pathway and the change of GFAP expression before and after OEC transplantation. Our immunofluorescence staining results showed that the surface expression of Notch1, Notch2, Notch3, Notch4, DLL1, and DLL4 was significantly decreased in the OEC-treated group, compared with the PBS-treated group. Furthermore, RT-PCR analysis revealed that the gene expression levels of Notch2, Notch3, Notch4, Jagged1, DLL1, DLL4, Hes1, and Hes5 in the recipient retina were significantly reduced after OEC transplantation, compared with the PBS group.
We suggest that a decrease in surface expression of DLL1, DLL4, and Jagged1 on OECs may lead to reduced activation of the Notch signaling pathway in Müller cells in RCS rats, due to an interaction between OECs and Müller cells. Notably, it has been previously reported that the Notch signaling pathway is inhibited in astrocytes from GFAP and vimentin knockout mice55.
The molecular mechanism that underlies this change in ligand expression and Notch pathway downregulation is still unclear. However, it is possible that the increased secretion of MMP by OECs is important. A previous study by Jin et al. shows that DLL on the cell surface can be cleaved by MMP, and this leads to downregulation of lateral Notch signaling56. Taken together, these findings support a hypothesis that increased secretion of MMP from OECs may reflect the existence of a negative feedback loop between MMP and Notch. However, further studies are clearly needed to explore the molecular mechanisms involved in Notch signaling between OECs and Müller cells and the possible downstream pathways.
Interestingly, we note that Hes1 and Hes5 (unlike the other Notch pathway components) were only reduced at 2 weeks, and this reduction did not continue out to 4 weeks. Hes proteins are a family of basic helix–loop–helix (bHLH) transcriptional repressors, which includes the Notch target proteins, Hes1, Hes3, Hes5, Hes7, HRT-1 (Hes-related protein 1), and HRT-257. Recent evidence has shown that in diseases such as age-related macular degeneration, retinitis pigmentosa, and glaucoma, a subset of Müller cells disclose an evolutionarily conserved stem cell potential through upregulation of Hes1 and Lef1 (the intracellular effectors of Notch and Wnt signaling, respectively)58. We speculate that, in our study, the increased expression of Hes1 and Hes5 at 4 weeks after transplantation may be related to complex pathological signaling processes occurring during retinal degeneration, such as Müller cell dedifferentiation.
To summarize, in this study we showed, first, that transplanted OECs migrated into the recipient retina and that MMP-2 and MMP-3 may have been involved in this migration process. Second, transplanted OECs interacted with Müller cells and suppressed Müller cell gliosis by inhibiting the Notch signaling pathway, possibly via MMP secretion and changes in Notch ligand expression. Finally, and perhaps most importantly with regard therapeutic potential, we saw a relative preservation of vision in a rodent model of retinal generation following OEC transplantation. Our findings provide a theoretical foundation for further study of the efficacy of OEC transplantation and the potential for new treatments for retinal degenerative diseases in human patients in the future.
Acknowledgments
The authors thank all the staff of their laboratory. This work was supported by the 973 Project 2013CB967002 from the National Key Basic Research Program of China. The authors declare no conflicts of interest.
References
- 1.Zhao T.T., Tian C.Y., Yin Z.Q. Activation of Muller cells occurs during retinal degeneration in RCS rats. Adv Exp Med Biol. 2010; 664: 575–83. [DOI] [PubMed] [Google Scholar]
- 2.Thomas B.B., Zhu D., Zhang L., Thomas P.B., Hu Y., Nazari H., Stefanini F., Falabella P., Clegg D.O., Hinton D.R., Humayun M.S. Survival and functionality of hESC-derived retinal pigment epithelium cells cultured as a monolayer on polymer substrates transplanted in RCS rats. Invest Ophthalmol Vis Sci. 2016; 57(6): 2877–87. [DOI] [PubMed] [Google Scholar]
- 3.Lassiale S., Valamanesh F., Klein C., Hicks D., Abitbol M., Versaux-Botteri C. Changes in aquaporin-4 and Kir4.1 expression in rats with inherited retinal dystrophy. Exp Eye Res. 2016; 148: 33–44. [DOI] [PubMed] [Google Scholar]
- 4.Tzameret A., Sher I., Belkin M., Treves A.J., Meir A., Nagler A., Levkovitch-Verbin H., Barshack I., Rosner M., Rotenstreich Y. Transplantation of human bone marrow mesenchymal stem cells as a thin subretinal layer ameliorates retinal degeneration in a rat model of retinal dystrophy. Exp Eye Res. 2014; 118: 135–44. [DOI] [PubMed] [Google Scholar]
- 5.Doucette R. Glial influences on axonal growth in the primary olfactory system. Glia 1990; 3(6): 433–49. [DOI] [PubMed] [Google Scholar]
- 6.Chuah M.I., Hale D.M., West A.K. Interaction of olfactory ensheathing cells with other cell types in vitro and after transplantation: Glial scars and inflammation. Exp Neurol. 2011; 229(1): 46–53. [DOI] [PubMed] [Google Scholar]
- 7.Keyvan-Fouladi N., Raisman G., Li Y. Functional repair of the corticospinal tract by delayed transplantation of olfactory ensheathing cells in adult rats. J Neurosci. 2003; 23(28): 9428–34. [DOI] [PMC free article] [PubMed] [Google Scholar]
- 8.Li Y., Carlstedt T., Berthold C.H., Raisman G. Interaction of transplanted olfactory-ensheathing cells and host astrocytic processes provides a bridge for axons to regenerate across the dorsal root entry zone. Exp Neurol. 2004; 188(2): 300–8. [DOI] [PubMed] [Google Scholar]
- 9.Li Y., Li D., Raisman G. Interaction of olfactory ensheathing cells with astrocytes may be the key to repair of tract injuries in the spinal cord: The ‘pathway hypothesis’. J Neurocytol. 2005; 34(3–5): 343–51. [DOI] [PubMed] [Google Scholar]
- 10.Barnett S.C., Chang L. Olfactory ensheathing cells and CNS repair: Going solo or in need of a friend? Trends Neurosci. 2004; 27(1): 54–60. [DOI] [PubMed] [Google Scholar]
- 11.Li Y., Decherchi P., Raisman G. Transplantation of olfactory ensheathing cells into spinal cord lesions restores breathing and climbing. J Neurosci. 2003; 23(3): 727–31. [DOI] [PMC free article] [PubMed] [Google Scholar]
- 12.Li Y., Field P.M., Raisman G. Repair of adult rat corticospinal tract by transplants of olfactory ensheathing cells. Science 1997; 277(5334): 2000–2. [DOI] [PubMed] [Google Scholar]
- 13.Moreno-Flores M.T., Diaz-Nido J., Wandosell F., Avila J. Olfactory ensheathing glia: Drivers of axonal regeneration in the central nervous system? J Biomed Biotechnol. 2002; 2(1): 37–43. [DOI] [PMC free article] [PubMed] [Google Scholar]
- 14.Huo S.J., Li Y., Raisman G., Yin Z.Q. Transplanted olfactory ensheathing cells reduce the gliotic injury response of Muller cells in a rat model of retinitis pigmentosa. Brain Res. 2011; 1382: 238–44. [DOI] [PubMed] [Google Scholar]
- 15.Ould-Yahoui A., Sbai O., Baranger K., Bernard A., Gueye Y., Charrat E., Clement B., Gigmes D., Dive V., Girard S.D., Feron F., Khrestchatisky M., Rivera S. Role of matrix metalloproteinases in migration and neurotrophic properties of nasal olfactory stem and ensheathing cells. Cell Transplant. 2013; 22(6): 993–1010. [DOI] [PubMed] [Google Scholar]
- 16.Kawai K., Xue F., Takahara T., Kudo H., Yata Y., Zhang W., Sugiyama T. Matrix metalloproteinase-9 contributes to the mobilization of bone marrow cells in the injured liver. Cell Transplant. 2012; 21(2–3): 453–64. [DOI] [PubMed] [Google Scholar]
- 17.Andries L., Van Hove I., Moons L., De Groef L. Matrix metalloproteinases during axonal regeneration, a multifactorial role from start to finish. Mol Neurobiol. 2017; 54(3): 2114–25. [DOI] [PubMed] [Google Scholar]
- 18.Yui S., Fujita N., Chung C.S., Morita M., Nishimura R. Olfactory ensheathing cells (OECs) degrade neurocan in injured spinal cord by secreting matrix metalloproteinase-2 in a rat contusion model. Jpn J Vet Res. 2014; 62(4): 151–62. [PubMed] [Google Scholar]
- 19.Doucette R. Immunohistochemical localization of laminin, fibronectin and collagen type IV in the nerve fiber layer of the olfactory bulb. Int J Dev Neurosci. 1996; 14(7–8): 945–59. [DOI] [PubMed] [Google Scholar]
- 20.Pellitteri R., Cova L., Zaccheo D., Silani V., Bossolasco P. Phenotypic modulation and neuroprotective effects of olfactory ensheathing cells: A promising tool for cell therapy. Stem Cell Rev. 2016; 12(2): 224–34. [DOI] [PubMed] [Google Scholar]
- 21.Artavanis-Tsakonas S., Rand M.D., Lake R.J. Notch signaling: Cell fate control and signal integration in development. Science 1999; 284(5415): 770–6. [DOI] [PubMed] [Google Scholar]
- 22.Chitnis A., Bally-Cuif L. The Notch meeting: An odyssey from structure to function. Development 2016; 143(7): 1229. [DOI] [PMC free article] [PubMed] [Google Scholar]
- 23.Richards G.S., Rentzsch F. Regulation of Nematostella neural progenitors by SoxB, Notch and bHLH genes. Development 2015; 142(19): 3332–42. [DOI] [PMC free article] [PubMed] [Google Scholar]
- 24.Furukawa T., Mukherjee S., Bao Z.Z., Morrow E.M., Cepko C.L. Rax, Hes1, and notch1 promote the formation of Muller glia by postnatal retinal progenitor cells. Neuron 2000; 26(2): 383–94. [DOI] [PubMed] [Google Scholar]
- 25.Ge W., Martinowich K., Wu X., He F., Miyamoto A., Fan G., Weinmaster G., Sun Y.E. Notch signaling promotes astrogliogenesis via direct CSL-mediated glial gene activation. J Neurosci Res. 2002; 69(6): 848–60. [DOI] [PubMed] [Google Scholar]
- 26.Peco E., Davla S., Camp D.S M.S., Landgraf M., van Meyel D.J. Drosophila astrocytes cover specific territories of the CNS neuropil and are instructed to differentiate by Prospero, a key effector of Notch. Development 2016; 143(7): 1170–81. [DOI] [PubMed] [Google Scholar]
- 27.Vardjan N., Gabrijel M., Potokar M., Svajger U., Kreft M., Jeras M., de Pablo Y., Faiz M., Pekny M., Zorec R. IFN-gamma-induced increase in the mobility of MHC class II compartments in astrocytes depends on intermediate filaments. J Neuroinflammation 2012; 9: 144. [DOI] [PMC free article] [PubMed] [Google Scholar]
- 28.Morga E., Mouad-Amazzal L., Felten P., Heurtaux T., Moro M., Michelucci A., Gabel S., Grandbarbe L., Heuschling P. Jagged1 regulates the activation of astrocytes via modulation of NFkappaB and JAK/STAT/SOCS pathways. Glia 2009; 57(16): 1741–53. [DOI] [PubMed] [Google Scholar]
- 29.Givogri M.I., de Planell M., Galbiati F., Superchi D., Gritti A., Vescovi A., de Vellis J., Bongarzone E.R. Notch signaling in astrocytes and neuroblasts of the adult subventricular zone in health and after cortical injury. Dev Neurosci. 2006; 28(1–2): 81–91. [DOI] [PubMed] [Google Scholar]
- 30.Nash H.H., Borke R.C., Anders J.J. New method of purification for establishing primary cultures of ensheathing cells from the adult olfactory bulb. Glia 2001; 34(2): 81–7. [DOI] [PubMed] [Google Scholar]
- 31.Ruitenberg M.J., Plant G.W., Christensen C.L., Blits B., Niclou S.P., Harvey A.R., Boer G.J., Verhaagen J. Viral vector-mediated gene expression in olfactory ensheathing glia implants in the lesioned rat spinal cord. Gene Ther. 2002; 9(2): 135–46. [DOI] [PubMed] [Google Scholar]
- 32.Hicks D., Courtois Y. The growth and behaviour of rat retinal Muller cells in vitro. 1. An improved method for isolation and culture. Exp Eye Res. 1990; 51(2): 119–29. [DOI] [PubMed] [Google Scholar]
- 33.Huo S.J., Li Y.C., Xie J., Li Y., Raisman G., Zeng Y.X., He J.R., Weng C.H., Yin Z.Q. Transplanted olfactory ensheathing cells reduce retinal degeneration in Royal College of Surgeons rats. Curr Eye Res. 2012; 37(8): 749–58. [DOI] [PubMed] [Google Scholar]
- 34.Li Z., Zeng Y., Chen X., Li Q., Wu W., Xue L., Xu H., Yin Z.Q. Neural stem cells transplanted to the subretinal space of rd1 mice delay retinal degeneration by suppressing microglia activation. Cytotherapy 2016; 18(6): 771–84. [DOI] [PubMed] [Google Scholar]
- 35.Prusky G.T., Alam N.M., Beekman S., Douglas R.M. Rapid quantification of adult and developing mouse spatial vision using a virtual optomotor system. Invest Ophthalmol Vis Sci. 2004; 45(12): 4611–6. [DOI] [PubMed] [Google Scholar]
- 36.Wang J., Xue X., Hong H., Qin M., Zhou J., Sun Q., Liang H., Gao L. Upregulation of microRNA-524-5p enhances the cisplatin sensitivity of gastric cancer cells by modulating proliferation and metastasis via targeting SOX9. Oncotarget 2017; 8(1): 574–82. [DOI] [PMC free article] [PubMed] [Google Scholar]
- 37.Gueye Y., Ferhat L., Sbai O., Bianco J., Ould-Yahoui A., Bernard A., Charrat E., Chauvin J.P., Risso J.J., Feron F., Rivera S., Khrestchatisky M. Trafficking and secretion of matrix metalloproteinase-2 in olfactory ensheathing glial cells: A role in cell migration? Glia 2011; 59(5): 750–70. [DOI] [PubMed] [Google Scholar]
- 38.Song W.T., Zhang X.Y., Xiong S.Q., Wen D., Jiang J., Xia X.B. Comparison of two methods used to culture and purify rat retinal Muller cells. Int J Ophthalmol. 2013; 6(6): 778–84. [DOI] [PMC free article] [PubMed] [Google Scholar]
- 39.Wurziger K., Lichtenberger T., Hanitzsch R. On-bipolar cells and depolarising third-order neurons as the origin of the ERG-b-wave in the RCS rat. Vision Res. 2001; 41(8): 1091–101. [DOI] [PubMed] [Google Scholar]
- 40.Baba Y., Aihara Y., Watanabe S. MicroRNA-7a regulates Muller glia differentiation by attenuating Notch3 expression. Exp Eye Res. 2015; 138: 59–65. [DOI] [PubMed] [Google Scholar]
- 41.Park H.C., Appel B. Delta-Notch signaling regulates oligodendrocyte specification. Development 2003; 130(16): 3747–55. [DOI] [PubMed] [Google Scholar]
- 42.Snyder J.L., Kearns C.A., Appel B. Fbxw7 regulates Notch to control specification of neural precursors for oligodendrocyte fate. Neural Dev. 2012; 7: 15. [DOI] [PMC free article] [PubMed] [Google Scholar]
- 43.Audo I., Robson A.G., Holder G.E., Moore A.T. The negative ERG: Clinical phenotypes and disease mechanisms of inner retinal dysfunction. Surv Ophthalmol. 2008; 53(1): 16–40. [DOI] [PubMed] [Google Scholar]
- 44.Jones G.T. Matrix metalloproteinases in biologic samples. Adv Clin Chem. 2014; 65: 199–219. [DOI] [PubMed] [Google Scholar]
- 45.Mott J.D., Werb Z. Regulation of matrix biology by matrix metalloproteinases. Curr Opin Cell Biol. 2004; 16(5): 558–64. [DOI] [PMC free article] [PubMed] [Google Scholar]
- 46.Zuo J., Ferguson T.A., Hernandez Y.J., Stetler-Stevenson W.G., Muir D. Neuronal matrix metalloproteinase-2 degrades and inactivates a neurite-inhibiting chondroitin sulfate proteoglycan. J Neurosci. 1998; 18(14): 5203–11. [DOI] [PMC free article] [PubMed] [Google Scholar]
- 47.Pizzi M.A., Crowe M.J. Matrix metalloproteinases and proteoglycans in axonal regeneration. Exp Neurol. 2007; 204(2): 496–511. [DOI] [PubMed] [Google Scholar]
- 48.Fouad K., Pearson K. Restoring walking after spinal cord injury. Prog Neurobiol. 2004; 73(2): 107–26. [DOI] [PubMed] [Google Scholar]
- 49.Cheng H., Cao Y., Olson L. Spinal cord repair in adult paraplegic rats: Partial restoration of hind limb function. Science 1996; 273(5274): 510–3. [DOI] [PubMed] [Google Scholar]
- 50.Khankan R.R., Wanner I.B., Phelps P.E. Olfactory ensheathing cell-neurite alignment enhances neurite outgrowth in scar-like cultures. Exp Neurol. 2015; 269: 93–101. [DOI] [PMC free article] [PubMed] [Google Scholar]
- 51.Franssen E.H., Roet K.C., de Bree F.M., Verhaagen J. Olfactory ensheathing glia and Schwann cells exhibit a distinct interaction behavior with meningeal cells. J Neurosci Res. 2009; 87(7): 1556–64. [DOI] [PubMed] [Google Scholar]
- 52.Franssen E.H., De Bree F.M., Essing A.H., Ramon-Cueto A., Verhaagen J. Comparative gene expression profiling of olfactory ensheathing glia and Schwann cells indicates distinct tissue repair characteristics of olfactory ensheathing glia. Glia 2008; 56(12): 1285–98. [DOI] [PubMed] [Google Scholar]
- 53.Fairless R., Frame M.C., Barnett S.C. N-cadherin differentially determines Schwann cell and olfactory ensheathing cell adhesion and migration responses upon contact with astrocytes. Mol Cell Neurosci. 2005; 28(2): 253–63. [DOI] [PubMed] [Google Scholar]
- 54.Lebkuechner I., Wilhelmsson U., Mollerstrom E., Pekna M., Pekny M. Heterogeneity of Notch signaling in astrocytes and the effects of GFAP and vimentin deficiency. J Neurochem. 2015; 135(2): 234–48. [DOI] [PubMed] [Google Scholar]
- 55.Wilhelmsson U., Faiz M., de Pablo Y., Sjoqvist M., Andersson D., Widestrand A., Potokar M., Stenovec M., Smith P.L., Shinjyo N., Pekny T., Zorec R., Stahlberg A., Pekna M., Sahlgren C., Pekny M. Astrocytes negatively regulate neurogenesis through the Jagged1-mediated Notch pathway. Stem Cells 2012; 30(10): 2320–9. [DOI] [PubMed] [Google Scholar]
- 56.Jin G., Zhang F., Chan K.M., Xavier Wong H.L., Liu B., Cheah K.S., Liu X., Mauch C., Liu D., Zhou Z. MT1-MMP cleaves Dll1 to negatively regulate Notch signalling to maintain normal B-cell development. EMBO J. 2011; 30(11): 2281–93. [DOI] [PMC free article] [PubMed] [Google Scholar]
- 57.Guiu J., Shimizu R., D'Altri T., Fraser S.T., Hatakeyama J., Bresnick E.H., Kageyama R., Dzierzak E., Yamamoto M., Espinosa L., Bigas A. Hes repressors are essential regulators of hematopoietic stem cell development downstream of Notch signaling. J Exp Med. 2013; 210(1): 71–84. [DOI] [PMC free article] [PubMed] [Google Scholar]
- 58.Ahmad I., Del Debbio C.B., Das A.V., Parameswaran S. Muller glia: A promising target for therapeutic regeneration. Invest Ophthalmol Vis Sci. 2011; 52(8): 5758–64. [DOI] [PubMed] [Google Scholar]