

Abstract
Malaria transmission is known to be strongly impacted by temperature. The current understanding of how temperature affects mosquito and parasite life history traits derives from a limited number of empirical studies. These studies, some dating back to the early part of last century, are often poorly controlled, have limited replication, explore a narrow range of temperatures, and use a mixture of parasite and mosquito species. Here, we use a single pairing of the Asian mosquito vector, An. stephensi and the human malaria parasite, P. falciparum to conduct a comprehensive evaluation of the thermal performance curves of a range of mosquito and parasite traits relevant to transmission. We show that biting rate, adult mortality rate, parasite development rate, and vector competence are temperature sensitive. Importantly, we find qualitative and quantitative differences to the assumed temperature-dependent relationships. To explore the overall implications of temperature for transmission, we first use a standard model of relative vectorial capacity. This approach suggests a temperature optimum for transmission of 29°C, with minimum and maximum temperatures of 12°C and 38°C, respectively. However, the robustness of the vectorial capacity approach is challenged by the fact that the empirical data violate several of the model’s simplifying assumptions. Accordingly, we present an alternative model of relative force of infection that better captures the observed biology of the vector–parasite interaction. This model suggests a temperature optimum for transmission of 26°C, with a minimum and maximum of 17°C and 35°C, respectively. The differences between the models lead to potentially divergent predictions for the potential impacts of current and future climate change on malaria transmission. The study provides a framework for more detailed, system-specific studies that are essential to develop an improved understanding on the effects of temperature on malaria transmission.
Author summary
Many of the mosquito and parasite life history traits that combine to influence the transmission intensity of malaria (e.g., adult mosquito longevity, biting rate, the developmental period of the parasite within the mosquito, and the proportion of mosquitoes that become infectious) are strongly temperature sensitive. Yet, in spite of decades of research, the precise relationships between individual traits and temperature remain poorly characterized. As a consequence, the majority of studies exploring the influence of local environmental conditions, or prospective impacts of climate change, draw on a combination of studies that utilize different experimental methods and a range of mosquito and parasite species. Here, we use the Indian malaria mosquito, Anopheles stephensi, and the human malaria parasite, Plasmodium falciparum, to thoroughly characterize the influence of temperature on key transmission-related traits. The results reveal a number of novel insights and challenge some longstanding assumptions regarding the nature of mosquito and parasite thermal responses. This study provides an experimental blueprint for further system-specific studies necessary to more fully understand the implications of changing temperatures on malaria transmission.
Introduction
Numerous studies show the transmission of malaria to be strongly influenced by environmental temperature [1–10]. This has led to a large body of both theoretical and empirical research which explores the possible effects of temperature on the dynamics and distribution of malaria both in the present day [6, 11–16] and under scenarios of future climate change [4, 7, 8, 17–23]. In spite of the accepted importance of temperature, the thermal sensitivity of individual mosquito and parasite traits that combine directly or indirectly to determine transmission intensity (i.e., adult longevity, biting rate, fecundity, generation time, vector competence, and parasite extrinsic incubation period [EIP]) remains surprisingly poorly characterized. For example, a recent study that explored the influence of temperature on transmission rate of P. falciparum in Africa utilized data from a Latin American malaria vector for biting rate, a North American vector infected with P. vivax for vector competence, a mixture of 6 malaria vector species from Asia, Africa, and North America for parasite development rate, and even a nonmalaria vector (Aedes albopictus) for fecundity [4]. Many other studies rely on similar data [6, 8, 13, 17, 24–26]. The necessity to combine insights from such disparate systems highlights the paucity of data.
Similarly, the iconic degree-day model developed in the 1960s to define the EIP (also called the period of sporogony) of P. falciparum inside the mosquito vector [27, 28] has been applied in a multitude of studies over the years. Yet, it is rarely acknowledged that this relationship derives from a limited number of experiments conducted in the 1930s and 1940s by using Russian populations of native Mediterranean mosquitoes (An. maculipennis). Furthermore, many other historical experiments that explore temperature-sensitive parasite development rate are very poorly replicated (data points sometimes based on single mosquitoes), contain little or no information about the sources of infectious blood or blood infection levels, and explore a limited temperature range [29–33]. Whether these data are sufficient to describe parasite development rate in every malaria transmission system seems extremely unlikely, yet that is the prevailing assumption.
Here, we present a detailed investigation of how temperature affects key mosquito and parasite traits for a single species pairing of An. stephensi and P. falciparum across a range of temperatures relevant to malaria transmission. Specifically, we measured adult mosquito mortality rate, the duration of the EIP (the time for parasites to reach their infectious stage), vector competence (the maximum prevalence of infectious mosquitoes), and biting rate across several temperatures from 21°C to 34°C. We then use these data to generate temperature-dependent models of relative vectorial capacity (rVC) and relative force of infection. Our data and the contrasting models highlight the need to improve empirical understanding of the effects of temperature on malaria transmission in addition to providing an experimental framework for conducting future species-specific research across a range of vector-parasite pairings.
Results
Our principal experiment involved feeding replicate cups of approximately 150, 3 to 5 day-old adult female An. stephensi mosquitoes on human blood infected with P. falciparum. We then transferred these mosquitoes to temperature-controlled incubators set to 21, 24, 27, 30, 32, and 34°C (our pilot experiment also contained groups at 16°C and 18°C, but no sporogony had occurred through day 26 postinfection, so those groups were excluded from further experiments; see S1 Table). Mosquitoes were monitored to assess daily mortality, and subsamples were removed for dissections at set intervals (see Materials and methods) to track the time it took for parasites to invade the salivary glands, and hence, the distribution of time over which mosquitoes became infectious. The experiment was repeated over 2 independent experimental blocks.
Mosquito mortality
We found that mosquito mortality rate was significantly different across temperature (log-rank test, χ2 = 533, df = 5, p < 0.001) and across temperature and block (log-rank test, χ2 = 569, df = 11, p < 0.001). Upon pairwise log-rank comparison analysis, we found several instances of significant effects of block x temperature interactions (S2–S6 Tables). These interactions are likely due to decreased initial mortality in the second block, which allowed for increased sampling time, especially across warmer temperatures (30°C to 34°C). Nonetheless, mortality tended to increase with temperature across both experimental blocks (Fig 1).
Fig 1. Gompertz model predictions for each temperature and block combination overlaid on corresponding raw (Kaplan-Meier) survival data; (A) experimental block 1; (B) experimental block 2.

Raw data and numerical values can be accessed at http://dx.doi.org/10.5061/dryad.74389 [34].
Due to logistic constraints in generating large numbers of infected mosquitoes, we tracked both mortality and sporogony within the same mosquito samples and, thus, do not have survival data that encompass the entire mortality curve without censored cases. We used parametric survival analysis to characterize survival of each temperature group (S7 and S8 Tables). We fit several survival distributions (Gompertz, Weibull, exponential, log-logistic, and log-normal) to our data and compared the fits using the Aikake information criterion (AIC) (S7 and S8 Tables). These models have been used to describe survival curves of a diversity of insects in laboratory and field settings [35–42]. Our cumulative survival data were best described by a Gompertz function, in which the mortality hazard increases exponentially with age:
where x is a given age, α is the initial mortality rate, and β is the constant exponential mortality increase with age [26, 35, 43, 44]. Because of significant interactions driven by block differences, we built a Gompertz function that describes each temperature x block combination separately (Fig 1, Table 1). Overall, block 2 exhibited higher median survival times, along with lower initial mortality rate (α) values than block 1, regardless of the age-dependent exponential increase in mortality (β).
Table 1. Initial mortality rate (α), age-dependent exponential constant (β) and median survival time for each temperature and experimental block.
| Temperature | Block | Initial Mortality Rate (α) | Age-dependent exponential constant (β) | Median Survival Time, Days (95% CI) |
|---|---|---|---|---|
| 21°Cab | 1 | 0.0129 | 0.0645 | 23.2 (21.4–25.3) |
| 21°Cc | 2 | 0.0063 | 0.1001 | 24.9 (23.2–26.8) |
| 24°Cd | 1 | 0.015 | 0.0642 | 21.5 (19.9–23.2) |
| 24°Ca | 2 | 0.0087 | 0.0929 | 22.9 (21.5–24.6) |
| 27°Ce | 1 | 0.0144 | 0.0928 | 18.3 (17.1–19.7) |
| 27°Cbd | 2 | 0.0103 | 0.0995 | 20.5 (19.3–21.7) |
| 30°Cf | 1 | 0.0236 | 0.0746 | 15.6 (14.3–17.0) |
| 30°Ce | 2 | 0.0152 | 0.1040 | 16.8 (15.7–18.0) |
| 32°Cg | 1 | 0.0257 | 0.1006 | 13.1 (12.0–14.3) |
| 32°Cf | 2 | 0.0161 | 0.1170 | 15.4 (14.5–16.3) |
| 34°Ch | 1 | 0.0315 | 0.1044 | 11.4 (10.6–12.3) |
| 34°Cg | 2 | 0.0172 | 0.1588 | 12.6 (12.0–13.2) |
Initial mortality rate (α) and age-dependent exponential mortality constant (β) of Gompertz functions calculated for each temperature and block combination along with calculated median survival time (bold) with 95% confidence intervals (in parentheses). Values represent calculated rates and survival times for all replicate cups pooled together per block. Superscripts indicate groups that are not significantly different (p > 0.05) upon post-hoc log-rank comparisons between each combination of block and temperature (for detailed information, see S6 Table).
Parasite infection
Dissection of mosquitoes revealed an increase in the prevalence of sporozoite-infected mosquitoes over time in all temperatures (Fig 2). To describe this pattern and enable comparisons of EIP between temperatures, we fit a basic logistic curve to the data for each temperature in both experimental blocks:
where at any given day x, the proportion of infectious mosquitoes is dependent on g (the asymptote), which is the maximum sporozoite prevalence and provides a measure of vector competence, k (a rate constant), which describes the instantaneous change in proportion of infectious mosquitoes through time, and t (the inflection point), the time at which 50% of maximum proportion infectious is reached [1,45,46].
Fig 2. Dynamics of infectiousness over time for each temperature and block combination.

Sporogony represented by the change in proportion of infectious mosquitoes over time. Blue points with connecting lines represent dynamics for each experimental cup in block 1; red points with connecting lines represent cup dynamics for block 2. The logistic regression model for block 1 is depicted by the solid black line, whereas the model for block 2 is the dashed black line. Raw data and numerical values can be accessed at http://dx.doi.org/10.5061/dryad.74389 [34].
At 21°C, 24°C, and 27°C, sporogony was well described by the logistic function applied to the full data series. However, at 30°C, 32°C, and 34°C, the raw data showed an initial increase in prevalence of infectious mosquitoes followed by a decline, which was not accurately described by the logistic function alone (Fig 2). For subsequent modeling analysis (see section on Transmission potential below), we truncate the logistic curves at the day of the peak proportion of infectious mosquitoes and fit exponential curves to characterize the decline in prevalence (calculated by using nonlinear least squares regression in R; S9 Table). This truncation does not affect the calculation of the maximum proportion infectious, the rate constant, nor the inflection point.
EIP is very poorly defined in the literature [4,47–54], so we provide here 3 estimates for each temperature to represent a range of possible interpretations of EIP (i.e., time in days to 10%, 50%, and 90% of maximum infectiousness). In Fig 3, we show how EIP10, EIP50, EIP90, and vector competence (maximum proportion infectious, or g, the asymptote of the logistic curve) values change with temperature in each experimental block (values for logistic model parameters are given in S10 Table). EIPs were shortest at 34°C and increased at cooler temperatures, irrespective of the specific measure of EIP (i.e., EIP10 increased from an average of 6.1 to 11.2 days, EIP50 increased from an average of 7.0 to 15.1 days, and EIP90 increased from an average of 8.0 to 19.0 days; see S11 Table for details). Additionally, the relative and absolute difference between EIP10 and EIP90 increased progressively under cooler conditions (Figs 2, 3A and 3B).
Fig 3.
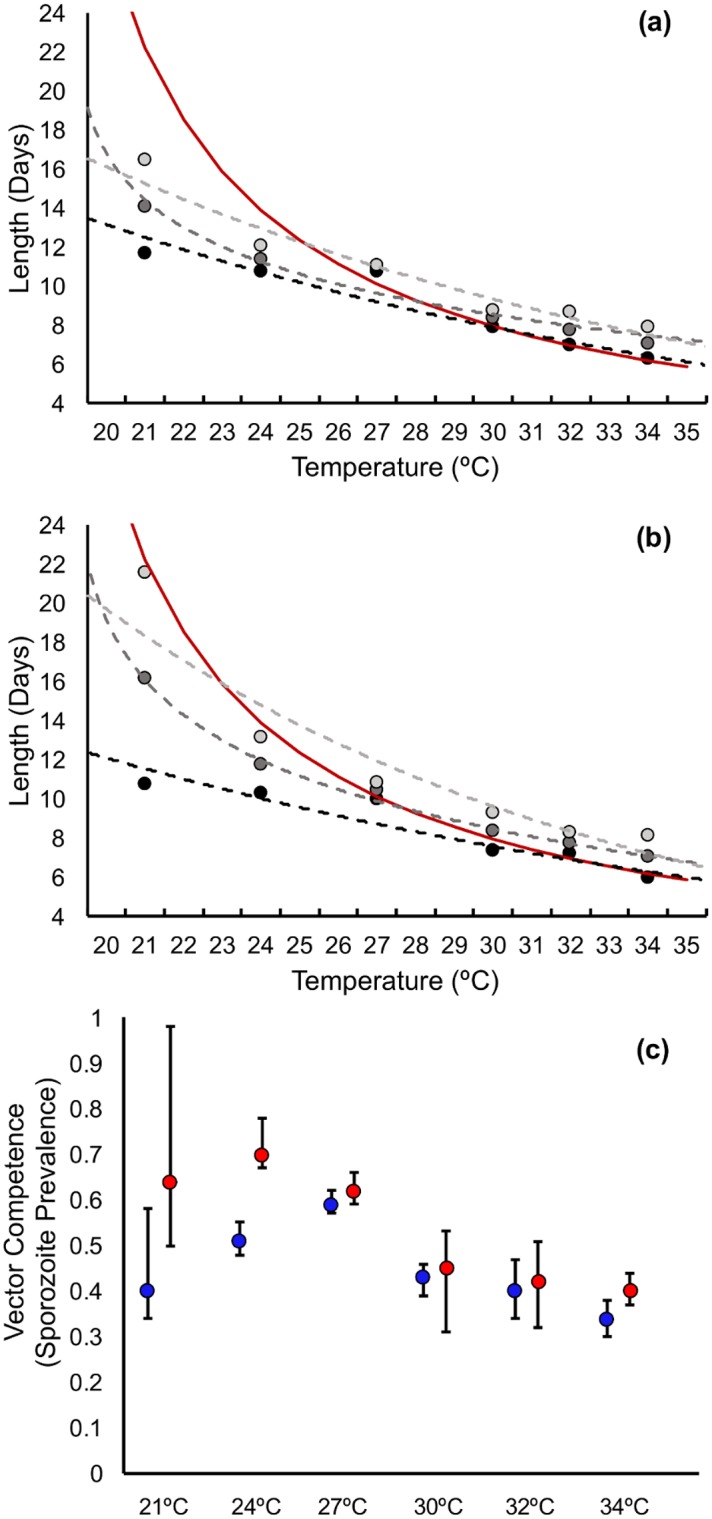
Predicted values for EIP10 (light grey), EIP50 (grey), and EIP90 (black) for each temperature in (A) experimental block 1 and (B) experimental block 2; dotted lines represent the predicted thermal performance curve for the respective EIPs, while the red line is the EIP of P. falciparum predicted from the widely-used degree-day model of Detinova 1962 [27]. (C) Predicted values for vector competence (g, the asymptote of the sporogony curve in Fig 2) across temperature for block 1 (blue) and block 2 (red). Error bars represent 95% confidence intervals. Numerical values can be accessed at http://dx.doi.org/10.5061/dryad.74389 [34]. EIP, extrinsic incubation period.
Gonotrophic cycle
We next conducted an experiment to determine the effect of temperature on the gonotrophic cycle length (i.e., the time from blood meal to oviposition), taking the mean of the first 2 gonotrophic cycles for each temperature. We found that gonotrophic cycle length declined with increasing temperature, although with differences between cycle lengths diminishing as temperature increased (Fig 4). The percentage of mosquitoes laying eggs was lower in the second gonotrophic cycle compared to the first, but there was no obvious effect of temperature on the likelihood of egg laying in either cycle (S12–S14 Tables).
Fig 4. Mean length of the gonotrophic cycle (days) for each temperature.

Error bars represent standard deviation; superscripts represent significant differences (p < 0.05) upon posthoc analysis. Numerical values can be accessed at http://dx.doi.org/10.5061/dryad.74389 [34].
Thermal performance curves
Our empirical data enable us to generate thermal performance curves for biting rate, vector competence, mosquito mortality rate, and parasite development rate.
For estimates of daily biting rate, we followed convention by taking the reciprocal of the mean gonotrophic cycle length [51,52,54–57]. Some mosquitoes, such as An. gambiae and An. funestus, have been shown to take multiple blood meals per gonotrophic cycle [58]. However, there are no data from the field to suggest this behavior for An. stephensi.
For vector competence, we used values of the asymptote (g) of our logistic curves, while for parasite development rate we used the reciprocal of the median EIP (EIP50).
Generating a thermal performance curve for daily mosquito mortality rate is challenging, as we show mortality rate to increase with mosquito age. Accordingly, we follow the methodology described in [4] to fit negative exponential functions to the beginning and end points of the Gompertz distributions and use the exponent to approximate a fixed daily mortality rate for each block and temperature combination (see electronic supplementary material for further methodology and accompanying datasets and figures).
We present the thermal performance curves for these traits in Fig 5, together with equivalent thermal performance curves from the study of Mordecai et al. [4]. Our thermal performance curves exhibit quantitative and qualitative differences to the established thermal performance curves derived from mixed-species data (for additional information comparing specific nonlinear models between this paper and those published previously, see S16 Table).
Fig 5.

Thermal performance curves for (A) biting rate, (B) vector competence, (C) mosquito mortality rate, and (D) parasite development rate (based on the extrinsic incubation period time in days until 50% of maximum infectiousness [EIP50]), comparing the current study to the equivalent curves proposed by Mordecai et al. [4] by using mixed-species data. (E) Shows the predicted temperature-dependent model of rVC based on the thermal performance curves from this study, using data for the EIP50. Numerical values can be accessed at http://dx.doi.org/10.5061/dryad.74389 [34]. EIP, extrinsic incubation period; rVC, relative vectorial capacity.
Transmission potential
Having defined the effects of temperature on biting rate, mortality rate, EIP, and vector competence, it is possible to characterize the overall effects of temperature on transmission potential using a metric such as rVC. The rVC is the daily rate at which mosquitoes can transmit parasites to humans (relative to the vector-to-human population ratio, which here we do not define) [52–54, 56, 59], and is described by the following equation:
where a is the daily biting rate, b is vector competence, μ is the daily mosquito mortality rate and n is the length of the EIP50 (see S2 Fig, S15 Table for calculations of rVC using EIP10 and EIP90 as alternatives).
In Fig 5E we show the temperature-dependent model of rVC based on our thermal performance curves. This model suggests a temperature optimum for transmission of 29°C, with an upper maximum threshold of 38°C and a minimum of 12°C. However, standard vectorial capacity models [1, 53–57, 59] and related models such as the basic reproductive rate, R0 [4, 51, 60], assume constant mortality rate per day, a discrete value for EIP at a given temperature, and no change in the proportion of infectious mosquitoes over time (so, no recovery from infection or altered survival rates due to infection). Our empirical data violate these assumptions, and so we also explore the effects of temperature on relative transmission potential using an alternative measure, adapted from the work of Killeen et al. [61] (see also [45,46] for similar methods). This model explicitly uses the full distributions for survival, sporogony, and competence by multiplying the number of mosquitoes alive on any given day (values from our survival curves) by the probability of being infectious (values from our curves for change in proportion of infectious mosquitoes over time). The product of these 2 proportions (area under the intersection of the 2 curves in Fig 6) represents the daily number of infectious mosquitoes, which we term “infectious mosquito days.” The number of infectious mosquito days is then multiplied by our empirical estimates of biting rate for each temperature to give the probable number of infectious bites transmitted by a cohort of mosquitoes over a given time period, assuming all blood meals are taken on humans; this is analogous to the relative force of infection.
Fig 6. Curves for dynamic model of transmission potential for each temperature.

Area curves for rates of survival (blue) and infection (pink) for each temperature; pPurple areas represent the product of the two 2 curves (i.e., the number of mosquitoes alive and infectious or “infectious mosquito days”). Dashed line represents the day at which collection of raw data ended; curves to the right of the dashed line represent values calculated from both survival and infection model estimates (mean for both experimental blocks). Numerical values can be accessed at http://dx.doi.org/10.5061/dryad.74389 [34].
Because our survival data were truncated, we extended our survival estimates out to day 50, which is the point at which mosquito survival dropped below 1% in the longest-lived temperature treatment. For each temperature, we used the mean of the daily values calculated from the empirical survival and data from both blocks, and used the model fits only for the tails of distributions where we have no raw data.
In Table 2, we provide values for the predicted number of infectious bites transmitted by a cohort of 100 mosquitoes over a period of 50 days for each temperature (see S3 Fig for schematic outlining the model approach).
Table 2. Predicted number of infectious bites for a cohort of 100 females over a period of 50 days.
| Temperature | Infectious Mosquito Days | Biting Rate | Predicted Bites |
|---|---|---|---|
| 21°C | 493.4 | 0.193 (0.171–0.215) | 95.2 (84.4–106.1) |
| 24°C | 695.9 | 0.246 (0.222–0.270) | 171.2 (154.5–187.9) |
| 27°C | 630.4 | 0.296 (0.261–0.331) | 186.6 (164.5–208.7) |
| 30°C | 257.3 | 0.337 (0.288–0.386) | 86.7 (74.1–99.3) |
| 32°C | 196.8 | 0.377 (0.324–0.430) | 74.2 (63.7–84.6) |
| 34°C | 133.0 | 0.421 (0.352–0.49) | 56.0 (46.8–65.17) |
Mean (and standard deviation) number of infectious bites predicted for a cohort of 100 females over a period of 50 days. Values calculated by using the relative force of infection model that takes into account the dynamic distribution of both mortality and infection and daily biting rate.
We then fit a nonlinear curve (in this case the best fit model was a simple quadratic function) to our data points for mean transmission potential at each temperature (Fig 7A). The resultant thermal performance curve of relative force of infection suggests a temperature optimum of 26°C, with lower and upper thresholds of 17°C and 35°C, respectively. In Fig 7B, we compare the models of rVC and relative force of infection.
Fig 7.

(A) Best fit thermal performance curve for relative force of infection (here the number of infectious bites predicted for a cohort of 100 female mosquitoes); grey points represent the calculated number of bites for the mean of both experimental blocks and error bars represent standard deviation. (B) Comparison of scaled thermal performance curves for rVC and relative force of infection. Numerical values can be accessed at http://dx.doi.org/10.5061/dryad.74389 [34]. rVC, relative vectorial capacity.
Discussion
This study represents one of the most detailed empirical investigations of the effects of temperature on P. falciparum and a key mosquito vector conducted to date. The results yield several important insights that challenge classical assumptions. We also provide an experimental blueprint for future species-specific explorations of temperature-mediated changes in malaria transmission, and such data will be essential for future predictive and theoretical modeling studies.
Most conventional malaria transmission models assume constant rate of adult mortality per day [1, 4, 50, 53–55, 59]. In contrast, we show that mosquito mortality rate is most accurately described using an age-dependent distribution, in this case, a Gompertz function. Other studies also suggest age-dependent survival (e.g., [40, 62–65]). Here, we show that the age-dependence holds across temperatures, with initial senescence rate (α) increasing at higher temperatures. We acknowledge that ours is a lab-based study and that the empirical survival data were necessarily truncated because of destructive sampling of mosquitoes for dissection (i.e., Kaplan-Meier estimates are interval-censored). Future studies would benefit from monitoring survival in a parallel group of mosquitoes that receive the same infectious blood meal but with no samples removed for dissection.
A recent analysis of survival data for Aedes mosquitoes indicated that age-dependent mortality is more likely to be found in the laboratory as external mortality factors such as predation, encountering insecticides, and nutritional stress tend to be more prevalent in the field, confounding the effects of senescence [40]. However, a previous field study on geographically-distinct populations of A. aegypti in Southeast Asia and Latin America suggests that age-dependent mortality is observable in the field, and that older mosquitoes die at quicker rates than younger mosquitoes in the same cohort [35]. Whether our data are an artifact of prolonged survival under laboratory conditions is unclear, as very few data exist on the nature of the mortality distributions of adult Anopheles spp. under field conditions.
Existing models of P. falciparum sporogony, either the classic degree-day models [27, 28] or more contemporary thermal performance curves [4], provide a single estimate of EIP for a mosquito population at a given temperature. We show that sporogony is not perfectly synchronized between individual mosquitoes, but instead follows a distribution across the mosquito population over time, with temperature affecting the extent of the distribution (i.e., the number of days over which sporogony occurs), as well as the median value (see also [1, 46]). Most empirical studies are vague in reporting whether they are defining the EIP as the first mosquitoes to become infectious (approximating our EIP10), the median value (EIP50), or the time to maximum prevalence (approximating our EIP90). Our results clearly show potential for substantial variation between these measures, particularly at cooler temperatures. In turn, these discrete, single-value measures of EIP can yield markedly different estimates of transmission potential (such as rVC) for the same mosquito population (S2 Fig, S15 Table).
A number of recent studies describe parasite development rate (the reciprocal of the EIP) as a unimodal function, suggesting a decline in growth rate as temperatures increase above the optimum [4, 25, 66]. The unimodal functions result from inclusion of data (often single data points) at high temperatures in which parasites fail to complete development. Yet, there is a substantial mechanistic difference as to whether high temperatures limit transmission because parasite survival/vector competence declines or because parasite growth slows and EIP becomes progressively long (and is assumed to be infinite at the point where no parasites survive). We find no evidence of an increase in EIP at high temperatures. More data are needed to resolve this fundamental issue.
Furthermore, at high temperatures we see a decline in the prevalence of potentially infectious mosquitoes over time, suggesting either that mosquitoes are recovering from infection (i.e., sporozoites are dying or otherwise being cleared from the salivary glands and surrounding hemolymph), or that infectious mosquitoes exhibit differential mortality and die at a quicker rate compared with noninfectious mosquitoes. Our current experimental design does not enable us to determine the mechanism explicitly, but when we compare overall mosquito survival with the rate of decline in the proportion of infectious mosquitoes over time, we see no significant difference in instantaneous hazard rates (S16 Table, S4 and S5 Figs, see supplementary methods for analysis). This outcome is more consistent with enhanced death of infectious mosquitoes rather than parasite clearance. It has been suggested that P. falciparum has no lethal effect on naturally occurring mosquito hosts [67], yet most studies examine malaria infections in the range of 24°C to 28°C. Our data suggest that P. falciparum might impact mosquito survival at higher temperatures (see also [7]). We are not aware of any malaria transmission models that consider possible costs of parasite infection under increased environmental stress (temperature or otherwise).
Finally, we show that the predicted effects of temperature on overall transmission potential differ between a standard vectorial capacity model and an alternative model of force of infection, with further differences within the vectorial capacity model that are dependent on which estimate of EIP is used (See Fig 2, S15 Table). One reason for this difference is that the empirical life history parameters contradict several of the model assumptions implicit in the vectorial capacity approach. These differences between models could have important biological significance. For example, the differences in the upper and lower thermal limits for transmission would generate different patterns of range expansion and contraction in response to climate change. Within the transmission range, a shift in temperature from 24°C to 28°C (e.g., via seasonal change or longer-term climate warming) would be predicted to increase rVC by 34% but decrease relative force of infection by 1%. At the thermal extremes, even small shifts in temperature have quantitatively different outcomes; warming from 32°C to 34°C, for example, reduces rVC by 30% but reduces the force of infection model by 62%.
Our model of rVC derives from the standard formulation developed by Garret-Jones [53], which is itself a simplified version of the original dynamical model as developed by Macdonald [47]. Alternative formulations of vectorial capacity, such as presented in Brady et al. [68], could generate different thermal response curves for transmission as they combine individual life history traits in different ways. Extension of either the rVC model or the model of relative force of infection to a more holistic metric, such as the basic reproductive rate, requires additional information on actual mosquito density (also likely temperature dependent through effects of temperature on larval development rate and survival [66]), as well as susceptibility and rate of recovery of the human host. Regardless of model framework, properly characterizing the thermal performance curves for individual traits remains important, especially for key traits such as the proportion of mosquitoes surviving the EIP, or the frequency of blood feeding, as these are integral to transmission.
In general, we demonstrate that a detailed, system-specific examination of temperature sensitivity yields quantitatively and qualitatively different estimates of temperature-dependent life history traits, compared to the currently accepted relationships that integrate data from diverse studies and a mixture of mosquito and parasite species. For some traits, the differences appear small (e.g., our data on biting rate match previous data quite closely, at least over the temperature range of the current study). For other traits, the differences are substantial; our observed mortality rates are much higher, our parasite development rates are greater than those predicted by standard models at cool temperatures, and unlike contemporary unimodal thermal performance curves [4], we see no evidence for an increase in EIP at high temperatures.
We acknowledge that malaria transmission is not determined by temperature alone [55, 69–71]. Furthermore, we used long-standing lab colonies of a single mosquito–parasite combination; it is likely that parasite development, vector competence, biting rate, and longevity vary between species and between local populations [7, 57, 62, 72, 73], including the potential for local thermal adaptation [72, 74]. Yet, there is little reason to think that our system is more idiosyncratic than any other local malaria vector-parasite pairing in nature. We also focus on describing the effects of constant temperatures, as this is consistent with nearly all other studies to date. However, our own research has shown that daily variation in temperature can influence mosquito and parasite life history traits above and beyond the effects of mean temperature alone [2, 12, 66]. Future studies would benefit from the inclusion of daily temperature variation, particularly at high and low temperature extremes, as variation is likely to play an important role in defining the upper and lower limits of transmission. Inclusion of variation in biotic factors, such as differences in larval habitat quality, would also be valuable as these can further shape transmission potential [46, 75–77]. Such ecological complexities only strengthen the need for more detailed, system-specific studies of the type presented here in order to fully understand the influence of temperature on transmission and generate more informed predictions of the potential impact of climate change.
Materials and methods
Temperature selection and maintenance
Temperatures were selected to capture key transmission range for P. falciparum [1, 4, 27, 28, 30]. All mosquitoes were housed in secure cardboard cups inside secondary mesh containment cages. Cages were kept in environmentally controlled reach-in incubators at 21°C, 24°C, 27°C, 30°C, 32°C, and 34°C, each ± 0.5°C and 80% ± 5% relative humidity. To ensure incubators were functioning correctly, we placed battery-powered portable USB dataloggers in each incubator. Daily data were extracted at approximately 9:00 am to ensure temperature and humidity were stable throughout the duration of the experiment.
Plasmodium falciparum culture and infection
In vitro cultures of P. falciparum strain NF54 (wild type, Center for Infectious Disease Research, Seattle, Washington) were maintained in RPMI 1640 medium (25 mM HEPES, 2 mM L-glutamine), supplemented with 50 μM hypoxanthine and 10% human A+ serum (Valley Biomedical, Winchester, Virginia). Culture was maintained in an atmosphere of 5% CO2, 5% O2, and 90% N2. Parasite cells were then subcultured into O+ human erythrocytes (Valley Biomedical). Gametocyte initiation occurred at 5% haematocrit and 0.8% to 1.0% mixed-stage parasitemia. The culture was maintained for 17 days and parasite cells were provided fresh media daily.
On the day of the blood meal, gametocyte cultures (approximately 8% gametocytemia for each experimental block) were briefly centrifuged, and the supernatant was removed and discarded. Pelleted erythrocytes were diluted to 40% haematocrit using fresh A+ human serum and O+ human erythrocytes. The mixture was pipetted into glass bell jars fixed with a Parafilm membrane and connected by plastic tubing with continuously flowing water heated to 37°C. Each bell jar was filled with 2 mL of blood culture, which feeds approximately 200 females. Mosquitoes were given 20 minutes to fully engorge, after which the bell jars were removed, as the parasites in culture are no longer viable after 20 minutes. In each cup, >95% of females were observed to have engorged fully. Immediately following the blood meal, mosquitoes were transferred to their respective temperature treatments and maintained by providing cotton balls soaked with 10% glucose and 0.05% para-aminobenzoic acid in water, which were replaced daily.
Parasite development and mosquito survival
An. stephensi Liston adult females were from our laboratory colony (originally derived from a long-standing colony at the Walter Reed Army Institute of Research, Silver Spring, Maryland) maintained at standard insectary conditions (27°C ± 0.5°C, 80% ± 5% relative humidity and a 12:12 photoperiod). Three- to 5-day-old females were aspirated into cardboard cups (475 mL), with approximately 150 per cup. Four cups were allocated to each of the 6 incubators set at the different experimental temperatures (21°C, 24°C, 27°C, 30°C, 32°C, and 34°C), totalling approximately 600 females per temperature. Each cup was provided a human blood meal infected with in vitro cultured P. falciparum strain NF54 (wild type, Center for Infectious Disease Research).
Salivary gland sampling began on day 10 post-blood meal for 21°C and 24°C, day 8 for 27°C, day 6 for 30°C, and day 5 for 32°C and 34°C, based on results from a pilot experiment (S1 Fig). For each sample, 8 to 10 mosquitoes were aspirated from each replicate cup into absolute ethanol and salivary glands were dissected. Glands were ruptured beneath a glass cover slip and examined under a light microscope at 40x for presence of sporozoites.
Dead mosquitoes were counted daily in each cup. For survival analysis, mosquitoes removed for dissections each day and those that remained alive at the end of the experiment (day 25) were considered censored cases. We compared a range of plausible mortality curves including exponential, log-logistic, log-normal, Weibull, and Gompertz distributions for each block x temperature combination individually by using the R package flexsurv and selected the best-fit model using AIC (S7 and S8 Tables).
Gonotrophic cycle length and biting rate
To estimate effects of temperature on the length of the gonotrophic cycle, 3- to 5-day-old females were fed to repletion on a membrane feeder using pork intestine sausage casing filled with human blood heated to 37°C. Fully engorged females (n = 85 per temperature treatment) were then transferred to individual 50 mL plastic tubes covered with mesh and filled with 5.0 mL of distilled water. Each tube was provided a cotton ball moistened with 10% glucose solution that was replenished daily. Daily, tubes were checked for presence of eggs between 9:00 am and 10:00 am. Females in tubes that had laid eggs were then transferred to a clean tube and sugar was withheld for 6 hours, after which these females were offered a second human blood meal on the membrane feeding system (in groups of 5 tubes per feeder, all feeds occurred at 27°C for optimum response).
This allowed for a quantification of the length of time to laying the first and second clutches; the mean of these values was used as gonotrophic cycle length. For females not laying a second clutch, the number of days to laying the first clutch was considered as the mean in the final calculation of mean cycle length. To calculate biting rate, we used the reciprocal of the mean gonotrophic cycle for each temperature. Differences in biting rate were assessed using a Kruskal-Wallis test followed by Dunn’s post-hoc rank sum comparison using the R package pgirmess.
To assess if temperature affected the likelihood of egg laying in general, mating success was also assessed by dissection of spermathecae from females in that had not laid eggs by day 21 post-blood meal. Spermathecae were ruptured under a glass cover slip and observed under a light microscope at 40x magnification. Presence of sperm, whether alive or dead, was considered a successful mating. Data on each individual clutch and mating success can be accessed in the supplementary materials (S12–S14 Tables).
Raw data for survival and infection, R script for statistical analysis, and numerical values for producing each figure can be accessed in the Dryad data repository: http://dx.doi.org/10.5061/dryad.74389 [34].
Supporting information
(TIFF)
(TIF)
Dynamics of survival (purple line) and the proportion of mosquitoes alive and infectious (orange line) for each replicate cup and block in the 30°C treatment used to mathematically analyze the possibility of differential mortality.
(TIF)
Dynamics of survival (purple line) and the proportion of mosquitoes alive and infectious (orange line) for each replicate cup and block in the 32°C treatment used to mathematically analyze the possibility of differential mortality. Replicate cup 4 in experimental block 1 was discarded due to sugar pad being replaced with a water pad after blood feeding, so unusually high mortality due to starvation occurred during the first 24 hours post-blood meal.
(TIF)
Data for proportion of infectious mosquitoes on each day of salivary gland dissections during pilot experiment.
(XLSX)
Results of post-hoc pairwise log-rank statistics across all temperatures, comparing temperatures between block.
(XLSX)
Results of post-hoc pairwise log-rank statistics across both blocks, comparing all temperatures to each other across blocks.
(XLSX)
Results of post-hoc pairwise log-rank statistics across temperature in experimental block 1, comparing all temperatures to each other. Bold italics represent groups not statistically different from each other.
(XLSX)
Results of post-hoc pairwise log-rank statistics across temperature in experimental block 2, comparing all temperatures to each other.
(XLSX)
Results of post-hoc pairwise log-rank statistics across temperature and block, comparing all temperatures to each other between each block. Bold italics represent groups not significantly different from each other.
(XLSX)
Comparison of survival models built using the R package flexsurv using 3 survival distributions (Gompertz, Weibull, and exponential) commonly used in studies of mosquito mortality across block and temperature for 21°C through 27°C. Bolded models represent the best fit model for each block x temperature combination.
(XLSX)
Comparison of survival models built using the R package flexsurvusing 3 survival distributions (Gompertz, Weibull, and exponential) commonly used in studies of mosquito mortality across block and temperature for 30°C through 34°C. Bolded models represent the best fit model for each block x temperature combination.
(XLSX)
Nonlinear exponential models used for each block and temperature combination for instances where a decrease in proportion of infectious mosquitoes was observed. Models represent the description of the curve only for data points past the point of truncation (day of peak proportion of infectious mosquitoes) used for binary logistic models.
(XLSX)
Parameter values (g, k, tm) for best fit model listed for and each block separately. Bolded numbers are predicted values, with 95% confidence intervals in parentheses.
(XLSX)
Predicted values and 95% confidence intervals (in parentheses) for EIP10, EIP50, and EIP90 from the binary logistic regression model for each block and temperature combination as parameterized in S10 Table. EIP, extrinsic incubation period.
(XLSX)
Data for number of females laying the first clutch of eggs and the mean gonotrophic cycle length for each temperature for the first clutch.
(XLSX)
Data for number of females still alive after laying the first clutch of eggs, the number that laid a second clutch of eggs, and the mean gonotrophic cycle length for each temperature for the second clutch of eggs.
(XLSX)
Mating success across each temperature in gonotrophic cycle/biting rate experiment. A successful mating was considered either successful oviposition or the presence of sperm in dissected spermathecae, in the case a female did not lay eggs over the course of the experiment.
(XLSX)
Values for relative vectorial capacity using minimum estimate for EIP (defined here as EIP10, or time to 10% of maximum proportion infectious) and the maximum estimate for EIP (EIP90, or time to 90% of maximum proportion infectious). EIP, extrinsic incubation period.
(XLSX)
Comparison of nonlinear models for performance of traits across temperature for the data presented in this paper and the data used in Mordecai et al. 2013. The R2 refers to our empirical data and the corresponding best fit models.
(XLSX)
Mathematical analysis for the possibility of differential mortality or recovery. Each temperature x block x cup combination was analyzed using a Gompertz distribution with ‘surviving’ and ‘surviving and infectious’ as categorial covariates. Each combination was analyzed beginning at the day of peak prevalence and ending at the day of lowest prevalence. In the instance that two days in a row had the same peak prevalence, analysis began at the second day with the same value. Overlapping hazard rates (signified by “yes”) indicate that it is most likely that the decrease in the proportion of infectious mosquitoes in higher temperatures over time scales with mortality rates.
(XLSX)
(DOCX)
Acknowledgments
We would like to thank members of the Thomas and Read labs for helpful discussion, J. Teeple for insectary management and support, and M. Kennedy for parasite culture and assistance with dissections and parasite scoring.
Abbreviations
- AIC
Aikake information criterion
- EIP
extrinsic incubation period
- rVC
relative vectorial capacity
Data Availability
Data are currently available in the Dryad data repository, under embargo pending acceptance: http://dx.doi.org/10.5061/dryad.74389. Here we include the raw data for survival and infection, along with R script for the statistical analyses, the creation of Figure 2, as well as an Excel workbook that details the numerical values and further details for recapitulating Figures 1-7 along with supplementary Figures 3-5.
Funding Statement
National Science Foundation (grant number GRFP DGE1255832). funded LLMS for her graduate studies, 2013-2016. The funder had no role in study design, data collection and analysis, decision to publish, or preparation of the manuscript. National Institutes of Health (grant number NIH NIAID R01AI110793). The funder had no role in study design, data collection and analysis, decision to publish, or preparation of the manuscript.
References
- 1.Paaijmans KP, Blanford S, Chan BHK, Thomas MB. Warmer temperatures reduce the vectorial capacity of malaria mosquitoes. Biol Lett. 2012;8: 465–8. doi: 10.1098/rsbl.2011.1075 [DOI] [PMC free article] [PubMed] [Google Scholar]
- 2.Paaijmans KP, Blanford S, Bell AS, Blanford JI, Read AF, Thomas MB. Influence of climate on malaria transmission depends on daily temperature variation. Proc Natl Acad Sci U S A. 2010;107: 15135–9. doi: 10.1073/pnas.1006422107 [DOI] [PMC free article] [PubMed] [Google Scholar]
- 3.Okech BA, Gouagna LC, Walczak E, Kabiru EW, Beier JC, Yan G, et al. The development of Plasmodium falciparum in experimentally infected Anopheles gambiae (Diptera: Culicidae) under ambient microhabitat temperature in western Kenya. Acta Trop. 2004;92: 99–108. doi: 10.1016/j.actatropica.2004.06.003 [DOI] [PubMed] [Google Scholar]
- 4.Mordecai EA, Paaijmans KP, Johnson LR, Balzer C, Ben-Horin T, de Moor E, et al. Optimal temperature for malaria transmission is dramatically lower than previously predicted. Ecol Lett. 2013;16: 22–30. doi: 10.1111/ele.12015 [DOI] [PubMed] [Google Scholar]
- 5.Alonso D, Bouma MJ, Pascual M. Epidemic malaria and warmer temperatures in recent decades in an East African highland. Proc R Soc B Biol Sci. 2011;278: 1661–1669. doi: 10.1098/rspb.2010.2020 [DOI] [PMC free article] [PubMed] [Google Scholar]
- 6.Gething PW, Van Boeckel TP, Smith DL, Guerra CA, Patil AP, Snow RW, et al. Modelling the global constraints of temperature on transmission of Plasmodium falciparum and P. vivax. Parasit Vectors. 2011;4: 92 doi: 10.1186/1756-3305-4-92 [DOI] [PMC free article] [PubMed] [Google Scholar]
- 7.Murdock CC, Sternberg ED, Thomas MB. Malaria transmission potential could be reduced with current and future climate change. Sci Rep. 2016;6: 27771 doi: 10.1038/srep27771 [DOI] [PMC free article] [PubMed] [Google Scholar]
- 8.Caminade C, Kovats S, Rocklov J, Tompkins AM, Morse AP, Colón-González FJ. Impact of climate change on global malaria distribution. Proc Natl Acad Sci U S A. 2014;111: 3286–91. doi: 10.1073/pnas.1302089111 [DOI] [PMC free article] [PubMed] [Google Scholar]
- 9.Endo N, Yamana T, Eltahir EAB. Impact of climate change on malaria in Africa: a combined modelling and observational study. Lancet. 2017;389: S7 doi: 10.1016/S0140-6736(17)31119-4 [Google Scholar]
- 10.Wang X, Zhao X-Q. A malaria transmission model with temperature-dependent incubation period. Bull Math Biol. 2017;79: 1155–1182. doi: 10.1007/s11538-017-0276-3 [DOI] [PubMed] [Google Scholar]
- 11.Paaijmans KP, Read AF, Thomas MB. Understanding the link between malaria risk and climate. Proc Natl Acad Sci U S A. 2009;106: 13844–9. doi: 10.1073/pnas.0903423106 [DOI] [PMC free article] [PubMed] [Google Scholar]
- 12.Blanford JI, Blanford S, Crane RG, Mann ME, Paaijmans KP, Schreiber K V, et al. Implications of temperature variation for malaria parasite development across Africa. Sci Rep. 2013;3: 1300 doi: 10.1038/srep01300 [DOI] [PMC free article] [PubMed] [Google Scholar]
- 13.Guerra CA, Gikandi PW, Tatem AJ, Noor AM, Smith DL, Hay SI, et al. The limits and intensity of Plasmodium falciparum transmission: implications for malaria control and elimination worldwide. PLoS Med. 2008;5: e38 doi: 10.1371/journal.pmed.0050038 [DOI] [PMC free article] [PubMed] [Google Scholar]
- 14.Stern DI, Gething PW, Kabaria CW, Temperley WH, Noor AM, Okiro EA, et al. Temperature and malaria trends in highland East Africa. PLoS ONE. 2011;6: e24524 doi: 10.1371/journal.pone.0024524 [DOI] [PMC free article] [PubMed] [Google Scholar]
- 15.Afrane YA, Githeko AK, Yan G. The ecology of Anopheles mosquitoes under climate change: case studies from the effects of deforestation in East African highlands. Ann N Y Acad Sci. 2012;1249: 204–10. doi: 10.1111/j.1749-6632.2011.06432.x [DOI] [PMC free article] [PubMed] [Google Scholar]
- 16.Dhiman RC, Sarkar S. El Niño Southern Oscillation as an early warning tool for malaria outbreaks in India. Malar J. 2017;16: 122 doi: 10.1186/s12936-017-1779-y [DOI] [PMC free article] [PubMed] [Google Scholar]
- 17.Gething PW, Smith DL, Patil AP, Tatem AJ, Snow RW, Hay SI. Climate change and the global malaria recession. Nature. 2010;465: 342–5. doi: 10.1038/nature09098 [DOI] [PMC free article] [PubMed] [Google Scholar]
- 18.Yamana TK, Bomblies A, Eltahir EAB. Climate change unlikely to increase malaria burden in West Africa. Nat Clim Chang. 2016;6: 1009–13.advance on. doi: 10.1038/nclimate3085 [Google Scholar]
- 19.Martens P, Kovats RS, Nijhof S, de Vries P, Livermore MTJ, Bradley DJ, et al. Climate change and future populations at risk of malaria. Glob Environ Chang Policy Dimens. 1999;9: S89–S107. doi: 10.1016/s0959-3780(99)00020-5 [Google Scholar]
- 20.Pascual M, Ahumada JA, Chaves LF, Rodó X, Bouma M. Malaria resurgence in the East African highlands: temperature trends revisited. Proc Natl Acad Sci U S A. 2006;103: 5829–34. doi: 10.1073/pnas.0508929103 [DOI] [PMC free article] [PubMed] [Google Scholar]
- 21.Parham PE, Michael E. Modeling the effects of weather and climate change on malaria transmission. Environ Health Perspect. 2010;118: 620–6. doi: 10.1289/ehp.0901256 [DOI] [PMC free article] [PubMed] [Google Scholar]
- 22.Craig M, Le Sueur D, Snow B. A climate-based distribution model of malaria transmission in sub-Saharan Africa. Parasitol Today. 1999;15: 105–11. doi: 10.1016/S0169-4758(99)01396-4 [DOI] [PubMed] [Google Scholar]
- 23.Caminade C, McIntyre MK, Jones AE. Climate change and vector-borne diseases: Where are we next heading? J Infect Dis. 2016;214: 1300 doi: 10.1093/infdis/jiw368 [DOI] [PubMed] [Google Scholar]
- 24.Peterson AT. Shifting suitability for malaria vectors across Africa with warming climates. BMC Infect Dis. 2009;9: 59 doi: 10.1186/1471-2334-9-59 [DOI] [PMC free article] [PubMed] [Google Scholar]
- 25.Ikemoto T. Tropical malaria does not mean hot environments. J Med Entomol. 2008;45: 963–69. [DOI] [PubMed] [Google Scholar]
- 26.Dawes EJ, Churcher TS, Zhuang S, Sinden RE, Basáñez M-G. Anopheles mortality is both age- and Plasmodium-density dependent: implications for malaria transmission. Malar J. 2009;8: 228 doi: 10.1186/1475-2875-8-228 [DOI] [PMC free article] [PubMed] [Google Scholar]
- 27.Detinova T. Determination of the epidemiological importance of populations of Anopheles maculipennis by their age composition. Monograph Series, World Health Organ. 1962;47: 13–191. [PubMed] [Google Scholar]
- 28.Detinova T. Age-Grouping methods in diptera of medical importance: with special reference to some vectors of malaria. Geneva, Switzerland; 1962. [PubMed] [Google Scholar]
- 29.Boyd MF. Studies on plasmodium vivax. 2. The influence of temperature on the duration of the extrinsic incubation period. Am J Hyg. 1932;12: 851–53. [Google Scholar]
- 30.Nikolaev BP. The influence of temperature on the development of the malaria parasite in the mosquito. Trans Pasteur Inst Leningr. 1935;2: 1–5. [Google Scholar]
- 31.Boyd MF, Stratman-Thomas WK. A note on the transmission of quartan malaria by Anopheles quadrimaculatus. Am J Trop Med Hyg. 1933. s1-13: 265–71. [Google Scholar]
- 32.Knowles R, Basu BC. Laboratory studies on the infectivity of Anopheles stephensi. J Malar Inst India. 1942;5: 1–29. [Google Scholar]
- 33.Basu BC. Laboratory studies on the infectivity of Anopheles annularis. J Malar Inst India. 1943;6: 1–21. [Google Scholar]
- 34.Shapiro LL (2017) Data from: Quantifying the effects of temperature on mosquito and parasite traits that determine the transmission potential of human malaria. Dryad Digital Repository. http://dx.doi.org/10.5061/dryad.74389. [DOI] [PMC free article] [PubMed] [Google Scholar]
- 35.Harrington LC, Buonaccorsi JP, Edman JD, Costero A, Kittayapong P, Clark GG, et al. Analysis of survival of young and old Aedes aegypti (Diptera: Culicidae) from Puerto Rico and Thailand. J Med Entomol. 2001; 537–47. [DOI] [PubMed] [Google Scholar]
- 36.Ryan SJ, Ben-Horin T, Johnson LR. Malaria control and senescence: the importance of accounting for the pace and shape of aging in wild mosquitoes. Ecosphere. 2015;6: 1–13. [Google Scholar]
- 37.Pujol-Lereis LM, Rabossi A, Quesada-Allué LA. Lipid profiles as indicators of functional senescence in the medfly. Exp Gerontol. 2012;47: 465–72. doi: 10.1016/j.exger.2012.04.001 [DOI] [PubMed] [Google Scholar]
- 38.Damos P, Soulopoulou P. Do insect populations die at constant rates as they become older? Contrasting demographic failure kinetics with respect to temperature according to the Weibull model. PLoS ONE. 2015;10: e0127328 doi: 10.1371/journal.pone.0127328 [DOI] [PMC free article] [PubMed] [Google Scholar]
- 39.Bellan SE. The importance of age dependent mortality and the extrinsic incubation period in models of mosquito-borne disease transmission and control. PLoS ONE. 2010;5: e10165 doi: 10.1371/journal.pone.0010165 [DOI] [PMC free article] [PubMed] [Google Scholar]
- 40.Brady OJ, Johansson MA, Guerra CA, Bhatt S, Golding N, Pigott DM, et al. Modelling adult Aedes aegypti and Aedes albopictus survival at different temperatures in laboratory and field settings. Parasit Vectors. 2013;6: 351 doi: 10.1186/1756-3305-6-351 [DOI] [PMC free article] [PubMed] [Google Scholar]
- 41.Srygley RB. Ontogenetic changes in immunity and susceptibility to fungal infection in Mormon crickets (Anabrus simplex). J Insect Physiol.; 2012;58: 342–47. doi: 10.1016/j.jinsphys.2011.12.005 [DOI] [PubMed] [Google Scholar]
- 42.Hurst MRH, Beattie AK, Jones SA, Hsu P-C, Calder J, van Koten C. Galleria mellonella mortality as a result of Yersinia entomophaga infection is temperature-dependent. Appl Environ Microbiol. 2015;81: 6404–14. [DOI] [PMC free article] [PubMed] [Google Scholar]
- 43.Novoseltsev VN, Michalski AI, Novoseltseva JA, Yashin AI, Carey JR, Ellis AM. An age-structured extension to the vectorial capacity model. PLoS ONE. 2012;7: e39479 doi: 10.1371/journal.pone.0039479 [DOI] [PMC free article] [PubMed] [Google Scholar]
- 44.Gompertz B. On the nature of the function expressive of the law of human mortality, and on a new mode of determining the value of life contingencies. Royal Society. Philos Trans R Soc London. 1825;115: 513–83. [DOI] [PMC free article] [PubMed] [Google Scholar]
- 45.Christofferson RC, Mores CN. Estimating the magnitude and direction of altered arbovirus transmission due to viral phenotype. PLoS ONE. 2011;6: e16298 doi: 10.1371/journal.pone.0016298 [DOI] [PMC free article] [PubMed] [Google Scholar]
- 46.Shapiro LLM, Murdock CC, Jacobs GR, Thomas RJ, Thomas MB. Larval food quantity affects the capacity of adult mosquitoes to transmit human malaria. Proc Biol Sci. 2016;283: 20160298 doi: 10.1098/rspb.2016.0298 [DOI] [PMC free article] [PubMed] [Google Scholar]
- 47.Macdonald G. The epidemiology and control of malaria. London: Oxford University Press; 1957. [Google Scholar]
- 48.Dye C. Vectorial capacity: must we measure all its components? Parasitol Today. 1986;2: 203–9. [DOI] [PubMed] [Google Scholar]
- 49.Massad E, Coutinho FAB. Vectorial capacity, basic reproduction number, force of infection and all that: Formal notation to complete and adjust their classical concepts and equations. Mem Inst Oswaldo Cruz. 2012;107: 564–67. doi: 10.1590/S0074-02762012000400022 [DOI] [PubMed] [Google Scholar]
- 50.Smith DL, Battle KE, Hay SI, Barker CM, Scott TW, McKenzie FE. Ross, Macdonald, and a theory for the dynamics and control of mosquito-transmitted pathogens. PLoS Pathog. 2012;8: e1002588 doi: 10.1371/journal.ppat.1002588 [DOI] [PMC free article] [PubMed] [Google Scholar]
- 51.Smith DL, McKenzie FE, Snow RW, Hay SI. Revisiting the basic reproductive number for malaria and its implications for malaria control. PLoS Biol. 2007;5: e42 doi: 10.1371/journal.pbio.0050042 [DOI] [PMC free article] [PubMed] [Google Scholar]
- 52.Garrett-Jones C, Shidrawi GR. Malaria vectorial capacity of a population of Anopheles gambiae: an exercise in epidemiological entomology. Bull World Health Organ. 1969;40: 531–45. [PMC free article] [PubMed] [Google Scholar]
- 53.Garrett-Jones C, Grab B. The assessment of insecticidal impact on the malaria mosquito ‘s vectorial capacity, from data on the proportion of parous females. Bull World Health Organ. 1964;31: 71–86. [PMC free article] [PubMed] [Google Scholar]
- 54.Molineaux L, Shidrawi GR, Clarke J, Boulzaguet J, Ashkar T. Assessment of insecticidal impact on the malaria mosquito’s vectorial capacity, from data on the man-biting rate and age-composition. Bull World Health Organ. 1979;57: 265–74. [PMC free article] [PubMed] [Google Scholar]
- 55.Afrane YA, Little TJ, Lawson BW, Githeko AK, Yan G. Deforestation and vectorial capacity of Anopheles gambiae Giles mosquitoes in malaria transmission, Kenya. Emerg Infect Dis. 2008;14: 1533–8. doi: 10.3201/eid1410.070781 [DOI] [PMC free article] [PubMed] [Google Scholar]
- 56.Gary RE, Foster WA. Effects of available sugar on the reproductive fitness and vectorial capacity of the malaria vector Anopheles gambiae (Diptera: Culicidae) J Med Entomol. 2001;38: 22–28. [DOI] [PubMed] [Google Scholar]
- 57.Lardeux FJ, Tejerina RH, Quispe V, Chavez TK. A physiological time analysis of the duration of the gonotrophic cycle of Anopheles pseudopunctipennis and its implications for malaria transmission in Bolivia. Malar J. 2008;7: 141 doi: 10.1186/1475-2875-7-141 [DOI] [PMC free article] [PubMed] [Google Scholar]
- 58.Scott T, Takken W. Feeding strategies of anthropophilic mosquitoes result in increased risk of pathogen transmission. Trends Parasitol. 2012;28: 114–21. doi: 10.1016/j.pt.2012.01.001 [DOI] [PubMed] [Google Scholar]
- 59.Liu-Helmersson J, Stenlund H, Wilder-Smith A, Rocklöv J. Vectorial capacity of Aedes aegypti: Effects of temperature and implications for global dengue epidemic potential. PLoS ONE. 2014;9: e89783 doi: 10.1371/journal.pone.0089783 [DOI] [PMC free article] [PubMed] [Google Scholar]
- 60.Smith DL, McKenzie FE. Statics and dynamics of malaria infection in Anopheles mosquitoes. Malar J. 2004;3: 13 doi: 10.1186/1475-2875-3-13 [DOI] [PMC free article] [PubMed] [Google Scholar]
- 61.Killeen GF, McKenzie FE, Foy BD, Schieffelin C, Billingsley PF, Beier JC. A simplified model for predicting malaria entomologic inoculation rates based on entomologic and parasitologic parameters relevant to control. Am J Trop Med Hyg. 2000;62: 535–544. [DOI] [PMC free article] [PubMed] [Google Scholar]
- 62.Clements A, Paterson GD. The analysis of mortality and survival rates in wild populations of mosquitoes. J Appl Ecol. 1981;18: 373–399. [Google Scholar]
- 63.Christiansen-Jucht CD, Parham PE, Saddler A, Koella JC, Basáñez M-G. Larval and adult environmental temperatures influence the adult reproductive traits of Anopheles gambiae s.s. Parasit Vectors. Parasit Vectors. 2015;8: 456 doi: 10.1186/s13071-015-1053-5 [DOI] [PMC free article] [PubMed] [Google Scholar]
- 64.Christiansen-Jucht C, Parham PE, Saddler A, Koella JC, Basáñez M-G. Temperature during larval development and adult maintenance influences the survival of Anopheles gambiae s.s. Parasit Vectors. 2014;7: 489 doi: 10.1186/s13071-014-0489-3 [DOI] [PMC free article] [PubMed] [Google Scholar]
- 65.Papadopoulos NT, Carey JR, Ioannou CS, Ji H, Murray D. Seasonality of post-capture longevity in a medically-important mosquito (Culex pipiens). 2016;4: 63 doi: 10.3389/fevo.2016.00063 [Google Scholar]
- 66.Paaijmans KP, Heinig RL, Seliga RA, Blanford JI, Blanford S, Murdock CC, et al. Temperature variation makes ectotherms more sensitive to climate change. Glob Chang Biol. 2013;19: 2373–80. doi: 10.1111/gcb.12240 [DOI] [PMC free article] [PubMed] [Google Scholar]
- 67.Ferguson HM, Read AF. Why is the effect of malaria parasites on mosquito survival still unresolved? Trends Parasitol. 2002;18: 256–61. [DOI] [PubMed] [Google Scholar]
- 68.Brady OJ, Godfray CJ, Tatem AJ, Gething PW, Cohen JM, et al. Vectorial capacity and vector control: reconsidering sensitivity to parameters for malaria elimination. Trans R Soc Trop Med Hyg. 2016;110: 107–117. doi: 10.1093/trstmh/trv113 [DOI] [PMC free article] [PubMed] [Google Scholar]
- 69.Patz JA, Daszak P, Tabor GM, Aguirre AA, Pearl M, Epstein J, et al. Unhealthy landscapes: Policy recommendations on land use change and infectious disease emergence. Environ Health Perspect. 2004;112: 1092–1098. doi: 10.1289/ehp.6877 [DOI] [PMC free article] [PubMed] [Google Scholar]
- 70.Kilpatrick AM, Randolph SE. Drivers, dynamics, and control of emerging vector-borne zoonotic diseases. Lancet. 2012;380: 1946–55. doi: 10.1016/S0140-6736(12)61151-9 [DOI] [PMC free article] [PubMed] [Google Scholar]
- 71.Paaijmans KP, Thomas MB. Health: wealth versus warming. Nat Clim Chang. 2011;1: 349–350. doi: 10.1038/nclimate1234 [Google Scholar]
- 72.Joy DA, Gonzalez-Ceron L, Carlton JM, Gueye A, Fay M, Mccutchan F, et al. Local adaptation and vector-mediated population structure in Plasmodium vivax malaria. Mol. Biol. Evol. 2008;25:1245–52. doi: 10.1093/molbev/msn073 [DOI] [PMC free article] [PubMed] [Google Scholar]
- 73.Russell TL, Lwetoijera DW, Knols BGJ, Takken W, Killeen GF, Ferguson HM. Linking individual phenotype to density-dependent population growth: the influence of body size on the population dynamics of malaria vectors. Proc Biol Sci. 2011;278: 3142–51. doi: 10.1098/rspb.2011.0153 [DOI] [PMC free article] [PubMed] [Google Scholar]
- 74.Sternberg ED, Thomas MB. Local adaptation to temperature and the implications for vector-borne diseases. Trends Parasitol.; 2014;30: 115–122. doi: 10.1016/j.pt.2013.12.010 [DOI] [PubMed] [Google Scholar]
- 75.Moller-Jacobs LL, Murdock CC, Thomas MB. Capacity of mosquitoes to transmit malaria depends on larval environment. Parasit Vectors. 2014;7:593 doi: 10.1186/s13071-014-0593-4 [DOI] [PMC free article] [PubMed] [Google Scholar]
- 76.Lyimo EO, Takken W, Koella JC. Effect of rearing temperature and larval density on larval survival, age at pupation and adult size of Anopheles gambiae. Entomol Exp Appl. 1992;63: 265–271. doi: 10.1111/j.1570-7458.1992.tb01583.x [Google Scholar]
- 77.Takken W, Smallegange RC, Vigneau AJ, Johnston V, Brown M, Mordue-Luntz A, et al. Larval nutrition differentially affects adult fitness and Plasmodium development in the malaria vectors Anopheles gambiae and Anopheles stephensi. Parasit Vectors. 2013;6: 345 doi: 10.1186/1756-3305-6-345 [DOI] [PMC free article] [PubMed] [Google Scholar]
Associated Data
This section collects any data citations, data availability statements, or supplementary materials included in this article.
Supplementary Materials
(TIFF)
(TIF)
Dynamics of survival (purple line) and the proportion of mosquitoes alive and infectious (orange line) for each replicate cup and block in the 30°C treatment used to mathematically analyze the possibility of differential mortality.
(TIF)
Dynamics of survival (purple line) and the proportion of mosquitoes alive and infectious (orange line) for each replicate cup and block in the 32°C treatment used to mathematically analyze the possibility of differential mortality. Replicate cup 4 in experimental block 1 was discarded due to sugar pad being replaced with a water pad after blood feeding, so unusually high mortality due to starvation occurred during the first 24 hours post-blood meal.
(TIF)
Dynamics of survival (purple line) and the proportion of mosquitoes alive and infectious (orange line) for each replicate cup and block in the 32°C treatment used to mathematically analyze the possibility of differential mortality. Replicate cup 4 in experimental block 1 was discarded due to sugar pad being replaced with a water pad after blood feeding, so unusually high mortality due to starvation occurred during the first 24 hours post-blood meal.
(TIF)
Data for proportion of infectious mosquitoes on each day of salivary gland dissections during pilot experiment.
(XLSX)
Results of post-hoc pairwise log-rank statistics across all temperatures, comparing temperatures between block.
(XLSX)
Results of post-hoc pairwise log-rank statistics across both blocks, comparing all temperatures to each other across blocks.
(XLSX)
Results of post-hoc pairwise log-rank statistics across temperature in experimental block 1, comparing all temperatures to each other. Bold italics represent groups not statistically different from each other.
(XLSX)
Results of post-hoc pairwise log-rank statistics across temperature in experimental block 2, comparing all temperatures to each other.
(XLSX)
Results of post-hoc pairwise log-rank statistics across temperature and block, comparing all temperatures to each other between each block. Bold italics represent groups not significantly different from each other.
(XLSX)
Comparison of survival models built using the R package flexsurv using 3 survival distributions (Gompertz, Weibull, and exponential) commonly used in studies of mosquito mortality across block and temperature for 21°C through 27°C. Bolded models represent the best fit model for each block x temperature combination.
(XLSX)
Comparison of survival models built using the R package flexsurvusing 3 survival distributions (Gompertz, Weibull, and exponential) commonly used in studies of mosquito mortality across block and temperature for 30°C through 34°C. Bolded models represent the best fit model for each block x temperature combination.
(XLSX)
Nonlinear exponential models used for each block and temperature combination for instances where a decrease in proportion of infectious mosquitoes was observed. Models represent the description of the curve only for data points past the point of truncation (day of peak proportion of infectious mosquitoes) used for binary logistic models.
(XLSX)
Parameter values (g, k, tm) for best fit model listed for and each block separately. Bolded numbers are predicted values, with 95% confidence intervals in parentheses.
(XLSX)
Predicted values and 95% confidence intervals (in parentheses) for EIP10, EIP50, and EIP90 from the binary logistic regression model for each block and temperature combination as parameterized in S10 Table. EIP, extrinsic incubation period.
(XLSX)
Data for number of females laying the first clutch of eggs and the mean gonotrophic cycle length for each temperature for the first clutch.
(XLSX)
Data for number of females still alive after laying the first clutch of eggs, the number that laid a second clutch of eggs, and the mean gonotrophic cycle length for each temperature for the second clutch of eggs.
(XLSX)
Mating success across each temperature in gonotrophic cycle/biting rate experiment. A successful mating was considered either successful oviposition or the presence of sperm in dissected spermathecae, in the case a female did not lay eggs over the course of the experiment.
(XLSX)
Values for relative vectorial capacity using minimum estimate for EIP (defined here as EIP10, or time to 10% of maximum proportion infectious) and the maximum estimate for EIP (EIP90, or time to 90% of maximum proportion infectious). EIP, extrinsic incubation period.
(XLSX)
Comparison of nonlinear models for performance of traits across temperature for the data presented in this paper and the data used in Mordecai et al. 2013. The R2 refers to our empirical data and the corresponding best fit models.
(XLSX)
Mathematical analysis for the possibility of differential mortality or recovery. Each temperature x block x cup combination was analyzed using a Gompertz distribution with ‘surviving’ and ‘surviving and infectious’ as categorial covariates. Each combination was analyzed beginning at the day of peak prevalence and ending at the day of lowest prevalence. In the instance that two days in a row had the same peak prevalence, analysis began at the second day with the same value. Overlapping hazard rates (signified by “yes”) indicate that it is most likely that the decrease in the proportion of infectious mosquitoes in higher temperatures over time scales with mortality rates.
(XLSX)
(DOCX)
Data Availability Statement
Data are currently available in the Dryad data repository, under embargo pending acceptance: http://dx.doi.org/10.5061/dryad.74389. Here we include the raw data for survival and infection, along with R script for the statistical analyses, the creation of Figure 2, as well as an Excel workbook that details the numerical values and further details for recapitulating Figures 1-7 along with supplementary Figures 3-5.