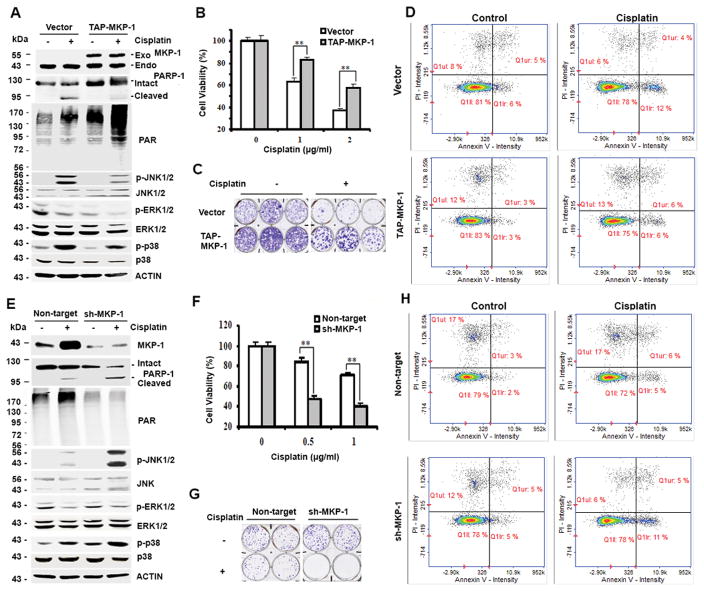
Figure 1. MKP-1 confers cisplatin resistance and MKP-1 levels correlate with PARP-1 and PAR levels in ovarian cancer cells.
(A) Immunoblot analyses of the amounts of the indicated proteins in TOV112D cells stably overexpressing pNTAP-MKP-1 (TAP-MKP-1) or pNTAP (vector) exposed to 2 μg/mL cisplatin for 24 hr. Exo-MKP-1, exogenous (transfected) MKP-1; Endo-MKP-1, endogenous MKP-1. (B) MTT analyses of cell viability of TOV112D cells treated with cisplatin for 4 days. Data represent mean ± S.D. (error bars) of three independent experiments. **, p < 0.001, statistically significant. (C) Representative results of colony formation assays of three independent experiments. Cells in (A) were treated with 0.5 μg/ml cisplatin. (D) Analyses of apoptosis. Cells in (A) were harvested after treatment with 2 μg/mL cisplatin for 16 hr and stained with Annexin V and Propidium Iodide (PI). Numbers in right two quadrants refer to the percent Annexin+/PI− and Annexin+/PI+ (apoptotic) cells in this representative experiment. (E) Immunoblot analyses of the amounts of the indicated proteins in MKP-1 silenced CAOV3 cells (sh-MKP-1) and control non-target CAOV3 cells (Non-target) after treatment with 1 μg/mL cisplatin for 24 hr. (F) MTT analyses of cell viability after 72-hr treatment. (G) Colony formation assay of cells in (E) after treatment with 1 μg/ml cisplatin. (H) Analyses of apoptosis. Cells in (E) were left untreated or exposed to cisplatin and analyzed as described in (D).

