Abstract
Dual spectral computed tomography (DSCT) has a superior material distinguishability than the conventional single spectral computed tomography (SSCT). However, the decomposition process is an illposed problem, which is sensitive to noise. Thus, the decomposed image quality is degraded, and the corresponding signal-to-noise ratio (SNR) is much lower than that of directly reconstructed image of SSCT. In this work, we establish a locally linear relationship between the decomposed results of DSCT and SSCT. Based on this constraint, we propose an optimization model for DSCT and develop an iterative method with image guided filtering. To further improve the image quality, we employ a preprocessing method based on the relative total variation (RTV) regularization. Both numerical simulations and real experiments are performed, and the results confirm the effectiveness of our proposed approach.
Keywords: locally linear constraint, optimization model, image guided filtering, dual spectral computed tomography
1. Introduction
In X-ray dual spectral computed tomography (DSCT), also known as dual energy computed tomography (DECT), a specimen is scanned with two different X-ray energy spectra. The collected polychromatic projections from this procedure are utilized to perform energy- and material-selective reconstructions (Alvarez and Macovski, 1976, Alvarez and Seppi, 1979, Kalender et al., 1986, Vetter et al., 1986, Kalender et al., 1988, Chuang and Huang, 1988). Compared with the conventional single spectral computed tomography (SSCT), DSCT has a superior material distinguishability. Therefore, it has wide potential applications in both medical and industrial fields, such as bone mineral density and liver iron concentrations measurements, beam-hardening correction and contrast enhancement of soft tissue, positron emission tomography (PET) attenuation correction, calculation of pseudo-monochromatic images, and so forth (Coleman and Sinclair, 1985, Fessler et al., 2002, Zhang et al., 2006, Kinahan et al., 2006, Ying et al., 2006, Zhang et al., 2008, Noh et al., 2009, Johnson et al., 2011).
The existing methods to perform decomposition of DSCT can be classified into three groups: image based methods, projection based methods, and iterative methods. Image based methods treat the projection data sets of different spectra as being independent until the images are reconstructed. Then, images from both spectra are linearly combined to obtain two decomposed images (Maaβ et al., 2009a). Some filter-based modifications are proposed by employing the conventional low-pass filter (Rutherford et al., 1976, Johns and Yaffe, 1985), structural filter or statistical prior based filter (Kalender et al., 1988, Warp and Dobbins, 2003, Zeng et al., 2016b). These upgraded methods can somewhat further suppress the noise. However, the improvement of decomposition accuracy is still limited. Because such methods fail to describe the real nonlinearity relationship between the decomposed results and polychromatic projections, the decomposition results will suffer from artifacts (Brooks and Di Chiro, Coleman and Sinclair, 1985). Projection based methods treat the available information by passing the projection data through a high order decomposition function, followed by image reconstruction (Flohr et al., 2006, Stenner et al., 2007). Generally speaking, they can obtain better decomposition results than image based ones. However, the combination of polychromatic projections requires satisfying a geometrical consistency. Several iterative methods are proposed based on statistical models and nonlinear optimizations (Elbakri and Fessler, 2002, Xu et al., 2009, Maaβ et al., 2009b, Niu et al., 2014, Zeng et al., 2016b, Zhang et al., 2017, Zhang et al., 2014). By introducing prior knowledge or establishing an approximate model, these methods improve the decomposed image quality effectively. However, their convergence rates are slow and their computational costs are high. Recently, an extended algebraic reconstruction technique (E-ART) for DSCT was proposed by Zhao et al. (Zhao et al., 2015). It models the DSCT reconstruction as a nonlinear system and extends the classic ART method to solve the model iteratively. While it can produce high quality decompositions, the computational costs are high, too. In 2016, Hu et al. extended the E-ART method into an simultaneous version, i.e. E-SART (Hu et al., 2016). This method is based on the matrix inversion and has a high degree of parallelism. Thus, the convergence speed of its parallel implementation is improved dramatically. However, the illposedness of the decomposition process renders it noticeably sensitive to noise, resulting in reduced signal-to-noise ratio (SNR).
Although the SSCT has weaker capability for material distinguishing, the achieved SNR is dramatically higher than that of DSCT. Moreover, there is an interesting relationship, i.e., the decomposed results of DSCT can be viewed as modifications of reconstructed images of SSCT by removing some components and adjusting gray values. Furthermore, this structure-based feature can be mathematically described as a locally linear relationship. By incorporating this constraint into an optimization model, the reconstructed image of SSCT could work as a reference to effectively improve the smoothness of DSCT decomposed results. Motivated by the aforementioned facts, we will develop an iterative method to improve the image quality of material decomposition, and the image guided filtering technique (He et al., 2010, He et al., 2013) will also be utilized.
When using the locally linear relationship, the SSCT images are employed as guidance to introduce both structural knowledge and smoothness constraint. This means their image quality plays a crucial role, i.e., any merit and fault will affect the final results of DSCT. Thus, we develop an additional preprocessing step to further improve the image quality of SSCT. The purpose of this preprocessing step lies in two aspects: well keeping all the structures and suppressing the noise. In the field of digital image processing, many methods can be used to achieve this goal, such as regularization based methods (Tikhonov et al., 1977, Rudin and Osher, 1994, Rudin et al., 1992), transform domain filtering methods (Ghael et al., 1997, Mallat, 1999), statistical methods (Deledalle et al., 2009, Besag, 1986), local filtering methods (Buades et al., 2005, Goossens et al., 2008), and so forth. However, in our problem, there are some specific characteristics: strong edges (between different materials) and weak edges (between similar materials) exist simultaneously. Particularly, the weak edges may have the same amplitude with noise. Thus, many methods fail to keep these fine structures. By analyzing the features of weak edges, we find they can be well described by a locally statistical property, i.e., windowed inherent variation. The relative total variation (RTV) for extracting structure from texture (Xu et al., 2012) is extended for weak edge detection in this paper. Thus, by using the preprocessed SSCT image as a good reference, the SNR of decomposed results is further increased.
The remainder of this paper is organized as follows. In section 2, the mathematical model of DSCT is presented, and the E-SART method, image guided filtering technique and RTV regularization are briefly reviewed. In section 3, we present the locally linear constraint based optimization model for DSCT and develop an iterative method with image guided filtering. We also present a RTV based preprocessing method for SSCT. In section 4, both numerical simulations and real experiments are performed to verify the effectiveness of the proposed methods. In last section, we discuss some related issues and conclude this paper.
2. Theory
In this section, we first present the mathematical models of SSCT and DSCT. Then, we briefly review the E-SART method, image guided filtering and RTV as preliminaries for next section.
2.1. Mathematical model
In the conventional SSCT, by considering the facts that X-ray spectrum is polychromatic and scattering is negligible, we describe the physical process as follow,
| (1) |
where μ(E, x) is the linear attenuation coefficient of a specimen at a spatial position x and energy E, ℘(·) represents the ray transform which is a linear operator, S(E) is the normalized emission spectrum, and P represents the acquired information frequently named projection data. Based on the model (1), images can be directly reconstructed,
where f represents a reconstructed image, and ℘−1(·) is the inverse operator of ℘(·), i.e., ℘−1 ∘ ℘ = ℐ, where ℐ stands for the identity transform. It is obvious that f is an approximation of μ(E, x) when X-ray obeys a polychromatic distribution, and the case of equivalence occurs only under an ideal condition that X-ray is monochromatic. Thus, the SSCT usually suffers from a weak capability of distinguishing specific materials and beam-hardening artifacts.
In DSCT, two projection data sets are acquired under different X-ray spectra. Assuming that the collected raw data sets are geometrically consistent, we modify (1) into a DSCT version,
| (2) |
where k is the index of spectrum, and l ∈ ℒ represents an X-ray path. For DSCT, μ(E, x) is usually considered splittable with respect to variables E and x,
| (3) |
where ψi(E) is a function of energy and gi(x) is a function of position. There are two commonly physical explanations for (3): basis material based decomposition and effect based decomposition. For the former, ψi(E) is the mass attenuation coefficient for material i, and gi(x) is the correlative density distribution. For the latter, ψ1(E) = E−3 and ψ2(E) = KN(E) (Klein-Nishina function) correspond to the photoelectric effect and Compton scattering, respectively, and gi(x) represents the correlative effect distribution. The aim of DSCT is to reconstruct images of distribution functions gi(x), i = 1, 2, for specific materials or effects. Thus, it can reveal superior distinguishability and enhanced contrast.
2.2. E-SART method
By substituting (3) into (2) and discretizing the correlative result, we get
| (4) |
where Jk is the energy bin number of spectrum k, ΔE represents the bin length, Sk,j and ψi,j are the samplings of Sk(E) and ψi(E) within bin j, and gi is a one dimensional column vector representing the discretized distribution function. The 1st order Taylor expansion of (4) at point (g1(n); g2(n)) is
| (5) |
where n indicates the current iteration step and
By solving the system of linear equation (5), for k=1,2, we can get the projection of distribution function in an iteration form,
where
By using the conventional Simultaneous Algebraic Reconstruction Technique (SART), distribution function g1 and g2 are updated iteratively.
Comparing with the E-ART, the parallel implementation of E-SART improves the convergence speed dramatically. However, the illposedness of the inverse problem renders this matrix inversion based decomposition process sensitive to inevitable systematic noise. Thus, some prior knowledge or constraints are needed to improve the robustness against noise.
2.3. Image guided filtering
Guided filter (He et al., 2010, He et al., 2013) is edge-preserving with a great variety of applications, of which the key assumption is a locally linear model between a reference image f and the filtering output g*,
| (6) |
where ωk is a window centered at pixel k, and (ak, bk) are constant coefficients in ωk. Let us model the output g* as the input g to remove some unwanted noise or textures t:
By minimizing the difference between g* and g within a window ωk while maintaining the linear model (6), a correlative optimization model is established as follow,
where ε is a regularization parameter penalizing large ak. The solution given by (He et al., 2013) reads,
where f̄k and are the mean and variance of f in ωk, |ω| is the number of pixels in ωk, and ḡk is the mean of g in ωk. The filtering output g* can be computed by employing eq. (6). Because a pixel i is involved in all the covered windows, by averaging all the possible output values, we get
Here āi and b̄i are the average coefficients of all windows covering the pixel i. By using the image guided filtering, the input g is refined by the reference image f based on the locally linear relationship between them.
2.4. Relative total variation
Relative total variation (RTV), a local variation measure, is proposed by Xu et al. to accomplish texture removal (Xu et al., 2012). Its performance is superior to total variation when both structural edges and texture have strong contrast. As an anisotropic regularization term, it computes the ratio of windowed total variation (𝒟d(·)) to windowed inherent variation (ℐd(·)) in each direction (d ∈ {x, y})
| (7) |
where κ is a small positive number to avoid division by zero, and
where ∇ represents the gradient operator, ωk is a window centered at pixel k, wi,k is a weighting function based on spatial affinity, and δ controls the spatial scale of the window. By employing the windowed inherent variation, structural edges and texture are distinguished in light of local statistical property. Although total variation regularization has limited ability to distinguish strong structural edges and textures, the introduction of windowed inherent variation as a reweighting overcomes this defect effectively.
3. Methods
In this section, we first propose a locally linear constraint based optimization model for DSCT and develop an iterative method with SSCT image guided filtering. Then, we extend the RTV to weak edge detection and incorporate it into the SSCT reconstruction to improve the quality of guided images.
3.1. Locally linear constraint based optimization model
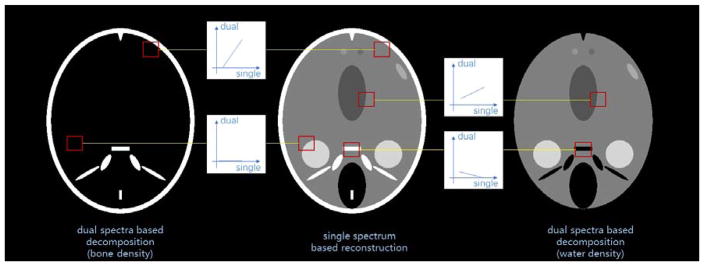
Although the directly reconstructed images of SSCT have a weak capability to distinguish materials, their quality is significantly better than the decomposed results of DSCT, especially when the noise level is relatively high. Moreover, there are structure-based relationships between them. An intuitionist character is that the decomposed results of DSCT can be viewed as modifications of reconstructed images of SSCT by removing some components and adjusting gray values. When analyzing this feature in detail, as is illustrated in Fig. 1, we find that a linear relationship usually holds in small patches. Its discrete version reads,
Figure 1.
Illustration of the locally linear relationship. Image directly reconstructed from single spectrum is shown in the middle column, dual spectra based decomposed results are shown in the left (bone density) and the right (water density) columns.
where f represents a decomposed result of DSCT, g represents a reconstructed image of SSCT, and j and k are pixel indexes.
Based on this constraint, we propose an optimization model for DSCT as follows,
| (8) |
where gfi is a selected result of SSCT corresponding to fi; ξi and εi are regularization parameters.
In model (8), for each searched-for decomposed result, we employ a correlative locally linear constraint. Thus, the smoothness knowledge from SSCT is effectively incorporated into the decomposition process. By weakening the illposedness, the noise is noticeably suppressed, and the SNR is dramatically improved.
3.2. Iterative decomposition algorithm for DSCT
Considering the facts that the data term is measured in projection domain and the regularized terms are measured in image domain, we split model (8) into two sub-optimization problems and develop an iterative scheme as follows,
| (9a) |
| (10b) |
| (11c) |
| (12d) |
| (13e) |
| (14f) |
where (9c)–(9f) are implemented for i = 1, 2, respectively. We use the E-SART method for (9a) and (9b), and the image guided filtering for (9c)–(9f).
3.3. Preprocessing method
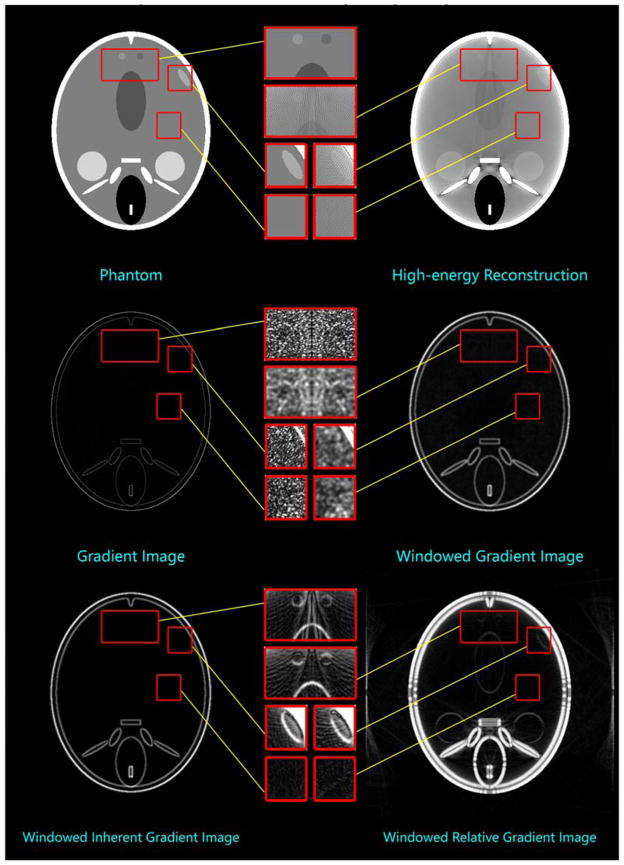
In the proposed method, the SSCT images are employed to guide the decomposition process. Thus, both the useful structural knowledge and smoothness constraint and harmful artifacts and flaws would be introduced to the decomposed results simultaneously. To further improve the image quality of DSCT, a preprocessing method is desired for SSCT. However, different from the general denoising issue of natural images, there are some specific features in our target medical images: strong edges (between different materials) and weak edges (between similar materials) exist simultaneously. Particularly, the weak edges may have the same amplitude with noise. As illustrated in Fig. 2, the phantom contains some low-contrast water-like materials, which can only be distinguished within a narrow display window (e.g. [1.035, 1.065]). In this setting, the directly reconstructed image with high-energy spectrum suffers from noticeable noise, and some fine structures are submerged. Moreover, from the second row of Fig. 2, one can see that both gradient and windowed gradient images fail to detect these weak edges. Many other methods (e.g. TV minimization) cannot work well in this case, either. However, such fine features have a local statistical property. By employing windowed inherent variation, these weak edges can be distinguished successfully within a narrow display window (see the left image of Fig. 2 in the bottom row). To further enhance this property, we employ windowed inherent variation as a weight for windowed gradient images. In this way, the measurement of weak edges is more effective (see the right image of Fig. 2 in the bottom row).
Figure 2.
Comparison of weak edge detection.
This weak edge detection task can be achieved by using RTV regularization (7), which is proposed for structure extraction from texture (Xu et al., 2012). Thus, we can incorporate this constraint into an optimization model for SSCT as follow,
| (15) |
Based on the proximal forward-backward splitting algorithm (Combettes and Wajs, 2005, Zeng et al., 2016a, Zhang and Yu, 2016), we split model (10) into the following two sub-problems and optimize them alternatively,
| (16a) |
| (17b) |
where (11a) can be solved by the conventional reconstruction methods and the solution of (11b) was given in (Xu et al., 2012).
4. Results
To verify the effectiveness of the proposed method, experiments are performed with both simulated and real data sets. In the numerical simulations, we employ two phantoms to mimic different body components, i.e., head and thorax. For each phantom, both noise-free and noisy cases are considered, and the fan-beam geometry is assumed for simplicity. In real experiments, both basis material and effect based decompositions are implemented. For all the experiments, the preprocessed high-energy SSCT images are chosen as the references and employed in the proposed methods (see the bottom row of Fig. 3(C)). As comparisons, we also implement the image-based method, empirical dual energy calibration (EDEC) method (Stenner et al., 2007), nonlocal means filter based (NLM) method (Zeng et al., 2016b), weighted least square and nonlocal means based (WLS-NLM) method (Zhang et al., 2017), material decomposition from inconsistent rays (MDIR) (Maaβ et al., 2009b), and E-SART method (Zhao et al., 2015, Hu et al., 2016), covering all the decomposition categories and including both conventional and state-of-the-art methods. The corresponding descriptions and comparisons are summarized in Table 1. For all the methods, we use the MATLAB GPU based parallel implementation to accelerate the computation. The computer configuration is single GPU of GeForce GTX TITAN X by NVIDIA (Santa Clara, CA, USA), 12 CPUs of Intel(R) Core(TM) i7-4930K CPU @ 3.40GHz, and 64.0 GB RAM. And the iteration number is fixed to 6 for all the aforementioned iterative methods.
Figure 3.
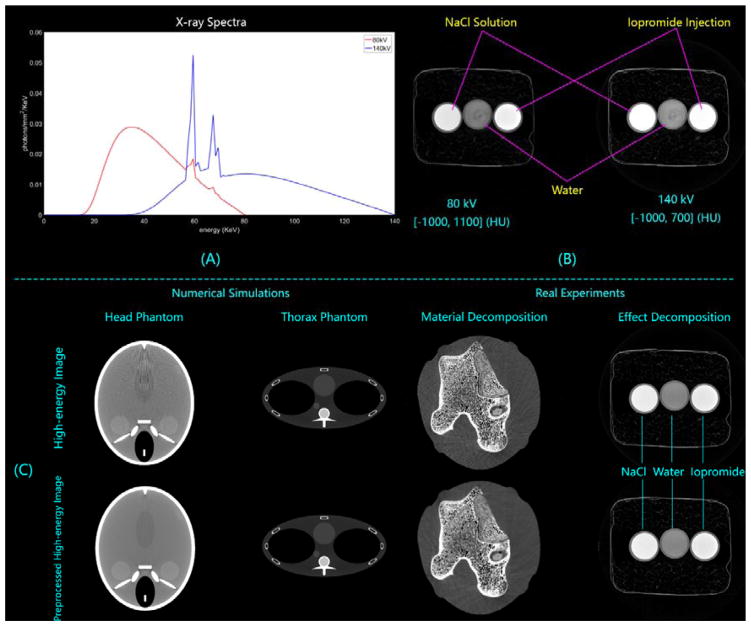
Experimental setting in numerical simulations and real experiments. (A) The X-ray spectra used in the numerical simulations. (B) SSCT images of solution specimen scanned with different voltages (80 kV and 140 kV). The specimen consists of three different solutions (NaCl solution with NaCl density of 1.33g/ml, pure water, and Iopromide solution with Iopromide density of 0.04 g/ml), where the NaCl solution and the Iopromide solution fail to be distinguished in both results. (C) High-energy SSCT images without/with preprocess, where the results in the bottom row are employed as references in the proposed method.
Table 1.
Rational comparisons of all the employed methods in our experiments.
| Name | Category | Description | Characteristic | |||
|---|---|---|---|---|---|---|
| image based | projection based | iterative | nonlinearity data term | smoothness term | ||
| Image-based | ✓ | water pre-correction, FBP reconstruction, and linear decomposition | ||||
| EDEC | ✓ | empirical calibration based polynomial decomposition and FBP reconstruction | ✓ | |||
| NLM | ✓ | water pre-correction, FBP reconstruction, nonlocal mean based smoothness, and linear decomposition | ✓ | |||
| WLS-NLM | ✓ | statistical noise property based optimization model with nonlocal mean smoothness regularization | ✓ | |||
| MDIR | ✓ | polychromatic forward projection model based iterative difference compensation method for image-based decomposition | ✓ | |||
| E-SART | ✓ | linearly approximated solution for polychromatic forward projection model | ✓ | |||
| Proposed | ✓ | polychromatic forward projection model with local linear constraint | ✓ | ✓ | ||
4.1. Numerical simulations
Two 2D phantoms are employed to mimic different body structures in simulated experiments. They are respectively the FORBILD head phantom without ears and the FORBILD thorax phantom (Lauritsch and Bruder, 2012, Sourbelle, 2015). For both cases, the employed basis materials, spectra, and scan setting are the same. Water and bone are chosen as two basis materials, and the corresponding mass attenuation coefficients at different energies are retrieved from the National Institute of Standard Technology (NIST) tables (Hubbell and Seltzer, 1995). A polychromatic spectrum of a GE Maxiray 125 X-ray tube is simulated by using an open source X-ray spectra simulator, SpectrumGUI (SpectrumGUI, 2014)(SpectrumGUI, 2014)(SpectrumGUI, 2014)(SpectrumGUI, 2014)(SpectrumGUI, 2014). Two tube voltages, 80 kV and 140 kV, are chosen, where the latter is filtered with 1.0 mm copper. The corresponding spectra are shown in Fig. 3(A). The detector consists of 1024 channels and each has a length of 0.3 mm. The source-object distance (SOD) is 1000 mm and the source-detector distance (SDD) is 1200 mm. With this configuration, projection data are uniformly collected from 720 views, and 1024 × 1024 images are reconstructed with a pixel size of 0.249 × 0.249mm2.
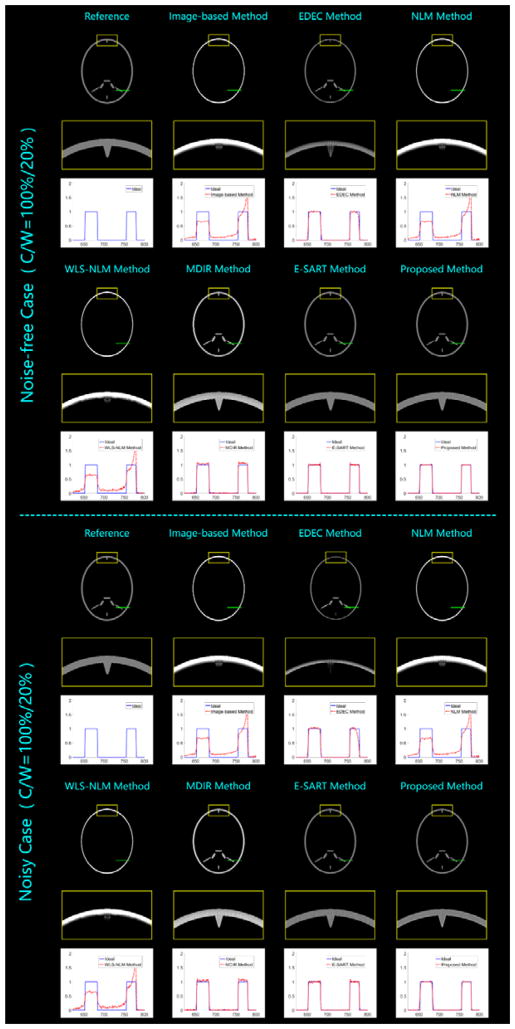
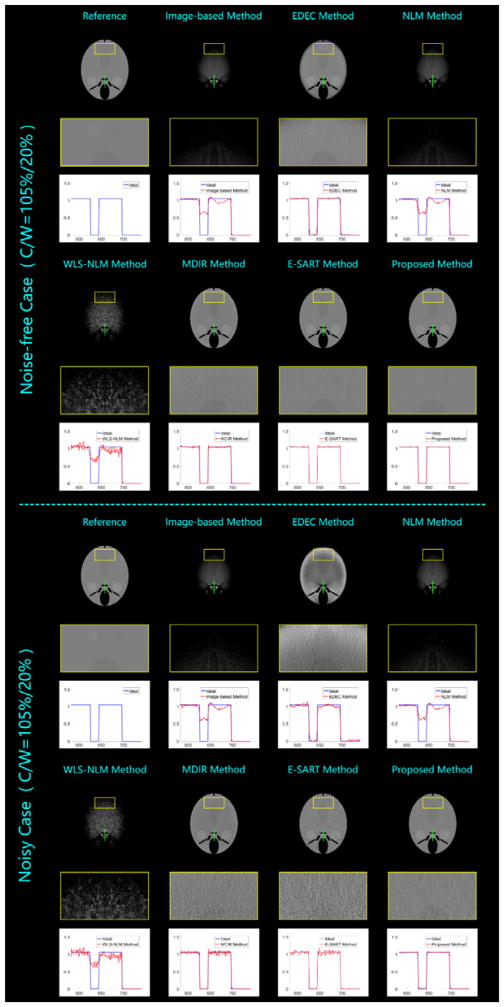
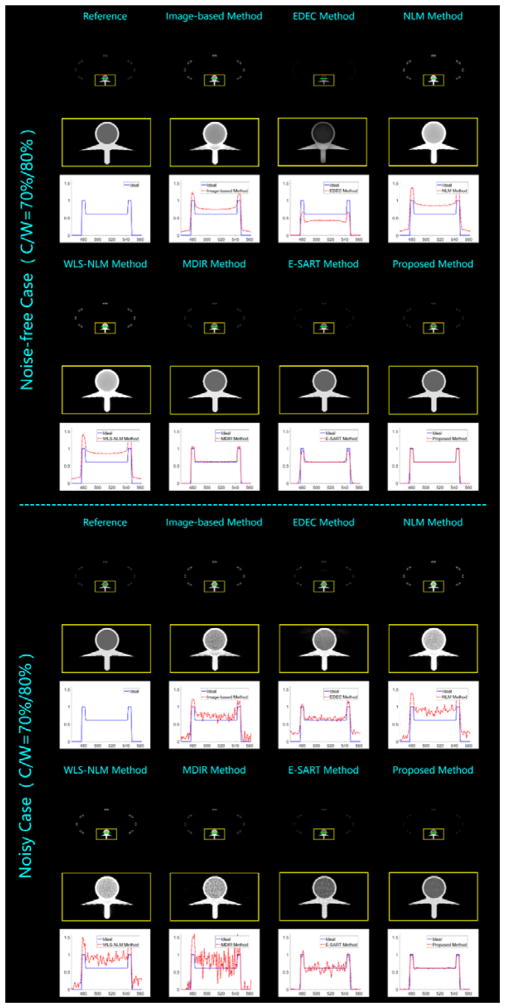
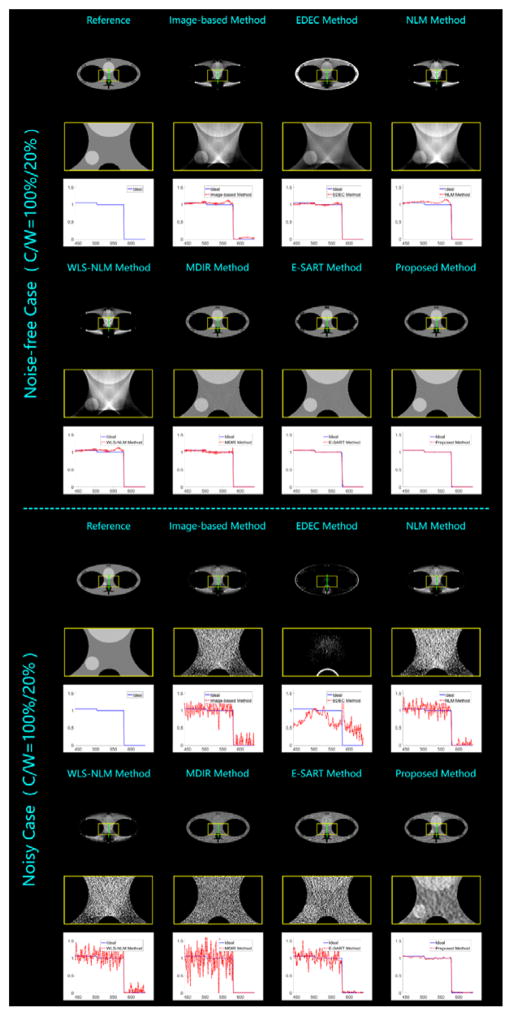
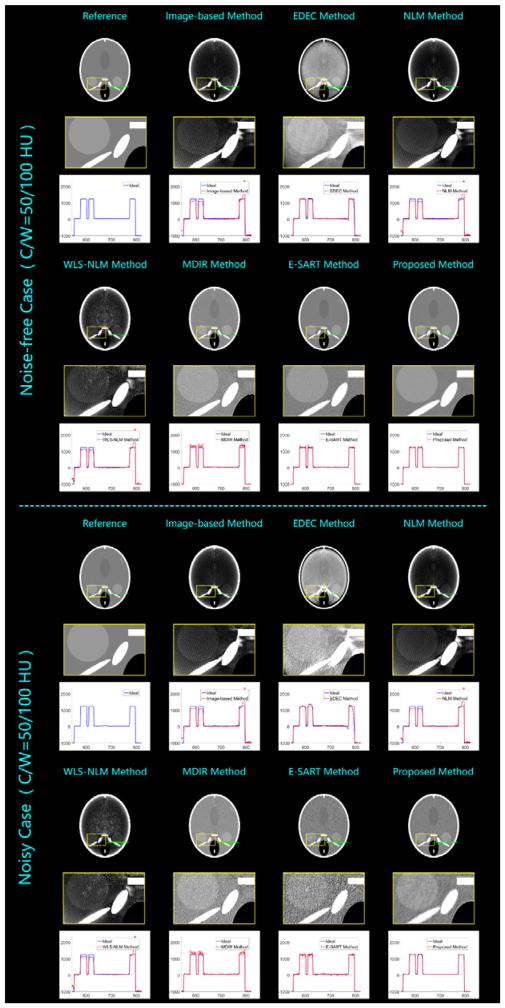
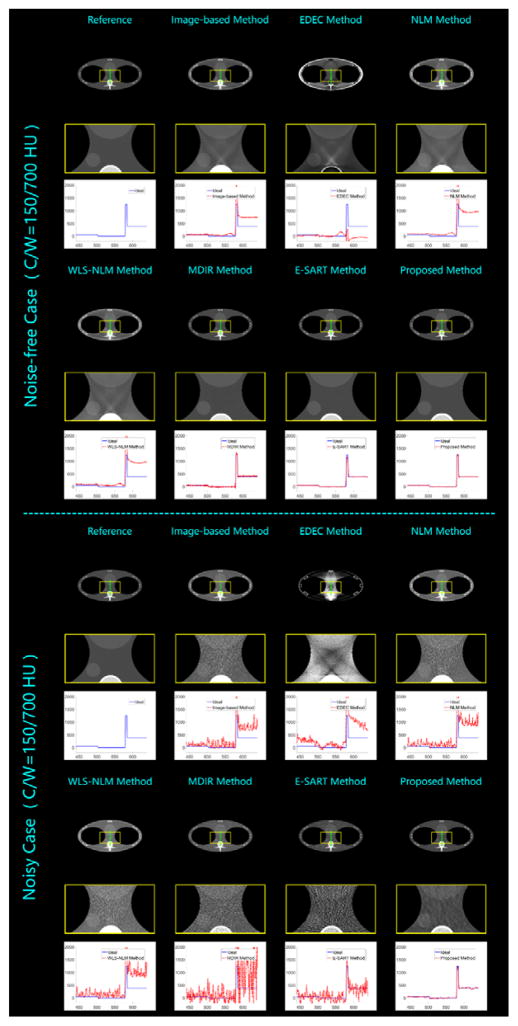
Under this setting, we test both the noise-free and noisy cases for each phantom, where all the methods listed in table 1 are employed. The emitted photon number is 5 × 10⁶ for head phantom based noisy simulation, and 105 for thorax phantom based noisy simulation, respectively. Here more photons are used in the head phantom studies to improve the distinguishability between ultra-low-contrast tissues. The parameters of the proposed method are summarized in Table 2, where the employed parameters are the same for both basis materials. The decomposition results of bone density percentage and water density percentage images are shown in Figs. 4 and 5 for the head based simulations, and shown in Figs. 7 and 8 for the thorax based ones. We synthesize and illustrate the corresponding pseudo-monochromatic μ– images at 70 KeV as well (Hu et al., 2014, Zhao et al., 2015), seen Figs. 6 and 9. For all the results, we present some zoom-in patches (inside yellow boxes) and profiles (marked with green lines) to compare local details. Moreover, three quantitative image quality measures are employed, i.e., peak signal-to-noise ratio (PSNR) (Huynh-Thu and Ghanbari, 2008), normal mean absolute deviation (NMAD) (Zhu et al., 2012) and structural similarity (SSIM) (Wang et al., 2004). Here the selected phantom is segmented by the threshold method to generate reference images of bone density percentage and water density percentage. Then, these two images are employed to synthesize a reference pseudo-monochromatic μ– image at 70 KeV. All the measurements are implemented on the images transformed into a display window according to the piecewise-linear intensity level. In this way, low-contrast water-like materials achieve enhanced gray variation and contributes more percentage in the evaluations. The corresponding results are summarized in Tables 3–6. In terms of SSIM, the evaluations of bone density percentage images are higher than that of corresponding 70 KeV μ–images, because each measure here is implemented in the current display window. Thus, the gray variation of low-contrast water-like materials is enhanced in the synthesized images, which makes more contributions to the evaluation. Otherwise, the strong difference between different materials will submerge the low amplitude variance between similar materials, then reduce the significance of μ–image based evaluations.
Table 2.
Parameters of the proposed method in numerical simulations.
| ξ | ω | ε | ||
|---|---|---|---|---|
| Head phantom | Noise-free case | 0.625 | 3 × 3 | 10−8 |
| Noisy case | 1.67 | 5 × 5 | 10−8 | |
| Thorax Phantom | Noise-free case | 1.67 | 3 × 3 | 10−8 |
| Noisy case | 3.33 | 5 × 5 | 10−6 | |
Figure 4.
Decomposed bone density percentage results from the head phantom studies.
Figure 5.
Decomposed water density percentage results from the head phantom studies.
Figure 7.
Decomposed bone density percentage results from the thorax phantom studies.
Figure 8.
Decomposed water density percentage results from the thorax phantom studies.
Figure 6.
Synthesized 70 KeV μ–images from the head phantom studies.
Figure 9.
Synthesized 70 KeV μ–images from the thorax phantom studies.
Table 3.
Quantitative evaluation results of the head phantom studies with noise-free projections.
| PSNR | NMAD | SSIM | ||
|---|---|---|---|---|
| Bone percentage | Image-based Method | 19.48 | 0.8836 | 0.9363 |
| EDEC Method | 24.73 | 0.3482 | 0.9372 | |
| NLM Method | 19.63 | 0.8681 | 0.9388 | |
| WLS-NLM Method | 19.52 | 0.8836 | 0.9378 | |
| MDIR Method | 23.92 | 0.4975 | 0.9531 | |
| E-SART Method | 29.80 | 0.1865 | 0.9565 | |
| Proposed Method | 32.54 | 0.0806 | 0.9833 | |
| Water density | Image-based Method | 11.99 | 0.8412 | 0.6795 |
| EDEC Method | 24.17 | 0.1406 | 0.7324 | |
| NLM Method | 11.98 | 0.8426 | 0.6781 | |
| WLS-NLM Method | 12.11 | 0.8067 | 0.6517 | |
| MDIR Method | 26.75 | 0.1114 | 0.7292 | |
| E-SART Method | 27.54 | 0.1009 | 0.7419 | |
| Proposed Method | 32.85 | 0.0259 | 0.9473 | |
| 70 KeV μ–image | Image-based Method | 13.32 | 0.5146 | 0.6520 |
| EDEC Method | 17.95 | 0.2498 | 0.6716 | |
| NLM Method | 13.36 | 0.5190 | 0.6615 | |
| WLS-NLM Method | 13.41 | 0.5070 | 0.6539 | |
| MDIR Method | 21.85 | 0.1607 | 0.6820 | |
| E-SART Method | 22.77 | 0.1459 | 0.6891 | |
| Proposed Method | 30.21 | 0.0349 | 0.8824 | |
Table 6.
Quantitative evaluation results of the thorax phantom studies with noisy projections.
| PSNR | NMAD | SSIM | ||
|---|---|---|---|---|
| Bone density | Image-based Method | 23.09 | 0.9797 | 0.9819 |
| EDEC Method | 24.44 | 0.7131 | 0.9824 | |
| NLM Method | 21.62 | 1.3316 | 0.9793 | |
| WLS-NLM Method | 21.49 | 1.3630 | 0.9714 | |
| MDIR Method | 22.41 | 1.0439 | 0.9759 | |
| E-SART Method | 28.57 | 0.3509 | 0.9925 | |
| Proposed Method | 35.60 | 0.1714 | 0.9948 | |
| Water density | Image-based Method | 15.65 | 0.7818 | 0.8432 |
| EDEC Method | 14.07 | 0.9839 | 0.8459 | |
| NLM Method | 15.92 | 0.7509 | 0.8425 | |
| WLS-NLM Method | 15.63 | 0.7846 | 0.8432 | |
| MDIR Method | 15.21 | 0.8332 | 0.8514 | |
| E-SART Method | 16.41 | 0.6931 | 0.8497 | |
| Proposed Method | 24.92 | 0.1957 | 0.8824 | |
| 70 KeV μ–image | Image-based Method | 21.86 | 0.5966 | 0.8684 |
| EDEC Method | 18.11 | 1.0058 | 0.8566 | |
| NLM Method | 20.52 | 0.7732 | 0.8687 | |
| WLS-NLM Method | 19.78 | 0.8404 | 0.8642 | |
| MDIR Method | 17.62 | 1.0110 | 0.8532 | |
| E-SART Method | 21.06 | 0.7141 | 0.8571 | |
| Proposed Method | 31.73 | 0.1575 | 0.9370 | |
Comparing all the visual results and quantitative assessments, the employed methods can be divided into 3 groups according to the decomposition accuracy and the distinguishing ability. The first group represents the case of major incorrected decomposition and weak basis-material distinction, which includes the image-based method, the NLM method, and the WLS-NLM method. All of them fail to keep the main homogenous material approximately constant in the decomposed results, i.e., the corresponding gray value changes in a wide range. Thus, the edges in the bone density percentage images are heavily eroded, especially in the head phantom studies. Moreover, only a portion of water can be observed in the water density percentage results, and the water-like materials can hardly be identified. In addition, the synthesized μ–images suffer from serious artifacts caused by incorrect decompositions. These unsatisfied performances consistently reveal a common weakness of the 3 methods --- mismatch in the data model. In our simulations, the emitted X-ray photons are not monochromatic. In fact, they obey a wide polychromatic spectral distribution. The relationship between the achieved projection data and the searched-for images of linear attenuation coefficient is nonlinear. However, the main idea of all the 3 methods is the same as linear decomposition in image domain, which leads to a poor approximation to the achieved data and incorrect separation results. Although we employ the water correction to decrease the fitting inaccuracy, it still fails to eliminate the flaw in theory. As upgraded versions of the conventional image-based method, the NLM and WLS-NLM methods adopt the idea of nonlocal mean to improve the smoothness, and the later method further takes the noise property into consideration. However, these upgrades are not to reduce the data mismatch. Thus, the improvements are considerably limited.
The second group only contains the EDEC method. It stands for the case of minor incorrect decomposition and moderate basis-material distinction. From the results of head phantom studies, it can be seen that the major structures are correctly decomposed into basis material images. However, there are still some errors near edges between different materials. The degree of decomposition accuracy is dramatically decreased in the thorax phantom studies, which demonstrates the limitation of EDEC method on the empirical calibration selection. Although the EDEC method employs a nonlinear fitting function to approximate the data model very well, the parameters are determined by a specifically known calibration with the same material composition and similar dimension. Thus, the inevitable differences between the calibration and the target specimen will increase the inaccuracy of the fitting model. In our simulations, we use the same yin-yang calibration for both phantoms. However, the corresponding decomposition performance varies considerably. This is because the head and thorax phantoms have significant differences in composing proportion and dimension. Moreover, even for the same head phantom, the performances between the noise-free and noisy cases are not consistent, either. This demonstrates the poor noise tolerance. Because there is no smoothness mechanism in the EDEC method, the determined fitting function will be greatly changed within the noise influence, which further leads to unstable decomposition results.
The rest 3 methods (the MDIR method, the E-SART method and the proposed method) can be classified into the third group --- correct decomposition and strong material distinction. Here the material distinction contains both basis material separation and soft tissue identification. All these methods basically can achieve accurate decompositions, because they consistently contain the polychromatic forward projection model to effectively solve the data match problem. However, the MDIR results suffer from shifted gray values, which are obvious in the representative profile plots. Moreover, both the MDIR and E-SART methods are sensitive to noise. In both noisy cases, some low-contrast soft tissues are submerged by noise and are not distinguished. Theoretically, the absence of smoothness constraint need to be blamed. Compared with the MDIR and the E-SART methods, the proposed method can effectively suppress the noise and its results have the highest SNR.
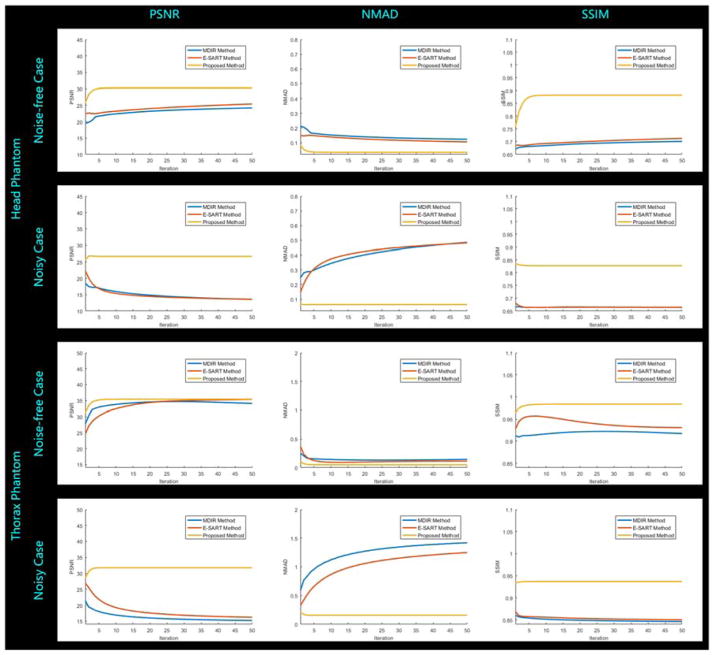
Considering all the methods in the third group belong to the iterative category, we further investigate the corresponding numerical convergence in light of the image quality measurements (PSNR, NMAD, and SSIM) of 70 KeV μ–images. For each method, we implement 50 iterations. The corresponding quantitative comparisons are illustrated in Fig. 10. From the convergence curves, we can see that the proposed method reaches stable stages within 5 iterations with remarkably improved image quality assessment indexes. However, both the MDIR and the E-SART methods converge very slow and achieve gradually degraded performances in the noisy case. In addition, we summarize the average computational cost in each iteration in Table 7. The average total computational time of the proposed method is about 7.48 minutes (89.53 seconds × 5 iterations = 447.65 seconds). Although the image-based method only spends 9.80 seconds, the corresponding results suffer from low decomposition accuracy. Considering the dramatic improvement of the proposed method in accurate decomposition with high image quality, it is worthy with acceptable extra computational cost. In our implementations, the time consumption in each iteration of the MDIR method is almost the same as that of the SART for both low- and high-energy reconstructions. Although the average computational cost of the proposed method is 4.7 times than the MDIR method and approximates the E-SART method in each iteration step, it produces images with dramatically improved quality, and the convergence rate is very fast. The proposed method considerably outperforms the competing methods.
Figure 10.
Numerical convergence of the MDIR, E-SART, and the proposed methods in numerical simulations. Three image quality assessment indexes (PSNR, NMAD, and SSIM) are calculated for 70 KeV μ–images in 50 iterations.
Table 7.
Average computational cost in each iteration step (unit: s).
| MDIR Method | E-SART Method | Proposed Method |
|---|---|---|
| 18.70 | 88.16 | 89.53 |
4.2 Real experiments
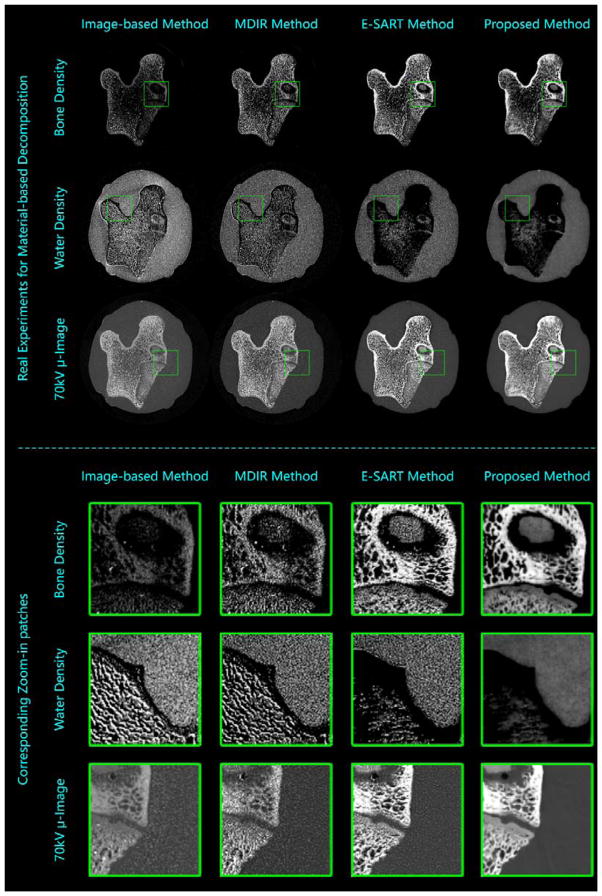
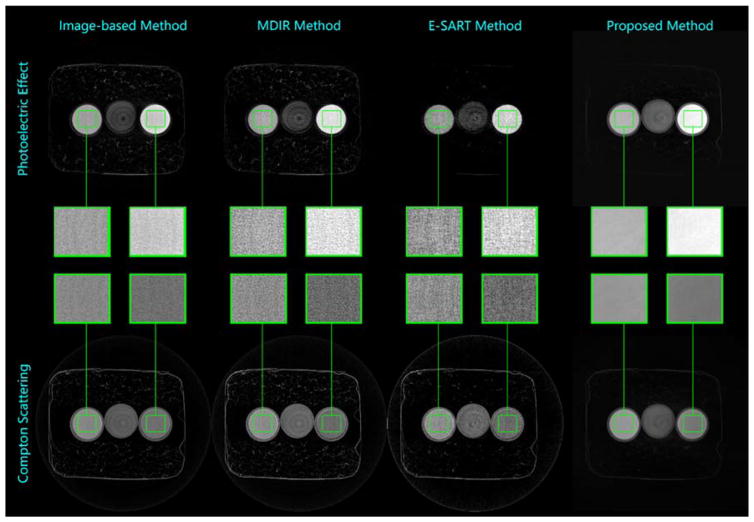
In the real experiments, an X-ray source (YXLON 225 kV micro-focus tube) is operated at the tube voltage of 80 kV and 140 kV for low- and high-energy spectral scans, respectively. The tube currents of low- and high-energy scans are fixed as 0.33 mA and 0.09 mA, respectively. The integral time for each view is the same (0.33s). In this way, after gain calibration, the detector achieves similar performance for both voltages, i.e., similar noise level. The employed flat-panel detector (Varian 2520DX detector) has 1920×1536 detector cells each of which has a size of 0.127 mm. The SOD is 231.5 mm and the SDD is 696.7 mm. By using a collimator, the data from the central slice are obtained to validate the proposed method. The iteration number is 10. In this setting, we scanned two specimens: the first is a bone submerged in water, and we employ the material-based decomposition method; the second consists of three different solutions (NaCl solution with NaCl density of 1.33g/ml, pure water, and Iopromide solution with Iopromide density of 0.04 g/ml), where the NaCl solution and the Iopromide solution fail to be distinguished in SSCT results of both scanned cases (see Fig. 3(B)). To separate them, we employ the effect-based DSCT decomposition method. The parameters employed by the proposed method are summarized in Table 8. The material-based decomposed and synthesized results by the image-based method, the MDIR, the E-SART and the proposed methods are shown in Fig. 11. The corresponding zoom-in local details are presented as well. It is noticeable that the proposed method can effectively suppress the noise and dramatically improve the smoothness. The effect-based decomposition results are illustrated in Fig. 12. Although the NaCl solution and the Iopromide solution are hardly to be distinguished in SSCT reconstruction, they can be effectively separated in DSCT decomposition. Moreover, the proposed method can achieve results with the highest SNR.
Table 8.
Parameters of the proposed method in real experiments.
| ξ | ω | ∊ | |
|---|---|---|---|
| Material-based decomposition | 1.67 | 3 × 3 | 10−9 |
| Effect-based decomposition | 1.67 | 3 × 3 | 10−8 |
Figure 11.
Real experiments for material-based decomposition by using the image-based method (the first column), the MDIR method (the second column), the E-SART method (the third column), and the proposed method (the fourth column).
Figure 12.
Real experiments for effect-based decomposition by using the image-based method (the first column), the MDIR method (the second column), the E-SART method (the third column), and the proposed method (the fourth column).
5. Discussion and conclusion
In this work, we establish a locally linear constraint to describe the structure relationship between dual spectra based decomposed results and single spectrum based reconstruction. An optimization model and an iterative algorithm are proposed. By employing the image guided filtering, the smoothness knowledge of SSCT image is effectively introduced into the decomposition process. Because this method reduces the illposedness of the DSCT, the noise in the decomposition process is significantly suppressed. Moreover, to further refine this approach, we incorporate a preprocessing method for SSCT. By employing RTV regularization, both strong and weak edges are well preserved, and the smoothness is effectively enhanced meanwhile. With this improved reference image, the proposed method produces superior results with higher SNR. Both numerical simulations and real experiments demonstrate the merits of the proposed method.
On one hand, the proposed method suppresses the noise effectively, and the quality of decomposed results is dramatically improved. On the other hand, it further improves the fast convergence speed of the E-SART. Further quantitative analyses and comparisons are needed to optimize the reference image, which will be fully studied in our future work.
Table 4.
Quantitative evaluation results of the head phantom studies with noisy projections.
| PSNR | NMAD | SSIM | ||
|---|---|---|---|---|
| Bone density | Image-based Method | 19.48 | 0.8836 | 0.9362 |
| EDEC Method | 22.59 | 0.5145 | 0.9342 | |
| NLM Method | 19.63 | 0.8681 | 0.9388 | |
| WLS-NLM Method | 19.52 | 0.8833 | 0.9378 | |
| MDIR Method | 22.91 | 0.5592 | 0.9508 | |
| E-SART Method | 27.99 | 0.2504 | 0.9491 | |
| Proposed Method | 29.15 | 0.1488 | 0.9655 | |
| Water density | Image-based Method | 11.99 | 0.8365 | 0.6603 |
| EDEC Method | 19.87 | 0.2639 | 0.6802 | |
| NLM Method | 11.98 | 0.8408 | 0.6652 | |
| WLS-NLM Method | 12.13 | 0.8032 | 0.6516 | |
| MDIR Method | 20.08 | 0.2704 | 0.6724 | |
| E-SART Method | 19.77 | 0.2815 | 0.6719 | |
| Proposed Method | 29.29 | 0.0485 | 0.9037 | |
| 70 KeV μ–image | Image-based Method | 13.44 | 0.5051 | 0.6512 |
| EDEC Method | 16.04 | 0.3227 | 0.6512 | |
| NLM Method | 13.42 | 0.5143 | 0.6602 | |
| WLS-NLM Method | 13.43 | 0.5051 | 0.6537 | |
| MDIR Method | 16.75 | 0.3091 | 0.6645 | |
| E-SART Method | 15.22 | 0.3818 | 0.6646 | |
| Proposed Method | 27.02 | 0.0633 | 0.8242 | |
Table 5.
Quantitative evaluation results of the thorax phantom studies with noise-free projections.
| PSNR | NMAD | SSIM | ||
|---|---|---|---|---|
| Bone percentage | Image-based Method | 23.04 | 0.9729 | 0.9877 |
| EDEC Method | 28.14 | 0.6629 | 0.9797 | |
| NLM Method | 21.51 | 1.3479 | 0.9841 | |
| WLS-NLM Method | 21.32 | 1.3692 | 0.9842 | |
| MDIR Method | 31.72 | 0.1516 | 0.9967 | |
| E-SART Method | 34.70 | 0.2025 | 0.9942 | |
| Proposed Method | 40.39 | 0.0840 | 0.9984 | |
| Water density | Image-based Method | 17.05 | 0.6341 | 0.8552 |
| EDEC Method | 20.24 | 0.3839 | 0.8825 | |
| NLM Method | 17.18 | 0.6120 | 0.8639 | |
| WLS-NLM Method | 17.10 | 0.6247 | 0.8547 | |
| MDIR Method | 25.48 | 0.1962 | 0.8714 | |
| E-SART Method | 25.50 | 0.1263 | 0.9107 | |
| Proposed Method | 29.19 | 0.0597 | 0.9637 | |
| 70 KeV μ–image | Image-based Method | 25.10 | 0.3839 | 0.9192 |
| EDEC Method | 16.66 | 0.9887 | 0.8959 | |
| NLM Method | 22.03 | 0.6364 | 0.9274 | |
| WLS-NLM Method | 22.09 | 0.6293 | 0.9107 | |
| MDIR Method | 33.20 | 0.1506 | 0.9137 | |
| E-SART Method | 30.82 | 0.1122 | 0.9569 | |
| Proposed Method | 35.30 | 0.0512 | 0.9825 | |
Acknowledgments
This work was supported in part by NIH/NIBIB U01 grant EB017140. It was also supported by the National Natural Science Foundation of China grant 61501310 and 61372179, and by the Beijing Municipal Commission of Education grant KM201710028002.
References
- ALVAREZ R, SEPPI E. A comparison of noise and dose in conventional and energy selective computed tomography. IEEE Transactions on Nuclear Science. 1979;26:2853–2856. [Google Scholar]
- ALVAREZ RE, MACOVSKI A. Energy-selective reconstructions in x-ray computerised tomography. Physics in medicine and biology. 1976;21:733. doi: 10.1088/0031-9155/21/5/002. [DOI] [PubMed] [Google Scholar]
- BESAG J. On the statistical analysis of dirty pictures. Journal of the Royal Statistical Society. Series B (Methodological) 1986:259–302. [Google Scholar]
- BROOKS RA, DI CHIRO G. Beam hardening in x-ray reconstructive tomography. Physics in medicine and biology. 1976;21:390. doi: 10.1088/0031-9155/21/3/004. [DOI] [PubMed] [Google Scholar]
- BUADES A, COLL B, MOREL JM. A non-local algorithm for image denoising. Computer Vision and Pattern Recognition, 2005. CVPR 2005. IEEE Computer Society Conference on; 2005. pp. 60–65. [Google Scholar]
- CHUANG KS, HUANG HK. Comparison of four dual energy image decomposition methods. Physics in Medicine and Biology. 1988;33:455. [Google Scholar]
- COLEMAN AJ, SINCLAIR M. A beam-hardening correction using dual-energy computed tomography. Physics in medicine and biology. 1985;30:1251. doi: 10.1088/0031-9155/30/11/007. [DOI] [PubMed] [Google Scholar]
- COMBETTES PL, WAJS VR. Signal recovery by proximal forward-backward splitting. Multiscale Modeling \& Simulation. 2005;4:1168–1200. [Google Scholar]
- DELEDALLE CA, DENIS L, TUPIN F. Iterative weighted maximum likelihood denoising with probabilistic patch-based weights. IEEE Transactions on Image Processing. 2009;18:2661–2672. doi: 10.1109/TIP.2009.2029593. [DOI] [PubMed] [Google Scholar]
- ELBAKRI IA, FESSLER JA. Statistical image reconstruction for polyenergetic X-ray computed tomography. IEEE transactions on medical imaging. 2002;21:89–99. doi: 10.1109/42.993128. [DOI] [PubMed] [Google Scholar]
- FESSLER JA, ELBAKRI IA, SUKOVIC P, CLINTHORNE NH. Maximum-likelihood dual-energy tomographic image reconstruction. Medical Imaging. 2002;2002:38–49. [Google Scholar]
- FLOHR TG, MCCOLLOUGH CH, BRUDER H, PETERSILKA M, GRUBER K, S\”U B, GRASRUCK C, STIERSTORFER M, KRAUSS K, RAUPACH BR, et al. First performance evaluation of a dual-source CT (DSCT) system. European radiology. 2006;16:256–268. doi: 10.1007/s00330-005-2919-2. [DOI] [PubMed] [Google Scholar]
- GHAEL SP, SAYEED AM, BARANIUK RG. Improved wavelet denoising via empirical Wiener filtering. Optical Science, Engineering and Instrumentation’97. 1997:389–399. [Google Scholar]
- GOOSSENS B, LUONG Q, PIZURICA A, PHILIPS W. An improved non-local denoising algorithm. 2008 International Workshop on Local and Non-Local Approximation in Image Processing (LNLA 2008); 2008. pp. 143–156. [Google Scholar]
- HE K, SUN J, TANG X. Guided image filtering. European conference on computer vision. 2010:1–14. [Google Scholar]
- HE K, SUN J, TANG X. Guided image filtering. IEEE transactions on pattern analysis and machine intelligence. 2013;35:1397–1409. doi: 10.1109/TPAMI.2012.213. [DOI] [PubMed] [Google Scholar]
- HU D, YU T, DUAN X, PENG Y, ZHAI R. Determination of the optimal energy level in spectral CT imaging for displaying abdominal vessels in pediatric patients. European journal of radiology. 2014;83:589–594. doi: 10.1016/j.ejrad.2013.10.016. [DOI] [PubMed] [Google Scholar]
- HU J, ZHAO X, WANG F. An extended simultaneous algebraic reconstruction technique (E-SART) for X-ray dual spectral computed tomography. Scanning. 2016 doi: 10.1002/sca.21306. [DOI] [PubMed] [Google Scholar]
- HUBBELL JH, SELTZER SM. Tables of X-ray mass attenuation coefficients and mass energy-absorption coefficients 1 keV to 20 MeV for elements Z= 1 to 92 and 48 additional substances of dosimetric interest. National Inst. of Standards and Technology-PL; Gaithersburg, MD (United States): 1995. Ionizing Radiation Div. [Google Scholar]
- HUYNH-THU Q, GHANBARI M. Scope of validity of PSNR in image/video quality assessment. Electronics letters. 2008;44:800–801. [Google Scholar]
- JOHNS PC, YAFFE MJ. Theoretical optimization of dual-energy x-ray imaging with application to mammography. Medical physics. 1985;12:289–296. doi: 10.1118/1.595766. [DOI] [PubMed] [Google Scholar]
- JOHNSON T, FINK C, SCHÖNBERG SO, REISER MF. Dual energy CT in clinical practice. Springer Science \& Business Media; 2011. [Google Scholar]
- KALENDER WA, KLOTZ E, KOSTARIDOU L. An algorithm for noise suppression in dual energy CT material density images. IEEE transactions on medical imaging. 1988;7:218–224. doi: 10.1109/42.7785. [DOI] [PubMed] [Google Scholar]
- KALENDER WA, PERMAN WH, VETTER JR, KLOTZ E. Evaluation of a prototype dual-energy computed tomographic apparatus. I. Phantom studies. Medical physics. 1986;13:334–339. doi: 10.1118/1.595958. [DOI] [PubMed] [Google Scholar]
- KINAHAN PE, ALESSIO AM, FESSLER JA. Dual energy CT attenuation correction methods for quantitative assessment of response to cancer therapy with PET/CT imaging. Technology in cancer research \& treatment. 2006;5:319–327. doi: 10.1177/153303460600500403. [DOI] [PubMed] [Google Scholar]
- LAURITSCH G, BRUDER H. FORBILD Head Phantom. 2012 doi: 10.1088/0031-9155/57/13/N237. website: http://www.imp.uni-erlangen.de/forbild/deutsch/results/head/head.html. [DOI] [PMC free article] [PubMed]
- MAAB C, BAER M, KACHELRIEB M. Image-based dual energy CT using optimized precorrection functions: A practical new approach of material decomposition in image domain. Medical physics. 2009a;36:3818–3829. doi: 10.1118/1.3157235. [DOI] [PubMed] [Google Scholar]
- MAAB C, GRIMMER R, KACHELRIEB M. Dual energy CT material decomposition from inconsistent rays (MDIR). 2009 IEEE Nuclear Science Symposium Conference Record (NSS/MIC); 2009b. pp. 3446–3452. [Google Scholar]
- MALLAT S. A wavelet tour of signal processing. Academic press; 1999. [Google Scholar]
- NIU T, DONG X, PETRONGOLO M, ZHU L. Iterative image-domain decomposition for dual-energy CT. Medical physics. 2014;41:041901. doi: 10.1118/1.4866386. [DOI] [PubMed] [Google Scholar]
- NOH J, FESSLER JA, KINAHAN PE. Statistical sinogram restoration in dual-energy CT for PET attenuation correction. IEEE transactions on medical imaging. 2009;28:1688–1702. doi: 10.1109/TMI.2009.2018283. [DOI] [PMC free article] [PubMed] [Google Scholar]
- RUDIN L, OSHER S. Total variation based image restoration with free local constraints. Image Processing, 1994. Proceedings. ICIP-94., IEEE International Conference; 1994. pp. 31–35. [Google Scholar]
- RUDIN L, OSHER S, FATEMI E. Nonlinear total variation based noise removal algorithms. Physica D. 1992;60:259–268. [Google Scholar]
- RUTHERFORD R, PULLAN B, ISHERWOOD I. X-ray energies for effective atomic number determination. Neuroradiology. 1976;11:23–28. doi: 10.1007/BF00327254. [DOI] [PubMed] [Google Scholar]
- SOURBELLE K. FORBILD Thorax Phantom. 2015 website: http://www.imp.uni-erlangen.de/phantoms/thorax/thorax.htm.
- SPECTRUMGUI. SpectrumGUI. 2014 website: https://sourceforge.net/projects/spectrumgui/
- STENNER P, BERKUS T, KACHELRIESS M. Empirical dual energy calibration (EDEC) for cone-beam computed tomography. Medical physics. 2007;34:3630–3641. doi: 10.1118/1.2769104. [DOI] [PubMed] [Google Scholar]
- TIKHONOV AN, ARSENIN VI, JOHN F. Solutions of ill-posed problems. Winston; Washington, DC: 1977. [Google Scholar]
- VETTER JR, PERMAN WH, KALENDER WA, MAZESS RB, HOLDEN JE. Evaluation of a prototype dual-energy computed tomographic apparatus. II. Determination of vertebral bone mineral content. Medical physics. 1986;13:340–343. doi: 10.1118/1.595951. [DOI] [PubMed] [Google Scholar]
- WANG Z, BOVIK AC, SHEIKH HR, SIMONCELLI EP. Image quality assessment: from error visibility to structural similarity. IEEE transactions on image processing. 2004;13:600–612. doi: 10.1109/tip.2003.819861. [DOI] [PubMed] [Google Scholar]
- WARP RJ, DOBBINS JT. Quantitative evaluation of noise reduction strategies in dual-energy imaging. Medical physics. 2003;30:190–198. doi: 10.1118/1.1538232. [DOI] [PubMed] [Google Scholar]
- XU L, YAN Q, XIA Y, JIA J. Structure extraction from texture via relative total variation. ACM Transactions on Graphics (TOG) 2012;31:139. [Google Scholar]
- XU Q, MOU X, TANG S, HONG W, ZHANG Y, LUO T. Implementation of penalized-likelihood statistical reconstruction for polychromatic dual-energy CT. SPIE Medical Imaging. 2009:72585I–72585I. [Google Scholar]
- YING Z, NAIDU R, CRAWFORD CR. Dual energy computed tomography for explosive detection. Journal of X-ray Science and Technology. 2006;14:235–256. [Google Scholar]
- ZENG D, BIAN Z, GONG C, HUANG J, HE J, ZHANG H, LU L, FENG Q, LIANG Z, MA J. Iterative image reconstruction for multienergy computed tomography via structure tensor total variation regularization. SPIE Medical Imaging. 2016a:978349–978349. doi: 10.1016/j.compmedimag.2016.07.002. [DOI] [PubMed] [Google Scholar]
- ZENG D, HUANG J, ZHANG H, BIAN Z, NIU S, ZHANG Z, FENG Q, CHEN W, MA J. Spectral CT image restoration via an average image-induced nonlocal means filter. IEEE Transactions on Biomedical Engineering. 2016b;63:1044–1057. doi: 10.1109/TBME.2015.2476371. [DOI] [PubMed] [Google Scholar]
- ZHANG G, CHEN Z, ZHANG L, CHENG J. Exact reconstruction for dual energy computed tomography using an HL curve method. 2006;6:3485–3488. [Google Scholar]
- ZHANG G, CHENG J, ZHANG L, CHEN Z, XING Y. A practical reconstruction method for dual energy computed tomography. Journal of X-ray Science and Technology. 2008;16:67–88. [Google Scholar]
- ZHANG H, ZENG D, LIN J, ZHANG H, BIAN Z, HUANG J, GAO Y, ZHANG S, ZHANG H, FENG Q. Iterative reconstruction for dual energy CT with an average image-induced nonlocal means regularization. Physics in Medicine and Biology. 2017 doi: 10.1088/1361-6560/aa7122. [DOI] [PMC free article] [PubMed] [Google Scholar]
- ZHANG R, THIBAULT JB, BOUMAN CA, SAUER KD, HSIEH J. Model-based iterative reconstruction for dual-energy X-ray CT using a joint quadratic likelihood model. IEEE transactions on medical imaging. 2014;33:117–134. doi: 10.1109/TMI.2013.2282370. [DOI] [PubMed] [Google Scholar]
- ZHANG Y, YU H. Tensor decomposition and nonlocal means based spectral CT reconstruction. SPIE Optical Engineering+ Applications. 2016:99670Z–99670Z. [Google Scholar]
- ZHAO Y, ZHAO X, ZHANG P. An extended algebraic reconstruction technique (E-ART) for dual spectral CT. IEEE transactions on medical imaging. 2015;34:761–768. doi: 10.1109/TMI.2014.2373396. [DOI] [PubMed] [Google Scholar]
- ZHU Y, ZHAO M, ZHAO Y, LI H, ZHANG P. Noise reduction with low dose CT data based on a modified ROF model. Optics express. 2012;20:17987–18004. doi: 10.1364/OE.20.017987. [DOI] [PubMed] [Google Scholar]


