Abstract
Corneal endothelium morphological abnormalities result in fluid imbalance, stromal swelling, and loss of transparency, thus impairing visual function. Recently, growing number of studies have focused on diabetic corneal abnormalities after cataract surgery and its comparison with non-diabetic patients, the results remain conflicting. Thus, to evaluate the effect of phacoemulsification on the corneal properties in diabetic and non-diabetic patients, prospective studies were comprehensively searched through PubMed, EMBASE, and Cochrane databases updated to Jan 2017. A meta-analysis of the 13 identified studies was performed using weighted mean difference (WMD) and 95% confidence interval (CI). For the dynamic changes between preoperative and postoperative values, significant differences were identified between the two groups in endothelial cell density (ECD) and hexagon cells (HC%) at 1 day, 1 week, 1 month, and 3 months postoperatively, in central corneal thickness (CCT) at 1 month postoperatively, and in coefficient variation (CV) at 1 week and 1 month postoperatively. However, no significant differences were observed in CCT at 1 day, 1 week and 3 months postoperatively or in CV at 1 day and 3 months postoperatively. Diabetic corneas are more vulnerable to stress and trauma, resulting in greater morphological abnormalities and longer recovery time.
Introduction
As of 2015, an estimated 415 million people had diabetes worldwide1, which is almost 1.5 times greater than in 2010 (285 million). The global prevalence of diabetes is growing much faster than earlier forecasts predicted (366 million by the year 2030)2,3. Obviously, diabetes mellitus (DM) is becoming more prevalent and threatening than was previously thought.
It has been acknowledged that DM leads to various complications such as nephropathy, neuropathy, cardiovascular issues, and several ocular complications like diabetic retinopathy, diabetic cataract, diabetic keratopathy, and diabetic optic nerve diseases4. Although the cornea may appear disease free in the diabetic, an awareness of the marked biochemical and ultrastructural abnormalities in the diabetic enables us to prevent more overt complications. The diabetic cornea suffers from endothelium cellular dysfunction and dysfunctional repair mechanisms including corneal edema, delayed wound healing, and so on5,6. Over the past decades, the pathology of the diabetic corneal endothelium dysfunction has become understood in more detail7. The state of hyperglycemia results in an increase in aldose reductase activity, the expression of metalloproteinase (MMP), and the formation of advanced glycation end products (AGEs). Evidence has shown that the inhibition of aldose reductase reduces dysmorphological changes in the corneal endothelium8,9. Enhanced MMPs can damage the basement membrane and limit cell migration, resulting in poor healing10. Moreover, the accumulation of AGEs can lead to an abnormality of cell adhesion11. The cornea is likely to be more vulnerable to stress and trauma in diabetic patients than in non-diabetics.
Phacoemulsification has become the predominant treatment procedure for cataract, the leading cause of blindness and visual impairment worldwide12,13. Although most cataract patients achieve decent recovery, unfortunately, in a complex disease environment, cataract surgery with phacoemulsification and lens implantation leads to larger endothelial cell loss in diabetic corneas14–18. Furthermore, the corneal endothelium can be adversely affected by surgery due to factors like lens nuclear sclerosis, effective phacoemulsification time (EPT), phacoemulsification energy, and IOL implantation15,19–21. These factors coupled with the effect of DM indicate a great risk of long-term endothelium cell dysfunction with decompensation and the development of bullous keratopathy22. Accelerated losses of corneal endothelial cells have been reported to continue even 10 years after surgery23.
To evaluate the corneal state, corneal thickness and endothelial cell morphology are the top two clinical concerns. Central corneal thickness (CCT), as an indicator of the physiological condition of the corneal endothelium, is generally used in diagnoses like keratoconus, Fuchs’ dystrophy, and glaucoma. Recognizing CCT is important because it can mask an accurate reading of intraocular pressure (IOP)24, causing doctors to unnecessarily treat for a condition that may not exist. Endothelial morphological changes in corneas, including endothelial density (ECD), coefficient of variation (CV), and percentage of hexagonal cells (HC%), can alter the cornea’s ability to function. Abnormal corneal endothelial cell morphology coupled with increased CCT25 is another marker of endothelial cell dysfunction, which results in fluid imbalance, stromal swelling, and loss of transparency, thus impairing visual function.
Recently, a growing number of studies have focused on the importance of diabetic corneal abnormalities, which were commonly found in patients after cataract surgery due to factors including diabetic state and surgical procedures26. However, there is still conflict concerning the differences in corneal properties between diabetic and non-diabetic patients after phacoemulsification. According to our knowledge, there has been no comprehensive review or meta-analysis regarding corneal changes after phacoemulsification for diabetic and non-diabetic groups so far. Under the circumstances, this article is set to evaluate the effect of phacoemulsification on ECD, HC%, CV, and CCT in diabetic patients and non-diabetic patients.
Results
Literature selection
The workflow chart in Fig. 1 shows the literature selection process. After duplication removal, a total of 361 studies were retrieved from the databases. 330 studies were excluded by scanning titles and abstracts. Furthermore, 18 studies were excluded after full-text reading: four on extracapsular cataract extraction (ECCE), two on manual small incision cataract surgery (MSICS) which is different from phacoemulsification from either the incision size or the surgical method, five retrospective studies, five with unavailable data (e.g. no postoperative data, no cohort, or an unmatched comparison group), one that was a poster, and one that was a review. Finally, 13 studies17,19,27–37 meeting all of the predefined criteria were identified. The characteristics of the included studies are shown in Table 1. The details of N OS scale are shown in Table S6.
Figure 1.
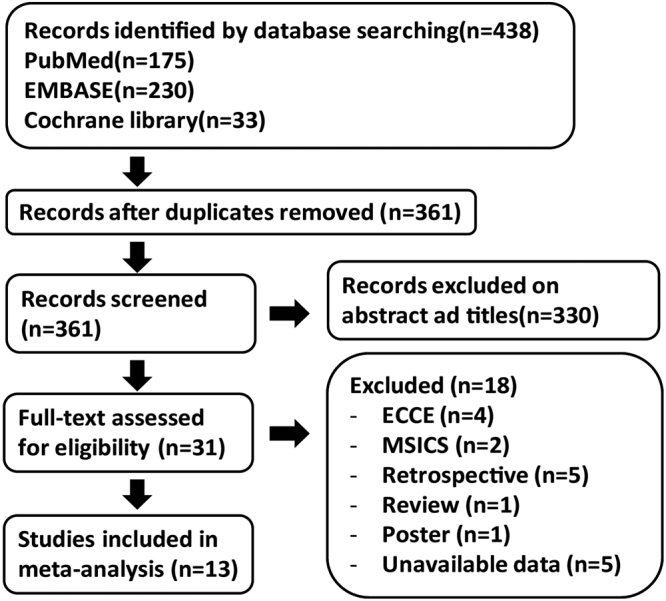
Workflow chart of the literature selection process.
Table 1.
Characteristics of included studies. NA = not available, DM = diabetes mellitus, NOS = The Newcastle–Ottawa scale.
| Study ID | Country/province | Study design | Follow up duration | No. of eyes Gender (M/F) | Age (year/SD, range) | Diabetes condition | Quality control (NOS) | ||
|---|---|---|---|---|---|---|---|---|---|
| Normal | DM | Normal | DM | ||||||
| Li19 | China Hainan | Prospective controlled study | 3 months | 106/84 | 101/85 | 65.1 (12.3) | 64.6 (12.5) | NA | 7 |
| Misra27 | New Zealand | Prospective cohort study | 6 months | 23 | 28 | 74.4 (7.4) | 71.2 (7.6) | Duration (11.54 years) HbA1c% (DM:nDM 7.5:5.7, P < 0.001) | 8 |
| Zhu28 | China Beijing | Prospective controlled study | 1 month | 16/17 | 15/20 | 60–80 | 60–80 | Blood glucose < 8.3 mmol/L, diabetic course > 5a | 8 |
| Yan29 | China Guizhou | Prospective controlled study | 3 months | 30/32 | 51/46 | 69.6 (55–85) | 65.6 (52–82) | Diabetic course > 10a, Diabetic course < 10a | 8 |
| Su30 | China Liaoning | Prospective controlled study | 1 month | 31 | 39 | 50–80 | 50–80 | Blood glucose < 8.3 mmol/L, diabetic course < 15a | 8 |
| Liu31 | China Hebei | Prospective controlled study | 1 week | 16/14 | 17/13 | 64.7 (3.6) | 69.6 (5.4) | NA | 8 |
| Zhao32 | China Shandong | Prospective controlled study | 3 months | 24/26 | 26/24 | 64.8 (55–83) | 63.2 (52–80) | NA | 8 |
| Wang33 | China inner Mongolia | Prospective controlled study | 6 months | 36/24 | 24/16 | 69.2 (8.2) | 65.3 (11) | NA | 7 |
| Yang34 | China Guangzhou | Prospective controlled study | 3 months | 33/32 | 34/41 | 68.1 (50–84) | 67.8 (51–83) | Blood glucose < 6. 6–10 mmol/L Duration (1–17 years) | 8 |
| Hugod35 | Denmark | Prospective controlled study | 3 months | 30 | 30 | 75.4 (9.3) | 75.6 (8.6) | HbA1c%(7.08 (1.43)) | 8 |
| Wu36 | China Shaanxi | Prospective controlled study | 3 months | 31 | 28 | 50–80 | 50–80 | Diabetic course < 12a | 7 |
| Wu37 | China Hainan | Prospective controlled study | 3 months | 33/31 | 26/24 | 65.6 (52–82) | 66.8 (50–84) | NA | 8 |
| Morikubo17 | Japan | Prospective controlled study | 1 month | 93 | 93 | 68.8 (8.9) | 68.6 (8.8) | NA | 8 |
Meta-analysis of the outcomes
A total of 13 prospective studies including 1923 eyes (941 in the non-diabetic group and 982 in the diabetic group) were identified. The surgical parameters (e.g. phaco-time and phaco-energy) and lens nucleus hardness were reported with no significant differences between the DM and non-DM groups, as shown in Tables S1–S4.
Endothelial cell density
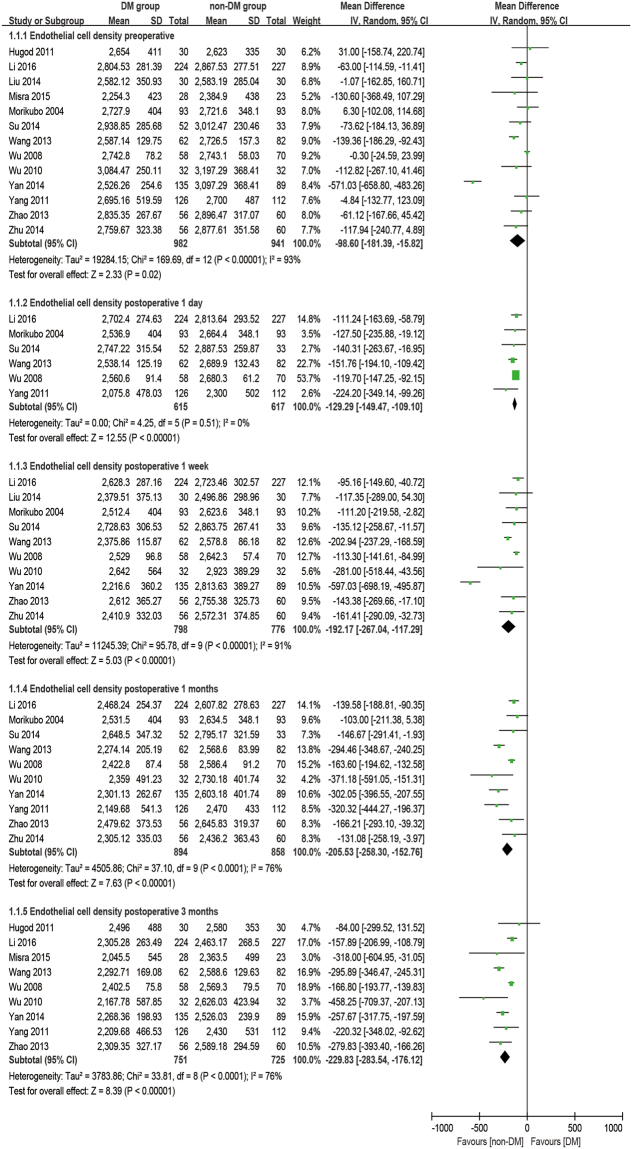
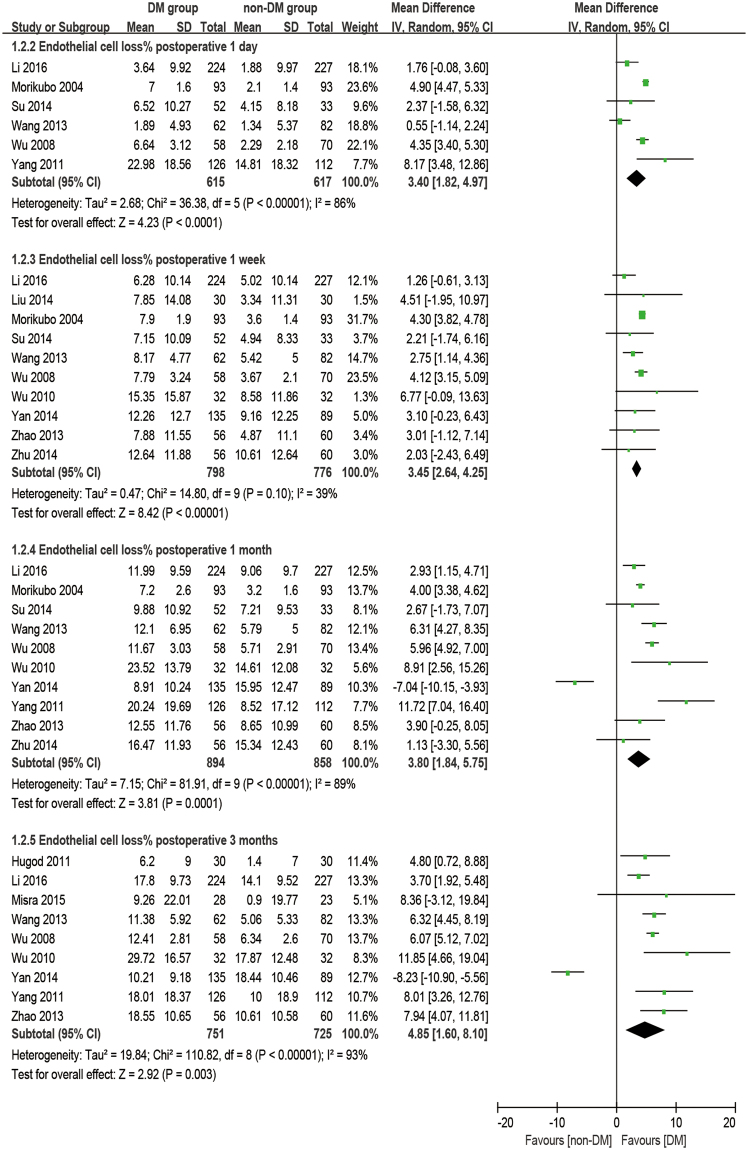
There were thirteen studies reporting the outcome of ECD. The analysis was made at 1 day, 1 week, 1 month, and 3 months postoperatively. It was found that diabetic patients have a significantly lower ECD at preoperative and all postoperative time points than the non-diabetic group (baseline: WMD = −98.60, 95% CI: −181.39 to −15.82, P = 0.02; 1 day postoperative: WMD = −129.29, 95% CI: −149.47 to −109.10, P < 0.001; 1 week postoperative: WMD = −192.17, 95% CI: −267.04 to −117.29, P < 0.001; 1 month postoperative: WMD = −205.53, 95% CI: −258.30 to −152.76, P < 0.001; 3 months postoperative: WMD = −229.83, 95% CI: −283.54 to −176.12, P < 0.001; Fig. 2). Furthermore, the percentage of the loss of ECD (ECL%, difference between preoperative and postoperative), which was calculated from equations (1–5), was also evaluated to see the effect caused by phacoemulsification. There are significant differences in ECL% at all postoperative times for the DM group compared to the non-DM group (1 day postoperative: WMD = 3.40, 95% CI: 1.82 to 4.97, P < 0.001; 1 week postoperative: WMD = 3.45, 95% CI: 2.64 to 4.25, P < 0.001; 1 month postoperative: WMD = 3.80, 95% CI: 1.84 to 5.75, P < 0.001; 3 months postoperative: WMD = 4.85, 95% CI: 1.60 to 8.10, P = 0.003; Fig. 3).
Figure 2.
Forest plot comparison of the corneal endothelial cell density (ECD) after phacoemulsification in diabetic and non-diabetic patients.
Figure 3.
Forest plot comparison of the corneal endothelial cell loss in percentage (ECL%) after phacoemulsification in diabetic and non-diabetic patients.
Coefficient of variation
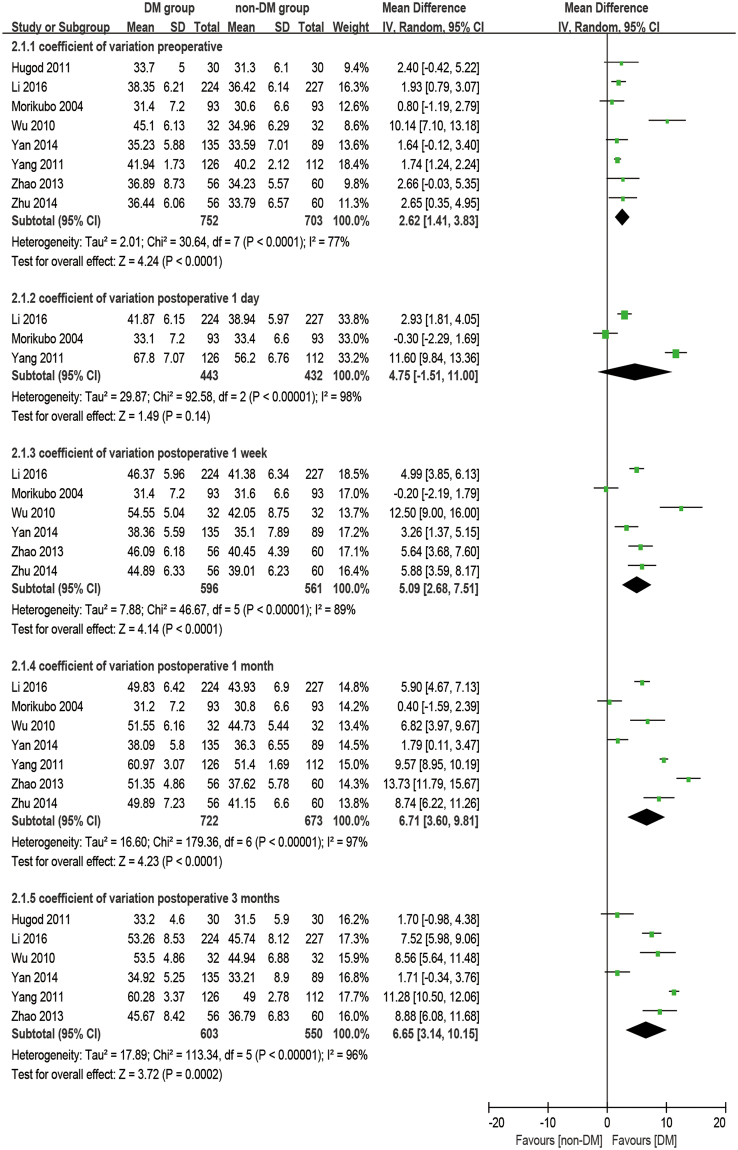
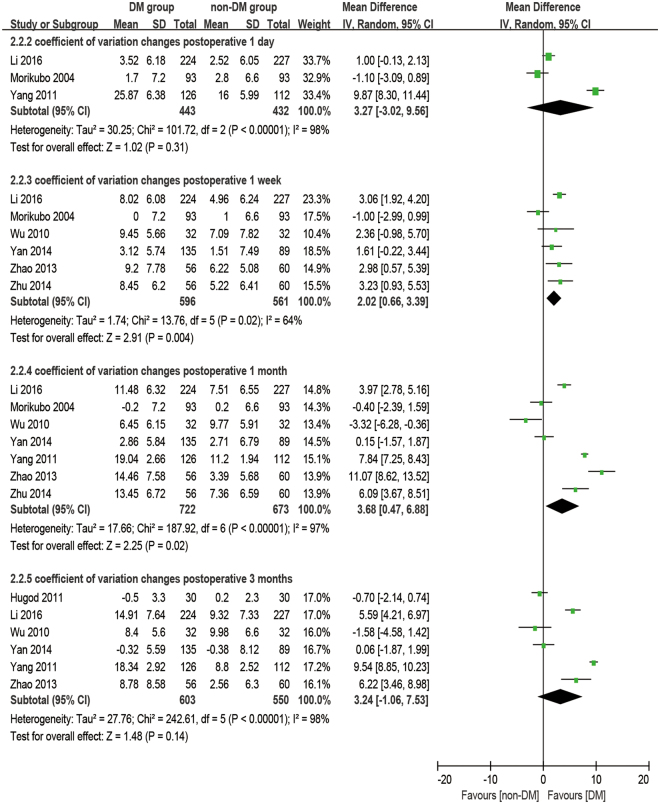
There were eight studies reporting the outcome of coefficient of variation. The analysis was made at 1 day, 1 week, 1 month, and 3 months postoperatively. It was observed that diabetic patients had a significantly higher CV at preoperative and all postoperative time points than the non-DM group (baseline: WMD = 2.62, 95% CI: 1.41 to 3.83, P < 0.001; 1 week postoperative: WMD = 5.09, 95% CI: 2.68 to 7.51, P < 0.001; 1 month postoperative: WMD = 6.71, 95% CI: 3.60 to 9.81, P < 0.001; 3 months postoperative: WMD = 6.65, 95% CI: 3.14 to 10.15, P < 0.001), except at 1 day postoperatively (WMD = 4.75, 95% CI: −1.51 to 11.00, P = 0.14, Fig. 4). The increase of CV (dCV, difference between preoperative and postoperative) appears significantly larger in the DM group compared to the non-DM group at 1 week postoperatively (WMD = 2.02, 95% CI: 0.66 to 339, P = 0.004) and at 1 month postoperatively (WMD = 3.68, 95% CI: 0.47 to 6.88, P = 0.02), while no significant differences were found at 1 day postoperatively (WMD = 3.27, 95% CI: −3.02 to 9.56, P = 0.31) and 3 months postoperatively (WMD = 3.24, 95% CI: −1.06 to 7.53, P = 0.14, Fig. 5).
Figure 4.
Forest plot comparison of the coefficient of variation (CV) of corneal endothelial cells after phacoemulsification in diabetic and non-diabetic patients.
Figure 5.
Forest plot comparison of the change of coefficient of variation (dCV) of corneal endothelial cells after phacoemulsification in diabetic and non-diabetic patients.
Hexagonal cell percentage
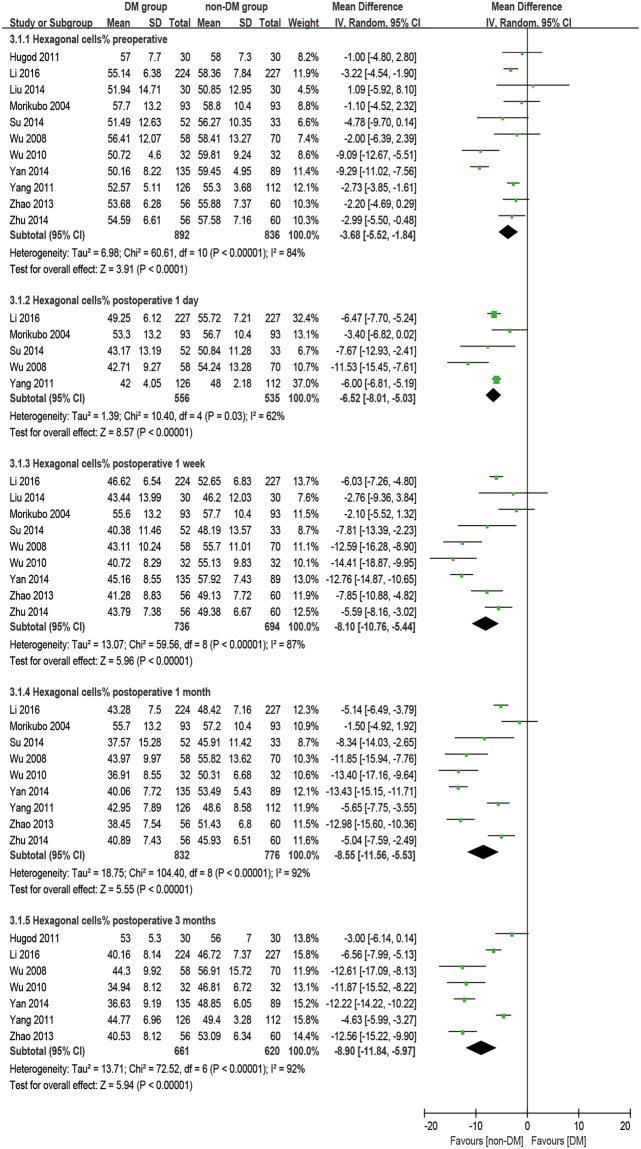
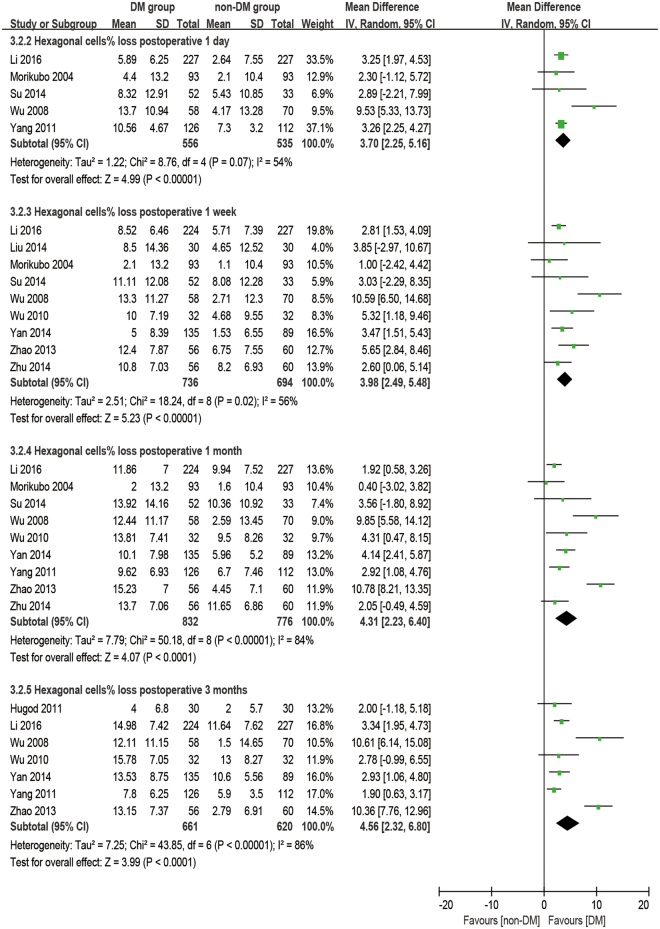
There were 11 studies reporting the outcome of hexagonal cells. The analysis was made at 1 day, 1 week, 1 month, and 3 months postoperatively. It was found that diabetic patients have a significantly smaller HC% at preoperative and all postoperative time points (all: P < 0.001, Fig. 6) and a significantly larger HC% loss (difference of preoperative and postoperative) at all postoperative times (all: P < 0.001, Fig. 7) compared to the non-DM group.
Figure 6.
Forest plot comparison of the percentage of hexagonal corneal endothelial cells (HC%) after phacoemulsification in diabetic and non-diabetic patients.
Figure 7.
Forest plot comparison of the loss of percentage of hexagonal corneal endothelial cells (dHC%) after phacoemulsification in diabetic and non-diabetic patients.
Central corneal thickness
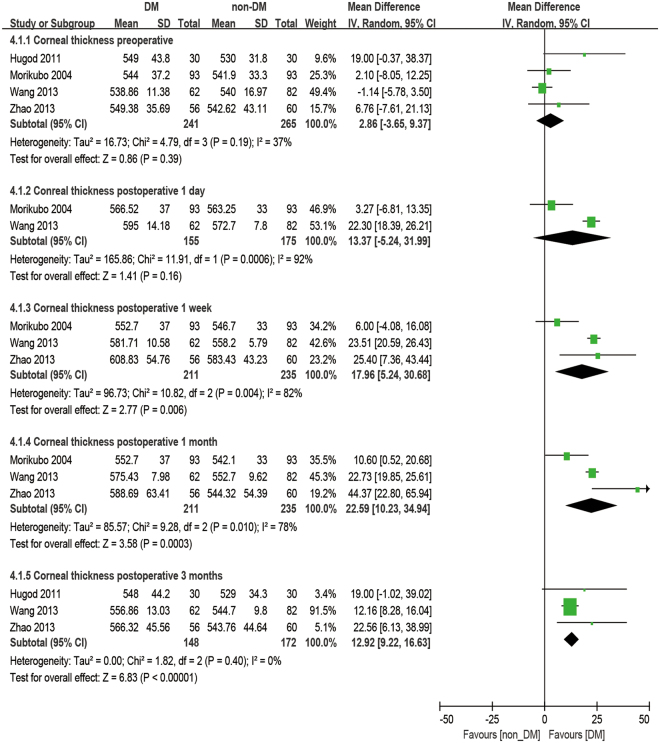
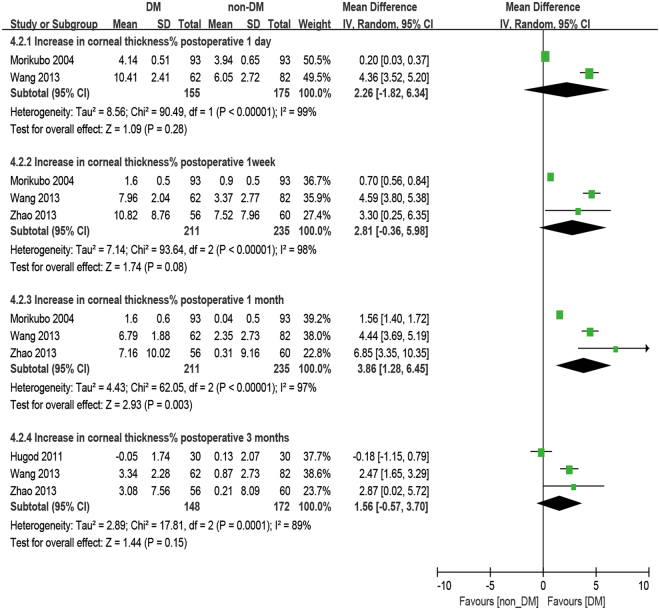
There were four studies reporting the outcome of CCT. The analysis was made at 1 day, 1 week, 1 month, and 3 months postoperatively. No significant difference was observed in CCT between diabetic patients and non-diabetic patients. (baseline: WMD = 2.86, 95% CI: −3.65 to 9.37, P = 0.39, 1 day postoperative: WMD = 13.37, 95% CI: −5.24 to 31.99, P = 0.16). After phacoemulsification, the CCT of the DM group was significantly higher than that of the non-DM group at all postoperative time points (1 week postoperatively: WMD = 17.96, 95% CI: 5.24 to 30.68, P = 0.006; 1 month postoperatively: WMD = 22.59, 95% CI: 10.23 to 34.94, P < 0.001; 3 months postoperatively: WMD = 12.92, 95% CI: 9.22 to 16.63, P < 0.001; Fig. 8). Moreover, the percent increase of CCT (dCCT%, difference between preoperative and postoperative percentages) showed no significant difference between the DM group and the non-DM group at 1 day postoperatively (WMD = 2.26, 95% CI −1.82 to 6.43, P = 0.28), 1 week postoperatively (WMD = 2.81, 95% CI: −0.36 to 5.98, P = 0.08) and 3 months postoperatively (WMD = 1.56, 95% CI: −0.57 to 3.70, P = 0.15), but a significantly larger dCCT% was found in diabetic patients at 1 month postoperatively compared to the non-diabetic ones (WMD = 3.86, 95% CI: 1.28 to 6.45, P = 0.003, Fig. 9).
Figure 8.
Forest plot comparison of the central corneal thickness (CCT) after phacoemulsification in diabetic and non-diabetic patients.
Figure 9.
Forest plot comparison of the increased central corneal thickness percentage (dCCT%) after phacoemulsification in diabetic and non-diabetic patients.
Sensitivity analysis and publication bias
Since some of the results show heterogeneity (), a random-effect meta-regression model was chosen to analyze this condition. No publication bias was found through Begg’s and Egger’s test as shown in Table S5. Outcomes included in only 3 studies are too small to do a sensitivity analysis so as to exclude trials at a high risk of bias. Thus, one-study-removed analyses were conducted for all remaining outcomes. The sensitivity analysis revealed that there are two pooled outcomes lacking stability: the outcome of ECD at the baseline and the outcome of dCV at 1 month postoperatively. Yan and Chen (2014)29, whose patients had a long duration of DM, is the source of the statistical heterogeneity in the meta-analysis of the preoperative ECD result as shown in Table 2. When this outlier study is removed, the outcome is stable, indicating that the outcome is still rational and reliable. The heterogeneity of the second sensitive outcome may be due to several design differences among the studies that affect the response degree and recovery duration, such as duration of diabetes and blood glucose control. No significant publication bias was demonstrated in the funnel plot.
Table 2.
One-study-removed analysis for the outcomes of ECD preoperatively and dCV at 1 month postoperatively.
| Study | P | 95% CI | I 2 |
|---|---|---|---|
| Endothelial cell density preoperatively | |||
| Hugod35 | P = 0.01 | [−193.35, −21.02] | 93% |
| Li19 | P = 0.04 | [−197.90, −4.74] | 94% |
| Liu31 | P = 0.02 | [−192.48, −18.93] | 93% |
| Misra27 | P = 0.03 | [−182.39, −11.18] | 94% |
| Morikubo17 | P = 0.02 | [−195.75, −19.36] | 93% |
| Su30 | P = 0.03 | [−189.02, −12.17] | 94% |
| Wang33 | P = 0.05 | [−189.35, 1.16] | 93% |
| Wu37 | P = 0.03 | [−202.90, −12.37] | 91% |
| Wu36 | P = 0.03 | [−184.39, −10.50] | 93% |
| Yan29 | P = 0.01 | [−100.10, −12.55] | 67% |
| Yang34 | P = 0.02 | [−193.79, −18.58] | 93% |
| Zhao32 | P = 0.02 | [−190.32, −13.07] | 94% |
| Zhu28 | P = 0.03 | [−184.61, −9.14] | 93% |
| Changes of coefficient of variation at 1 month postoperatively | |||
| Li19 | P = 0.09 | [−0.50, 7.73] | 97% |
| Morikubo17 | P = 0.009 | [1.09, 7.64] | 97% |
| Wu36 | P = 0.003 | [1.59, 7.93] | 97% |
| Yan29 | P = 0.01 | [0.99, 7.58] | 96% |
| Yang34 | P = 0.09 | [−0.45, 6.33] | 94% |
| Zhan32 | P = 0.16 | [−0.97, 5.94] | 97% |
| Zhu28 | P = 0.08 | [−0.34, 6.90] | 97% |
Discussion
The results of the present meta-analysis provided robust evidence that the effect of phacoemulsification on corneal changes in diabetics is greater than for non-diabetics. Significant differences have been observed between the diabetic and non-diabetic groups in terms of ECD, HC%, CV, and CCT preoperatively and 1 day, 1 week, 1 month, and 3 months postoperatively, except CV at 1 day postoperatively and CCT preoperatively. For the changes between the preoperative and postoperative state, significant differences were identified in ECL% and HC% loss at 1 day, 1 week, 1 month, and 3 months postoperatively, in dCCT% at 1 month postoperatively, and in dCV at 1 week and 1 month postoperatively between the two groups. Nevertheless, no significant differences were observed in dCV and dCCT% at 1 week and 3 months postoperatively.
Corneal endothelial cell morphology
It was once considered controversial that diabetes could affect corneal endothelium morphology preoperatively. Inoue et al.38 investigated 1394 patients before cataract surgery and their multiple regression analysis revealed that age instead of DM was the only variable relevant to ECD, CV, and HC%. However, Lee et al.39 reported that corneal endothelium morphology was significantly different between DM and non-DM patients, and CV is significantly correlated with diabetes duration. Taking multiple studies into account, the results of this review offer the judgment that DM patients have lower ECD and HC%, but higher CV, than non-DM patients (CV: P < 0.001; ECD: P = 0.02; HC%: P < 0.001; Figs 2, 4 and 6) before phacoemulsification.
The fragility of the corneal endothelium in the eyes of diabetic patients might be explained by several mechanisms. With an enhanced polyol pathway and the accumulated sugar alcohol in cells converted by excessive glucose, the osmotic pressure goes up, causing the fragility of diabetic corneal endothelial cells. Morphological abnormalities in the corneal endothelium have been reported8,40 to improve after administration of an aldose reductase inhibitor in the polyol pathway, which supports its involvement in the corneal endothelial abnormalities of patients with DM. Furthermore, the enhanced accumulation of AGEs in diabetic corneas provides strong evidence22 that nuclear oxidative DNA damage caused by the accumulation of AGEs is responsible for the apoptotic damage of corneal endothelial cells in diabetic patients, which also results in decreased ECD. Diabetes also reduces the activity of Na+/K+-ATPase of the corneal endothelium41, which plays a key role in the maintenance of its structure. This causes morphological and functional changes, including increased CV and decreased HC% in diabetic corneas. Since a regular hexagonal pattern of the corneal endothelium provides the most stable covering plane, deviation from this pattern leads to a less stable monolayer. In the diabetic endothelium, there is a greater surface tension on the monolayer caused by the loss of the regular hexagonal pattern and the increasingly irregular shapes of the corneal endothelium, which makes the corneas of diabetic patients more fragile26,42. According to quantitative morphometric analysis, the corneas of patients with DM may be at risk in intraocular surgical procedures.
Endothelial cell density
Clinical observations have indicated that the corneal endothelium is capable of compensation to prevent complicated diseases of the cornea, such as bullose keratopathy22, unless the cell density reaches a very low threshold of 400–500 cells/mm2, at which point the cornea cannot maintain its normal physiological function43. Typically, it is widely accepted that 1000 cells/mm2 is the minimum preoperative value to prevent corneal decompensation after surgery. The diabetic cornea, which is more fragile and vulnerable to trauma, possesses a weaker compensatory capacity. The study by Furuse et al.44 reportedfwhich point the cornea cannot
that there is no significant difference in the ECL% and CV values beween the two groups postoperatively. However, a recent study by Dhasmana et al.45 showed a severe increase in ECL% in the DM group compared to the control after cataract surgery. The results of our meta-analysis showed that DM patients have a significantly greater ECL% than non-DM patients from the first day to 3 months postoperatively (P < 0.01, Fig. 3), confirming that diabetic patients are more susceptible to corneal endothelial damage after phacoemulsification.
Coefficient of variation and hexagonal cell percentage
It’s common practice that ECD is used to evaluate the state of corneas after phacoemulsification, but it cannot reflect the dynamic of the healing process for trauma. The change in morphology has a closer relationship with the dynamic of the corneal recovery process. The loss of endothelial cells, as an immediate response to surgery, leads to some defeats. Unlike the corneal epithelium, the cells of the endothelium do not regenerate. Instead, the remaining cells enlarge and stretch to cover the posterior corneal surface in order to fill the space. Ideally, the earliest phenomena should be an increase in cell size coupled with an enlargement in CV and a decrease in HC%. After a period of rearrangement, the defects would diminish, and CV and HC% would return to preoperative values as well46. Gradually, the cells return to stability to maintain the physiological function of corneas. Although many studies28–30,32,34–37,45,47 have mentioned that a significant difference in CV and HC% were found between DM and non-DM groups or between postoperative and preoperative periods, quite a few studies discuss the comparison of the dynamic change of CV and HC% between the two groups. Our meta-results showed that dCV follows a pattern of maximum increase between 1 day and 1 week postoperatively and then slowly reduces for at least 3 months. On the first day after phacoemulsification, both groups have an enlarged inhomogeneity in cell size, which gives two large dCV values without a significant difference (P = 0.31). The ascending process lasts for 1 day17,34 to 1 month32 before cell shape starts to compensate to be uniform. Significant differences between the two groups started at 1 week postoperatively (P = 0.004), peaked at 1 month postoperatively (P = 0.02, Fig. 7), and then vanished at 3 months postoperatively with the recovery of the diabetic patient (P = 0.14, Fig. 5). However, a sensitivity analysis showed an unstable outcome at 1 month postoperatively. It can be inferred that this is because the measurements were done at some critical point when the significant difference started to appear or disappear. What’s more, different durations of DM29 and blood glucose control34,48 might affect the result.
This kind of recovery was not uniform for all corneal morphological properties. For HC% loss, there was always a significant difference between the DM and non-DM groups postoperatively (P < 0.001, Fig. 7). Once the endothelial cells lose their hexagonal structure, the stretching and rearrangement process will not easily give a second chance for the cells to stabilize into hexagons again. The time of the HC% recovery in diabetic corneas should be longer than 3 months.
Central corneal thickness
For the preoperative state, Kotecha et al.49 found no significant difference in CCT between the DM and non-DM groups. However, Lee et al.18,39 reported that CCT, which is strongly correlated with DM duration, is slightly greater in diabetic patients than in non-diabetic patients. The analysis revealed a slightly greater CCT in patients with DM, but no significant difference preoperatively (P = 0.39, Fig. 8).
The effect of DM on CCT is still ambiguous. There are several possible explanations, such as the inhibition of endothelial pumping, growing stromal swelling pressure, and increasing endothelial permeability caused by diabetic metabolism50–53. Briefly, the normal corneal endothelium plays a key role in keeping the cornea moist and transparent as well as maintaining integrity to prevent stromal swelling. Tight apical junctions on the endothelial cells function as physical barriers. The movement of water outward from the corneal stroma into the anterior chamber is increased due to ion pumps in the endothelial cells. Thus, corneal edema can be caused by a breakdown of either the anatomical barrier or the pump function of the corneal endothelial cells, representing an increase in CCT. This effect depends on the pathology insults of DM18 and the severity of the physical trauma.
After phacoemulsification, the increase in CCT was maximum at 1 day and 1 week postoperatively and then gradually decreased for at least 3 months17,26,32,33,45,47. Altintas et al.26 demonstrated that corneal thicknesses were greater in both diabetic and non-diabetic patients 1 week postoperatively than in later follow up, while there were no differences in corneal thickness according to phaco-time or diabetic status. Nevertheless, most studies17,32,33,45,47 mentioned a delayed recovery of postoperative corneal edema in diabetics compared to normal controls. This analysis observed significant differences between the two groups at all postoperative times from 1 day to 3 months. For the postoperative changes, the dCCT% followed the same trend as dCV. Severe postoperative responses and long recovery times in the diabetic group are shown by the analysis in Fig. 3. There was a significant difference found at 1 month postoperatively. It can be inferred that this is because, at an early time after phacoemulsification, both DM and non-DM patients have severe responses and sharp increases due to the breakdown of corneal endothelial function caused by the surgical procedure, thus making the difference between the two groups too small to be distinguished (P = 0.28, P = 0.08, Fig. 9). Furthermore, studies have proven that hyperglycemia enhance the expression of MMPs54, the production and activity of which is likely to damage the basement membrane, including type IV collagen, and limit epithelial cell migration, resulting in poor epithelial healing55. Gradually, the corneas of non-diabetic patients start to heal more quickly, showing a smaller CCT compared to the DM group, especially at 1 month postoperatively (P = 0.003, Fig. 9). Finally, differences due to the effect of surgery vanish 3 months postoperatively (P = 0.15, Fig. 9), which means DM patients can take almost 3 months to recover.
Visual acuity
Besides all of the changes in the cornea, visual rehabilitation is still the top concern for patients undergoing phacoemulsification. Best corrected visual acuity (BCVA) is one of the best parameters for evaluating the quality and efficiency of a surgical technique. Although CCT values were significantly different between the two groups after phacoemulsification, there was no difference in visual acuity in the long-term comparison as reported27,33,45. However, the BCVA of the non-diabetic group was better at 1 week postoperatively33, indicating that the diabetic achieve worse vision recovery, which is consistent with the CCT results. Eventually, patients in both groups had better postoperative visual acuity at the end of the follow-up period, which indicates that phacoemulsification should be considered as a safe procedure for cataract extraction in the diabetic.
As a consequence, greater efforts and concentration should be made by the surgeon to minimize surgical trauma, especially for the diabetic. To achieve that, phaco-power near the cornea should be avoided. A viscoelastic agent could be generously used to cushion the endothelium as well. What’s more, close postoperative observation and intervention is suggested in patients with transient corneal edema and decompensation, as it can be a predicted factor for the development of pseudophakic cystoid macular edema56. Since the duration of DM and blood glucose have proven to be associated with the severity of corneal damage caused by phacoemulsification29,48, diabetic patients are recommended to choose the proper timing when good glycemic and HbA1c control is achieved for cataract surgery35,48, thereby preventing further complications and minimizing visual loss. Femtosecond laser-assisted cataract surgery is currently reported to be safer and more effective in reducing endothelial cell loss and postoperative central corneal thickening and achieving better visual and refractive outcomes compared to conventional phacoemulsification surgery. Therefore, it might be a potentially better choice for the diabetic. Further studies are needed to validate this hypothesis.
To the best of our knowledge, this is the first meta-analysis and review of corneal changes after phacoemulsification in diabetic and non-diabetic patients. Not only the postoperative state but also the changes between preoperative and postoperative states, which have an advantage over the former, are evaluated. In addition, the dynamic healing process and the changes of these parameters are carefully demonstrated in this study with at least three studies in each analysis to give a rational analysis result. We offer a systematic evaluation as well as possible mechanisms and treatment to the clinic.
Inevitably, this meta-analysis has several limitations. First, the limitations came from the clinical trial itself. It was not possible to have a randomized control trial (RCT) as diabetic patients are aware of their condition and diabetic group naturally exists. Cohort studies, which are not as reliable as RCTs, were therefore included in this meta-analysis. Secondly, the duration of diabetes for the diabetic patients, the surgical conditions, the surgeons, and the data collection techniques all work together to make some of the outcomes not uniform. Thirdly, most of the patients in the included studies are from Asia, which might be a potential source of deviations as corneal biomechanics may vary among races57,58.
Method
Search strategy
PubMed, EMBASE, and the Cochrane Controlled Trials Register were searched for relevant literature dated up to Jan 2017. The following terms were used to search for prospective studies in the selected databases: ((diabete OR diabetes) AND cataract surgery) AND corneal; ((‘cataract extraction’/exp OR ‘cataract extraction’) AND ‘diabetes mellitus’/exp OR ‘diabetes mellitus’) AND corneal; “diabetes” AND “cataract surgery” AND “corneal”. The bibliographies of the relevant review and original research articles were also scanned for potential trials that may have been missed in the primary searches.
Study selection
The inclusion criteria for our selection process were set as follows: 1) Prospective controlled study, 2) the study included DM patients and normal patients who underwent phacoemulsification and IOL implantation, 3) the study reported at least one basic dataset of corneal properties, such as ECD, CV, HC%, and CCT, 4) the patients in the trials were absent of additional underlining diseases or eye disorders other than diabetes and cataract. Patients with other complications that could affect corneal state (e.g. severe liver or kidney dysfunction, glaucoma, iritis, or eye injury) were excluded.
Screening process
Two reviewers, working independently from each other, first conducted preliminary reviews of the titles and abstracts; then, the full articles were analyzed to select the studies that met our predefined criteria. Disagreements between the two reviewers were resolved through careful discussion, involving a third or fourth reviewer when necessary, until a consensus was reached.
Quality assessment
The Newcastle–Ottawa scale (NOS) was used for quality assessment. The NOS contains eight items (nine scores in total) which fit into three categories: selection (four scores), comparability (two scores), and exposure of a case-control study or outcome of a cohort study (three scores). A score ≥6 indicates good quality.
Data extraction process
The patient data was extracted from the selected studies via a standard form: first author, country (province), year of publication, age of patient, sex of patient, follow up duration, quality control, and preoperative diabetes condition. The second reviewer double-checked all data.
The measurement of corneal properties included corneal endothelial cell density (ECD), corneal endothelial hexagon percentage (HC%), corneal endothelial coefficient of variation (CV), and central corneal thickness (CCT). Most of the studies only reported the absolute values of the outcomes at a preoperative baseline and postoperative time points. The mean and standard deviation outcomes of the corneal changes were calculated as follows:
| 1 |
| 2 |
where ρ is the covariance coefficient, pre and post are short for preoperative and postoperative state. Generally, ρ was treated as ~0.5. The mean change percentages were calculated according to:
| 3 |
For situations when the selected study included multiple groups, a group-combining method59 was used in this meta-analysis to create a single pair-wise comparison. Considering a two-group combining process in which group 1 has a sample size of N 1, a mean outcome of M 1, and a standard derivation of SD1, and group 2 has similar (N2, M2, and SD 2), the combined group 1 + 2 would be calculated as:
| 4 |
| 5 |
If there were more than two groups to combine, the strategy was to repeat this method sequentially (i.e. combine group 1 and group 2 to create group 1 + 2, and then combine group 1 + 2 and group 3 to create group 1 + 2 + 3, and so on).
Statistical analysis
The statistical analysis was performed using Review Manager 5.3. The weighted mean difference (WMD) and 95% confidence interval (CI) were calculated from selected outcomes. P < 0.05 was considered statistically significant. Statistical heterogeneity was tested using the chi-squared and I 2 tests. A random-effect meta-regression model was used when significant heterogeneity (I 2 > 50%) or clinical divergence were found. Otherwise, a fixed-effect meta-regression model was chosen. Publication bias was measured in Begg’s and Egger’s test using Stata 14. To evaluate the stability and reliability of our pooled outcomes, a sensitivity analysis was performed using a one-study-removed analysis to assess whether the results were affected by the excessive weight of a single study.
Electronic supplementary material
Acknowledgements
This study was supported by Program of National Natural Science Foundation of China (No. 81371001), Program of National Natural Science Foundation (No. 81570822), Zhejiang Key LaboratoryFund of China (No. 2011E10006), Project of National Clinical Key Discipline of Chinese Ministry of Health, Zhejiang Province Key Research and Development Program (2015C03042).
Author Contributions
K.Y. and Y.Z.T. designed this study. Y.Z.T., X.Y.C., X.B.Z., Q.M.T. and S.Y.L. collected and double checked the data. Y.Z.T. and X.Y.C. carried out the statistical analysis. Y.Z.T. wrote the paper. K.Y. and X.Y.C. provided critical revision to the article. All author participated in revision and approved the final version for submission.
Competing Interests
The authors declare that they have no competing interests.
Footnotes
Electronic supplementary material
Supplementary information accompanies this paper at 10.1038/s41598-017-14656-7.
Publisher's note: Springer Nature remains neutral with regard to jurisdictional claims in published maps and institutional affiliations.
References
- 1.International Diabetes Federation (IDF). IDF Diabetes Atlas 7th Edition. http://www.diabetesatlas.org/ (2015).
- 2.Wild S, Roglic G, Green A, Sicree R, King H. Global Prevalence of Diabetes: estimates for the year 2000 and projections for 2030. Diabetes Care. 2004;27:1047. doi: 10.2337/diacare.27.5.1047. [DOI] [PubMed] [Google Scholar]
- 3.Shaw JE, Sicree RA, Zimmet PZ. Global estimates of the prevalence of diabetes for 2010 and 2030. Diabetes Res Clin Pract. 2010;87:4–14. doi: 10.1016/j.diabres.2009.10.007. [DOI] [PubMed] [Google Scholar]
- 4.Alberti, K. G. & Zimmet, P. Z. Definition, diagnosis and classification of diabetes mellitus and its complications. Part 1: diagnosis and classification of diabetes mellitus provisional report of a WHO consultation. Diabetic medicine: a journal of the British Diabetic Association15, 539–553, 10.1002/(sici)1096-9136(199807)15:7<39::aid-dia668<3.0.co;2-s (1998). [DOI] [PubMed]
- 5.Srinivas SP. Dynamic Regulation of Barrier Integrity of the Corneal Endothelium. Optometry and vision science: official publication of the American Academy of Optometry. 2010;87:E239–E254. doi: 10.1097/OPX.0b013e3181d39464. [DOI] [PMC free article] [PubMed] [Google Scholar]
- 6.Lutty GA. Effects of diabetes on the eye. Investigative ophthalmology & visual science. 2013;54:Orsf81–87. doi: 10.1167/iovs.13-12979. [DOI] [PMC free article] [PubMed] [Google Scholar]
- 7.Browning, D. J. Diabetic Retinopathy Evidence-Based Management. (Springer New York, 2010).
- 8.Matsuda M, et al. The effects of aldose reductase inhibitor on the corneal endothelial morphology in diabetic rats. Current eye research. 1987;6:391–397. doi: 10.3109/02713688709025192. [DOI] [PubMed] [Google Scholar]
- 9.Datiles MB, Kador PF, Kashima K, Kinoshita JH, Sinha A. The effects of sorbinil, an aldose reductase inhibitor, on the corneal endothelium in galactosemic dogs. Investigative ophthalmology & visual science. 1990;31:2201–2204. [PubMed] [Google Scholar]
- 10.Ramamurthi S, Rahman MQ, Dutton GN, Ramaesh K. Pathogenesis, clinical features and management of recurrent corneal erosions. Eye (London, England) 2006;20:635–644. doi: 10.1038/sj.eye.6702005. [DOI] [PubMed] [Google Scholar]
- 11.Ljubimov AV, et al. Human corneal epithelial basement membrane and integrin alterations in diabetes and diabetic retinopathy. The journal of histochemistry and cytochemistry: official journal of the Histochemistry Society. 1998;46:1033–1041. doi: 10.1177/002215549804600907. [DOI] [PubMed] [Google Scholar]
- 12.Khairallah M, et al. Number of People Blind or Visually Impaired by Cataract Worldwide and in World Regions, 1990 to 2010Worldwide Prevalence of Cataract, 1990–2010. Investigative ophthalmology & visual science. 2015;56:6762–6769. doi: 10.1167/iovs.15-17201. [DOI] [PubMed] [Google Scholar]
- 13.Lee CM, Afshari NA. The global state of cataract blindness. Current opinion in ophthalmology. 2017;28:98–103. doi: 10.1097/ICU.0000000000000340. [DOI] [PubMed] [Google Scholar]
- 14.Diaz-Valle D, Benitez del Castillo Sanchez JM, Castillo A, Sayagues O, Moriche M. Endothelial damage with cataract surgery techniques. Journal of cataract and refractive surgery. 1998;24:951–955. doi: 10.1016/S0886-3350(98)80049-7. [DOI] [PubMed] [Google Scholar]
- 15.Walkow T, Anders N, Klebe S. Endothelial cell loss after phacoemulsification: relation to preoperative and intraoperative parameters. Journal of cataract and refractive surgery. 2000;26:727–732. doi: 10.1016/S0886-3350(99)00462-9. [DOI] [PubMed] [Google Scholar]
- 16.Dick HB, Kohnen T, Jacobi FK, Jacobi KW. Long-term endothelial cell loss following phacoemulsification through a temporal clear corneal incision. Journal of cataract and refractive surgery. 1996;22:63–71. doi: 10.1016/S0886-3350(96)80272-0. [DOI] [PubMed] [Google Scholar]
- 17.Morikubo S, Takamura Y, Kubo E, Tsuzuki S, Akagi Y. Corneal changes after small-incision cataract surgery in patients with diabetes mellitus. Archives of ophthalmology (Chicago, Ill.: 1960) 2004;122:966–969. doi: 10.1001/archopht.122.7.966. [DOI] [PubMed] [Google Scholar]
- 18.Lee JS, Lee JE, Choi HY, Oum BS, Cho BM. Corneal endothelial cell change after phacoemulsification relative to the severity of diabetic retinopathy. Journal of cataract and refractive surgery. 2005;31:742–749. doi: 10.1016/j.jcrs.2004.09.035. [DOI] [PubMed] [Google Scholar]
- 19.Li MH, Fu XL, Yang WF. Effect and risk factors for corneal endothelial cells after phacoemulsification in diabetic cataract patients. International Eye Science. 2016;16:1048–1051. [Google Scholar]
- 20.Beltrame G, Salvetat ML, Driussi G, Chizzolini M. Effect of incision size and site on corneal endothelial changes in cataract surgery. Journal of cataract and refractive surgery. 2002;28:118–125. doi: 10.1016/S0886-3350(01)00983-X. [DOI] [PubMed] [Google Scholar]
- 21.Chen X, Chen K, He J, Yao K. Comparing the Curative Effects between Femtosecond Laser-Assisted Cataract Surgery and Conventional Phacoemulsification Surgery: A Meta-Analysis. PLoS ONE. 2016;11:e0152088. doi: 10.1371/journal.pone.0152088. [DOI] [PMC free article] [PubMed] [Google Scholar]
- 22.Bikbova G, Oshitari T, Tawada A, Yamamoto S. Corneal changes in diabetes mellitus. Current diabetes reviews. 2012;8:294–302. doi: 10.2174/157339912800840479. [DOI] [PubMed] [Google Scholar]
- 23.Bourne RR, et al. Effect of cataract surgery on the corneal endothelium: modern phacoemulsification compared with extracapsular cataract surgery. Ophthalmology. 2004;111:679–685. doi: 10.1016/j.ophtha.2003.07.015. [DOI] [PubMed] [Google Scholar]
- 24.Doughty MJ, Zaman ML. Human corneal thickness and its impact on intraocular pressure measures: a review and meta-analysis approach. Survey of ophthalmology. 2000;44:367–408. doi: 10.1016/S0039-6257(00)00110-7. [DOI] [PubMed] [Google Scholar]
- 25.Lundberg B, Jonsson M, Behndig A. Postoperative corneal swelling correlates strongly to corneal endothelial cell loss after phacoemulsification cataract surgery. American journal of ophthalmology. 2005;139:1035–1041. doi: 10.1016/j.ajo.2004.12.080. [DOI] [PubMed] [Google Scholar]
- 26.Altintas AG, Yilmaz E, Anayol MA, Can I. Comparison of corneal edema caused by cataract surgery with different phaco times in diabetic and non-diabetic patients. Annals of ophthalmology (Skokie, Ill.) 2006;38:61–65. doi: 10.1385/AO:38:1:61. [DOI] [PubMed] [Google Scholar]
- 27.Misra SL, Goh YW, Patel DV, Riley AF, McGhee CNJ. Corneal microstructural changes in nerve fiber, endothelial and epithelial density after cataract surgery in patients with diabetes mellitus. Cornea. 2015;34:177–181. doi: 10.1097/ICO.0000000000000320. [DOI] [PubMed] [Google Scholar]
- 28.Zhu N, Zhang ZC, Hao XL. Influence of phacoemulsification on corneal endothelial cell of cataract patients with diabetes or hypertension. International Eye Science. 2014;14:480–483. [Google Scholar]
- 29.Yan AM, Chen FH. Phacoemulsification on corneal endothelium cells in diabetic patients with different disease duration. International Eye Science. 2014;14:1786–1789. [Google Scholar]
- 30.Su C, Liu D. Clinical observation of changes of corneal endothelial cells before and after the cataract ultrasonic emulsification for diabetics. International Eye Science. 2014;14:273–275. [Google Scholar]
- 31.Liu J, et al. Study on corneal endothelial cells after phacoemulsification. International Eye Science. 2014;14:2247–2249. [Google Scholar]
- 32.Zhao C, et al. Changes of corneal endothelium in diabetes patients after cataract phacoemulsification surgery by confocal microscopy. International Eye Science. 2013;13:876–879. [Google Scholar]
- 33.Wang B, Li JX, Wang YL, Wu BG, Huo JX. Clinical effect analysis of phacoemulsification on cataract patients with diabetes mellitus. International Eye Science. 2013;13:1163–1166. [Google Scholar]
- 34.Yang R, et al. The influence of phacoemulsification on corneal endothelial cells at varying blood glucose levels. Eye science. 2011;26:91–95. doi: 10.3969/j.issn.1000-4432.2011.02.018. [DOI] [PubMed] [Google Scholar]
- 35.Hugod M, et al. Corneal endothelial cell changes associated with cataract surgery in patients with type 2 diabetes mellitus. Cornea. 2011;30:749–753. doi: 10.1097/ICO.0b013e31820142d9. [DOI] [PubMed] [Google Scholar]
- 36.Wu LA, Zhang L, Wang CY, Yang XG. Study on corneal endothelial cells after phacoemulsification in diabetic cataract. International Journal of Ophthalmology. 2010;10:1290–1293. [Google Scholar]
- 37.Wu ZD, Zhong JX, Mai SL, Zheng M, Zheng K. Influence of cataract phacoemulsification on corneal endothelial cells in diabetes. International Journal of Ophthalmology. 2008;8:1908–1909. [Google Scholar]
- 38.Inoue K, et al. Corneal endothelial cell morphology in patients undergoing cataract surgery. Cornea. 2002;21:360–363. doi: 10.1097/00003226-200205000-00006. [DOI] [PubMed] [Google Scholar]
- 39.Lee JS, Oum BS, Choi HY, Lee JE, Cho BM. Differences in corneal thickness and corneal endothelium related to duration in diabetes. Eye (London, England) 2006;20:315–318. doi: 10.1038/sj.eye.6701868. [DOI] [PubMed] [Google Scholar]
- 40.Ohguro N, Matsuda M, Ohashi Y, Fukuda M. Topical aldose reductase inhibitor for correcting corneal endothelial changes in diabetic patients. The British journal of ophthalmology. 1995;79:1074–1077. doi: 10.1136/bjo.79.12.1074. [DOI] [PMC free article] [PubMed] [Google Scholar]
- 41.Herse PR. Corneal hydration control in normal and alloxan-induced diabetic rabbits. Investigative ophthalmology & visual science. 1990;31:2205–2213. [PubMed] [Google Scholar]
- 42.Schultz RO, Matsuda M, Yee RW, Edelhauser HF, Schultz KJ. Corneal endothelial changes in type I and type II diabetes mellitus. American journal of ophthalmology. 1984;98:401–410. doi: 10.1016/0002-9394(84)90120-X. [DOI] [PubMed] [Google Scholar]
- 43.Joyce NC. Proliferative capacity of corneal endothelial cells. Experimental eye research. 2012;95:16–23. doi: 10.1016/j.exer.2011.08.014. [DOI] [PMC free article] [PubMed] [Google Scholar]
- 44.Furuse N, Hayasaka S, Yamamoto Y, Setogawa T. Corneal endothelial changes after posterior chamber intraocular lens implantation in patients with or without diabetes mellitus. The British journal of ophthalmology. 1990;74:258–260. doi: 10.1136/bjo.74.5.258. [DOI] [PMC free article] [PubMed] [Google Scholar]
- 45.Dhasmana R, Singh IP, Nagpal RC. Corneal changes in diabetic patients after manual small incision cataract surgery. Journal of clinical and diagnostic research: JCDR. 2014;8:Vc03–vc06. doi: 10.7860/JCDR/2014/7955.4288. [DOI] [PMC free article] [PubMed] [Google Scholar]
- 46.Schultz RO, Glasser DB, Matsuda M, Yee RW, Edelhauser HF. Response of the corneal endothelium to cataract surgery. Archives of ophthalmology (Chicago, Ill.: 1960) 1986;104:1164–1169. doi: 10.1001/archopht.1986.01050200070053. [DOI] [PubMed] [Google Scholar]
- 47.Mathew PT, David S, Thomas N. Endothelial cell loss and central corneal thickness in patients with and without diabetes after manual small incision cataract surgery. Cornea. 2011;30:424–428. doi: 10.1097/ICO.0b013e3181eadb4b. [DOI] [PubMed] [Google Scholar]
- 48.Wan BB, Xu J. Changes of corneal endothelial cell after phacoemulsification for patients with different preoperative level of HbA1c. International Eye Science. 2015;15:1158–1160. [Google Scholar]
- 49.Kotecha A, et al. Corneal biomechanical characteristics in patients with diabetes mellitus. Journal of cataract and refractive surgery. 2010;36:1822–1828. doi: 10.1016/j.jcrs.2010.08.027. [DOI] [PubMed] [Google Scholar]
- 50.Marano CW, Matschinsky FM. Biochemical manifestations of diabetes mellitus in microscopic layers of the cornea and retina. Diabetes/metabolism reviews. 1989;5:1–15. doi: 10.1002/dmr.5610050102. [DOI] [PubMed] [Google Scholar]
- 51.Narayanan S. Aldose reductase and its inhibition in the control of diabetic complications. Annals of clinical and laboratory science. 1993;23:148–158. [PubMed] [Google Scholar]
- 52.Jacot JL, Hosotani H, Glover JP, Lois N, Robison WG., Jr. Diabetic-like corneal sensitivity loss in galactose-fed rats ameliorated with aldose reductase inhibitors. Journal of ocular pharmacology and therapeutics: the official journal of the Association for Ocular Pharmacology and Therapeutics. 1998;14:169–180. doi: 10.1089/jop.1998.14.169. [DOI] [PubMed] [Google Scholar]
- 53.Murata T, et al. The relationship between accumulation of advanced glycation end products and expression of vascular endothelial growth factor in human diabetic retinas. Diabetologia. 1997;40:764–769. doi: 10.1007/s001250050747. [DOI] [PubMed] [Google Scholar]
- 54.Takahashi H, et al. Matrix metalloproteinase activity is enhanced during corneal wound repair in high glucose condition. Current eye research. 2000;21:608–615. doi: 10.1076/0271-3683(200008)2121-VFT608. [DOI] [PubMed] [Google Scholar]
- 55.Woessner JF., Jr. Matrix metalloproteinases and their inhibitors in connective tissue remodeling. FASEB journal: official publication of the Federation of American Societies for Experimental Biology. 1991;5:2145–2154. [PubMed] [Google Scholar]
- 56.Do JR, Oh JH, Chuck RS, Park CY. Transient corneal edema is a predictive factor for pseudophakic cystoid macular edema after uncomplicated cataract surgery. Korean journal of ophthalmology: KJO. 2015;29:14–22. doi: 10.3341/kjo.2015.29.1.14. [DOI] [PMC free article] [PubMed] [Google Scholar]
- 57.Chidambaram, P. Corneal Biomechanics as a Function of Race, The Ohio State University, (2017).
- 58.Leite, M. T. et al. Comparison of corneal biomechanical properties between healthy blacks and whites using the Ocular Response Analyzer. American journal of ophthalmology150, 163–168, e161 (2010). [DOI] [PMC free article] [PubMed]
- 59.Higgins, j. P. & Green, S. Cochrane Handbook for Systematic Reviews of Interventions (2011).
Associated Data
This section collects any data citations, data availability statements, or supplementary materials included in this article.


