

Abstract
Gastrin-secreting enteroendocrine cells (G cells) in the antrum play an important role in the regulation of gastric secretion, gastric motility and mucosal cell proliferation. Recently we have uncovered the existence of two subpopulations of G cells with pivotally different morphology and a distinct localization in the antral invaginations; the functional implications of the different G cell types are still elusive. In this study a transgenic mouse line in which EGFP is expressed under the control of a gastrin promoter was used to elucidate the distribution pattern of the two G cell types throughout the different regions of the antrum. The results of immunohistochemical analyses revealed that G cells were not equally distributed along the anterior/posterior axis of the antrum. The “typical” pyramidal- or roundish-shaped G cells, which are located in the basal region of the antral invaginations, were more abundant in the proximal antrum bordering the corpus region but less frequent in the distal antrum bordering the pylorus. In contrast, the “atypical” G cells, which are located in the upper part of the antral invaginations and have a spindle-like contour with long processes, were evenly distributed along the anterior/posterior axis. This characteristic topographic segregation supports the notion that the two G cell types may serve different functions. A comparison of the antrum specific G cells with the two pan-gastrointestinal enteroendocrine cell types, somatostatin-secreting D cells and serotonin-secreting enterochromaffin (EC) cells, revealed a rather similar distribution pattern of G and D cells, but a fundamentally different distribution of EC cells. These observations suggest that distinct mechanisms govern the spatial segregation of enteroendocrine cells in the antrum mucosa.
Key words: Antrum mucosa, G cells, morphology, enteroendocrine cells, topographic distribution
Introduction
The murine stomach is the first compartment of the gastrointestinal tract acting as a reservoir and initiating gastrointestinal secretion and motility. The gastric mucosa is structured either as a planar surface epithelium or tubular invaginations of the surface epithelium called pits, or tubular extensions of the pits called glands.1 These invaginations are lined mainly by epithelial surface mucous cells and mucous neck cells interspersed by some more specialized cell types, including acid-producing parietal cells, zymogenic (chief) cells, and hormone- secreting enteroendocrine cells (EECs). To maintain the barrier function and eliminate damaged cells, the gastric epithelium undergoes a strictly regulated continuous renewal. All five different epithelial cell types seem to originate from multipotent stem cells, however, fate and life time of the cell types vary considerably. 1,2 In contrast to columnar and mucous cells, for EECs in the stomach the turnover time was found to be in the order of 45 to 60 days,3 indicating that EECs do not share the turnover characteristics with other cell types of the epithelium, thus represent a cell population independent of other cell lineages. Although the EECs are by far outnumbered by the other cell types, they, nevertheless, play a key role in controlling and regulating many important functions in the gastrointestinal tract, all necessary to perform the main task; digestion of ingested food and absorption of nutrients. EECs are dispersed among the epithelial cells of the mucosa and relatively little is known about how these cells segregate from their precursor cells as they terminally differentiate and where they are finally localized within the epithelial layer. This lack of information may partially be due to the fact that an investigation of these solitary endocrine cells which are dispersed along the gastric mucosa is much more difficult than studying endocrine cells in specialized tissues, such as the pancreatic islets or adrenals. However, in recent years, the availability of high efficient antibodies and especially of transgenic enteroendocrine reporter mouse models has opened a new chapter for the characterization of this rare cell type.4
Utilizing a mGAS-EGFP transgenic mouse line generated by Takaishi5 we have recently began to characterize the major EEC type in the antrum region, the gastrinsecreting G cells. In the course of this we uncovered that individual G cells show pivotal differences in their morphology and their localization in the epithelium lining the tubular invaginations.6 The functional implications of these different G cell types are still elusive. Towards a further characterization of these cells, in this study attempts have been made to elucidate the distribution of the two G cell types, not only along an individual antral tubular gland, but rather throughout the different regions of the antrum. In addition, the distribution pattern of gastrin-secreting G-cells and the number of somatostatin-secreting D cells was determined. A comparison of G and D cells was of special interest, since both cell types apparently derive from a common multihormonal G/D precursor cell type.7-9
Materials and Methods
Mice
Analyses were performed with the BAC-transgenic mouse line mGas-EGFP which expresses EGFP under the control of the gastrin promoter.5 Mice were housed with a 12 h light/dark cycle in groups or individually at the Central Unit for Animal Research at the University of Hohenheim and had access to food and water ad libitum. Experiments were carried out in accordance with the Council Directive 2010/63EU of the European Parliament and the Council of 22 September 2010 on the protection of animals used for scientific purposes. The work was approved by the Committee on the Ethics of Animal Experiments at the Regierungsprasidium Stuttgart (V318/14 Phy) and the University of Hohenheim Animal Welfare Officer (T125/14 Phy, T126/14 Phy). Six mice were used for the quantification of G cell subtypes and for determining G cell distribution patterns. Topographic distribution patterns and the number of D and EC cells were determined for three mice each.
Tissue preparation
For immunohistochemistry both immersion and perfusion fixation processes were used. For perfusion fixation animals were killed with carbon dioxide and tissues were fixed using 4% paraformaldehyde perfused via the vascular system. Then, an incision through the integument and abdominal wall was made and the rib cage was carefully opened to expose the heart. To prepare the mouse for the perfusion, a needle was introduced into the left ventricle and an incision to the right atrium was made. Using the perfusion needle, first 10 mL ice-cold 1x PBS (0.85% NaCl, 1.4 mM KH2PO4, 8 mM Na2HPO4, pH 7.4) were applied followed by 3x10 mL ice-cold 4% paraformaldehyde (in 150 mM phosphate buffer, pH 7.4). After perfusion, the abdomen was opened and the stomach was removed. For immersion fixation this step immediately followed the sacrifice. Next, the fundic tissue was cut off, the stomach was opened along the lesser curvature and washed with ice-cold 1x PBS (0.85% NaCl, 1.4 mM KH2PO4, 8 mM Na2HPO4, pH 7.4). The antral tissue and the adjacent corpus, pyloric and duodenal tissue was mounted on a piece of rubber and immersed in 4% ice-cold paraformaldehyde (in 150 mM phosphate buffer, pH 7.4) for 1 h. After fixation, the tissue was cryoprotected by incubation in 25% sucrose overnight at 4°C. Finally, the tissue was embedded in Tissue Freezing Medium (Leica Microsystems, Bensheim, Germany) and quickly frozen on dry ice or liquid nitrogen. Cryosections (8-μm) were generated using a CM3050S cryostat (Leica Microsystems) and adhered to Superfrost Plus microscope slides (Menzel Glaser, Braunschweig, Germany).
Immunohistochemistry
Cryosections were air-dried, rinsed in 1x PBS for 10 min at room temperature and blocked in 0.5% Triton X-100 in 1x PBS containing 10% normal donkey serum (NDS; Dianova, Hamburg, Germany) for 30 min at room temperature. For single- and double-labeling experiments, primary antibodies were diluted in 0.5% Triton X-100 in 1x PBS containing 10% NDS. Antibodies were used in the following dilutions: goat anti-somatostatin (sc-7819, Santa Cruz, Dallas, TX, USA) 1:1000, rabbit anti-serotonin (5-HT) (S5545, Sigma Aldrich, Schnelldorf, Germany) 1:500, rabbit antihistamine (11425, PROGEN Biotechnik GmbH, Heidelberg, Germany) 1:500 and rabbit anti-smoothelin (sc-28562, Santa Cruz) 1:200. Blocked sections were incubated with the diluted primary antibodies overnight at 4°C. After washing in 1x PBS, the bound primary antibodies were visualized using Donkey anti-Goat IgG (H+L) Secondary Antibody, Alexa Fluor 568, Invitrogen™ (10463972, Fisher Scientific, Goteborg, Sweden) 1:500 and Donkey anti- Rabbit IgG (H+L) Secondary Antibody, Alexa Fluor 568, Invitrogen™ (10617183, Fisher Scientific) diluted in 1x PBS with 0.5% Triton X-100 containing 10% NDS for 2 h at room temperature. After three rinses for 5 min in 1x PBS, tissue sections were counterstained with 4′,6-diamidino-2- phenylindole (DAPI; 1.0 μg/mL, Sigma Aldrich) 1:1000. After incubation for 3 min at room temperature, sections were rinsed with double-distilled water and mounted in MOWIOL (10% polyvinyl alcohol 4-88 (Sigma Aldrich), 20% glycerol in 1x PBS). No immunoreactivity could be observed when the primary antibodies were omitted.
Microscopy and photography
Immunhistochemical staining was documented using a Zeiss Axiophot microscope (Carl Zeiss MicroImaging, Jena, Germany) or a Zeiss LSM510 Meta laser scanning microscope (Zeiss, Oberkochen, Germany). For determining cell numbers, the 10x objective was used. Images were adjusted for contrast in AxioVision LE Rel. 4.3 (Carl Zeiss MicroImaging).
Determining distribution patterns and numbers of EECs
For determining the total number of cells on longitudinal tissue sections through the antral mucosa, DAPI-stained nuclei were counted. ImageJ 1.48v (Wayne Rasband, National Institutes of Health, USA) and the plugin ITCN (Image-based Tool for Counting Nuclei) were utilized. For automated counting of nuclei, images were converted into 8-bit images and nuclei of the submucosa were removed manually, using the eraser tool. ITCN parameters were adjusted to 0.7 (Threshold) and 8.0 (Width) before running the plugin.
Numbers of G, D and EC cells were counted manually using ZEN 2012 (Carl Zeiss Microscopy GmbH, Jena, Germany). Roundish-shaped EECs in the lower third of the antral invaginations were assigned to the “basal region”, spindle-shaped EECs in the upper two-thirds to the “upper region”.
Cell numbers were quantified per 1000 nuclei, rather than per gland. Determining cell numbers within single glands would require a different experimental setting in which thicker tissue sections are needed to actually include the entire gland in its 3- dimensional structure. Thus, evaluating cell numbers in single glands on thin-layer tissue sections would result in biased data. As cell numbers do not increase with increasing gland height, we are confident that our method of quantification is suitable for the purpose of determining topographic distribution patterns of antral EECs. Interindividual differences are indicated by standard deviations illustrated as error bars.
Results
G cells serve as a marker for the antral region of the mouse stomach
As a prerequisite for exploring the distribution patterns of EECs within the antrum mucosa it was necessary to determine what defines the beginning and end of the antral region. The antral region of the mouse stomach is macroscopically distinct from the region of the corpus based on different gland types.10 In addition, the distribution pattern of distinct EEC types, notably G cells and enterochromaffin-like (ECL) cells, might be used to mark particular regions of the stomach. To visualize the location of the two EEC types, longitudinal tissue sections through the stomach of the transgenic mGas-EGFP mouse line were prepared for immunohistochemical staining. G cells were visible due to their intrinsic EGFP fluorescence; ECL cells were visualized using a specific antibody for histamine. As shown in Figure 1A and C, the topographic distribution patterns of the two EEC types did not overlap; while histamine- immunopositive ECL cells were restricted to the corpus (Figure 1C), G cells were exclusively found in the antrum. Thus, the clear segregation of the two EEC types marks the structurally and functionally different regions of the stomach. In order to determine the transitional region from the antrum to the small intestine, the pyloric sphincter was stained using a specific antibody for smoothelin which labels the strong ring of smooth muscles (Figure 1 C,D). Thereby, it became evident that G cells were present only in the antral epithelium; the distribution of G cells terminated just before the pyloric region. These observations indicate that G cells are clearly confined to the antral region of the stomach and thus may serve as a specific marker for this particular compartment of the gastrointestinal tract.
Figure 1.
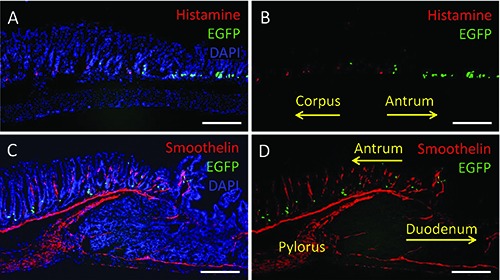
G cells are clearly confined to the antral region of the stomach. A-D) Longitudinal tissue sections of the antrum and the adjacent gastrointestinal tissues derived from mGAS-EGFP transgenic mice are shown; G cells are visible due to their intrinsic EGFP fluorescence (green). Tissue sections were immunostained using specific antibodies for histamine (A,B) and smoothelin (C,D) both labeled in red. A,C) To visualize the gastrointestinal tissues all cells were counterstained with DAPI (blue). A,B) The transition from the corpus to antrum (indicated by the yellow arrows) can be clearly determined by labeling ECL cells and G cells; both EEC populations are found in distinct compartments of the stomach and do not overlap; histamine-immunopositive cells are found in the corpus but absent in the antrum while EGFP-positive G cells are only present in the antrum. C,D) The transition from the antrum to the duodenum (indicated by the yellow arrows) can be visualized by labeling smooth muscle cells of the pylorus which separates the stomach from the small intestine; EGFP-positive G cells are scattered throughout the antrum reaching the pyloric region but are absent in the duodenum. Scale bars: 200 μm.
G cells are unevenly segregated across the proximal and distal antrum
In order to explore the topographic distribution pattern of G cells along the anterior/ posterior axis, from the proximal to the distal region of the antrum, longitudinal tissue sections of the antral epithelium were counterstained by DAPI (n=6). Upon closer inspection it appeared that the morphology of the antral mucosa differed along the length of the antrum; from the proximal antrum (adjacent to the corpus) to the distal antrum (just before the transition to the small intestine), gland height increased, while cell numbers seemed to decrease (Figure 2A). Analyses of the tissue sections for EGFP-positive G cells revealed that the cells were not evenly distributed along the length of the antrum, but became less frequent from proximal to distal. As visible in Figure 2 B,C, in the proximal region (Figure 2B), the number of G cells was higher than in the distal antrum (Figure 2C). The number of G cells in the proximal antrum, starting at the very first G cell, amounted to 25.08±7.58 (Figure 2D) while only 13.77±4.13 G cells were found in the distal antrum, which was defined by the very last G cell (Figure 2E). These findings demonstrate that G cells were not evenly distributed along the length of the antrum, but were less frequent in the distal antrum compared to the proximal antrum.
Figure 2.
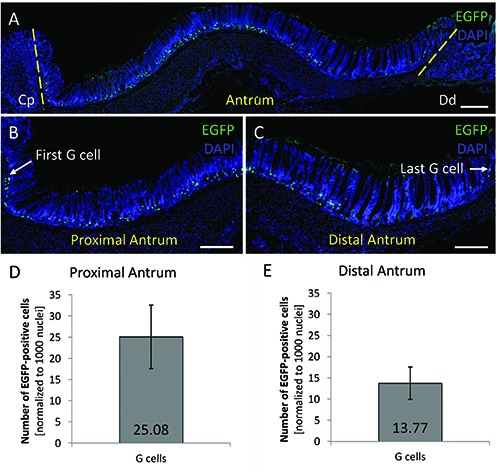
G cells are less frequent in the distal antrum compared to the proximal antrum. A-C) Longitudinal tissue sections of the antrum of mGAS-EGFP transgenic mice are shown; G cells are visualized by green fluorescence; tissue sections were counterstained with DAPI (blue). A) The antral mucosa differs along the length of the antrum. Likewise, G cells were not evenly distributed. B,C) When counting G cells in the proximal (B) and distal antrum (C), normalized to 1000 nuclei 25.08±7.58 (D) and 13.77±4.13 G cells (E) were found in the mucosa of the proximal and distal antrum respectively. Scale bars: 200 μm.
Topographic distribution pattern of the two G cell subtypes
As initially observed in our previous study,6 G cells differed in their morphology and their localization within the antral invaginations (Figure 3A). While basally located G cells were pyramidal- or roundish-shaped (Figure 3B), G cells in the upper region of the invaginations had a spindle-like contour and long processes (Figure 3C). Gastrin expression in both EGFP-positive G cell subtypes was confirmed by immunolabeling for gastrin (data not shown). Subsequently, the distribution pattern of the two G cell subtypes along the anterior/posterior axis was determined (n=6). For the pyramidal-/roundish-shaped G cells in the basal region (Figure 3D) we found significantly more G cells in the proximal antrum (23.91±7.49) compared to the distal antrum (12.22±3.81; P=0.0067). This cell type represented 95.3% and 88.7% of total G cell number respectively. When counting the number of spindle-like G cells located in the upper region of the invaginations, we found 1.17 ± 0.25 in the proximal antrum and 1.55±0.40 in the distal antrum (Figure 3E). Thus, this unique cell type represented 4.7% and 11.3% of the total G cell population. These findings demonstrate a distinct topographic distribution pattern for morphologically different G cells; while the numbers of pyramidal-/roundish-shaped G cells was significantly higher in the proximal antrum compared to the distal antrum, the number of spindle-like G cells did not significantly differ between the two regions. These findings may indicate that the spindle- like G cells serve a function which is equally relevant throughout the length of the antrum, while the function of pyramidal-/ roundish-shaped G cells may be more important in the proximal antrum.
Figure 3.
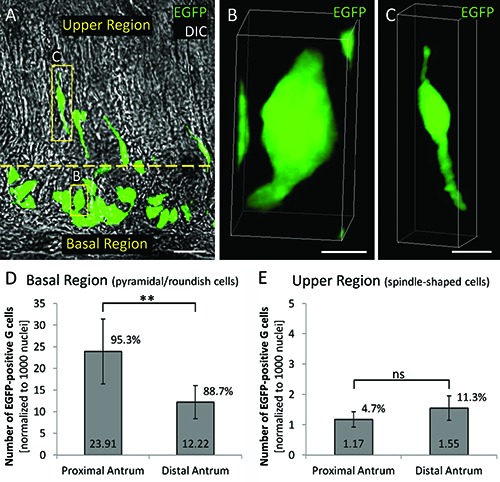
Distinct topographic distribution patterns for morphologically different G cells. A) A longitudinal tissue section of the antrum of a mGAS-EGFP transgenic mouse is shown in differential interference contrast (DIC); G cells are visible due to their intrinsic green fluorescence; the yellow dashed line separates the basal region from the upper region of the antral invaginations. While basally located G cells are pyramidal- or roundish-shaped (B), G cells in the upper region have a spindle-like contour and long processes (C). D) In the basal region the numbers of pyramidal-/roundish-shaped G cells was significantly higher in the proximal antrum (23.91±7.49) compared to the distal antrum (12.22±3.81). E) In the upper region the number of spindle-like G cells did not significantly differ between the proximal (1.17±0.25) and distal antrum (1.55±0.40). **P<0.01; ns, not significant. Scale bars: A) 20 μm; B) 5 μm; C) 10 μm.
Similar topographic distribution patterns of G cells and D cells in the antrum
While G cells are present only in the antrum, their “functionally antagonistic” cell type, the somatostatin-secreting D cells,11-13 are distributed throughout the whole gastrointestinal tract. Based on the fact that these pan-GI EECs share a common multihormonal precursor cell with the G cells in the antrum,7-9 we asked whether G and D cells may share a similar topographic distribution pattern within this subcompartment of the stomach. To visualized D cells, we performed immunohistochemical experiments using a specific antibody for somatostatin (Figure 4; n=3). The distribution of gastric G cells and the pan-GI D cells is visible in Figure 4; the proximal antrum (Figure 4A) and distal antrum are shown (Figure 4B). As observed for G cells, most of the D cells were located in the basal region of the antral invaginations, but some were also found in the upper region. Compared to the relatively high number of G cells in the basal region, the number of D cells was much smaller; about 7.36±0.70 (P=0.0484) and 2.53±0.13 (P=0.0399) D cells were found in the proximal and distal antrum, respectively (Figure 4C). For the upper region of the invagination in the proximal antrum 0.44±0.23 D cells (P=0.0069) and in the distal antrum 0.54 ±0.25 D cells were found (Figure 4D). The data indicate that the number of D cells in the basal region were significantly larger in the proximal antrum compared to the distal antrum (P=0.0003), but the number of D cells in the upper region of the antral invaginations did not significantly differ between the two regions (P=0.6518). Thus, G cells and D cells share similar distribution patterns within the antrum. The ratio of G cells versus D cells was determined as about 3:1 and interestingly it is very similar in all regions.
Figure 4.
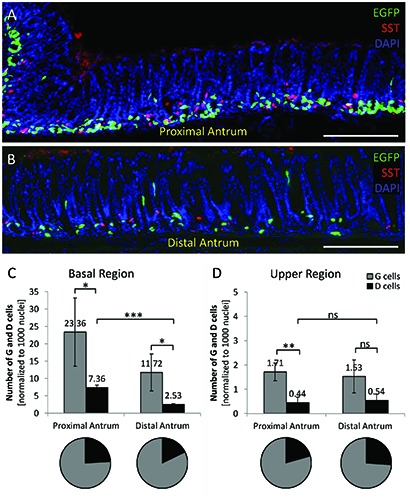
Similar topographic distribution patterns of G cells and D cells in the antrum. A,B) Longitudinal tissue sections of the proximal (A) and distal antrum (B) of mGASEGFP transgenic mice are shown; G cells are visualized by green fluorescence; D cells were immunostained using a specific antibody for somatostatin (red); tissue sections were counterstained with DAPI (blue). C) In the basal region of the antral invaginations, compared to G cells (grey bars), smaller D cell numbers (black bars) were counted; in the proximal antrum 7.36±0.70 D cells were found, while only 2.53±0.13 D cells were counted in the distal antrum. D) In the upper region, 0.44±0.23 and 0.54±0.25 D cells were found in the proximal and distal antrum respectively. ***P<0.001; **P<0.01; *P<0.05; ns, not significant. Scale bars: 200 μm.
Different topographic distribution patterns of G cells and EC cells in the antrum
In order to investigate whether all EECs in the antrum share similar distribution patterns, the localization of G cells and EC cells was compared. The cells were specifically visualized by the fluorescent labeling obtained by EGFP and with a specific 5-hydroxytryptamin (5-HT) antibody (Figure 5A,B; n=3). It became apparent that in the basal region of the antral invaginations the number of 5 HTimmunopositive cells was smaller than the number of G cells (Figure 5C); while in the upper region more EC cells were found (Figure 5D). The exact number of G cells in the basal region was 13.92±3.26 and 6.46±3.33 EC cells in the proximal and distal antrum, respectively. In the upper region, 1.36±0.58 and 3.10±1.04 EC cells were found, resulting in an opposing G/EC cell ratio. While G cells represent the major EEC type in the basal region of the antral invaginations (about 2:1), G cells were outnumbered by EC cells in the upper region (about 1:2). These findings demonstrate a significantly different distribution pattern of EC cells compared to G cells, indicating that not all EECs in the antrum follow the same topographic distribution pattern.
Figure 5.
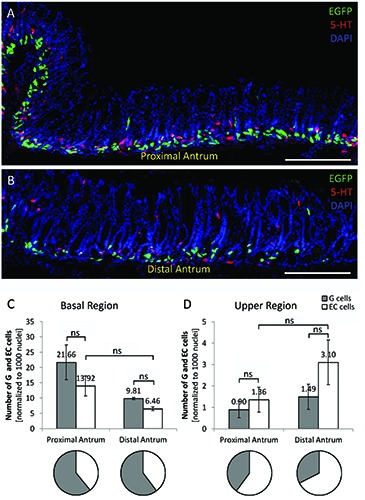
Different topographic distribution patterns of G cells and EC cells in the antrum. A,B) Longitudinal tissue sections of the proximal (A) and distal antrum (B) of mGAS-EGFP transgenic mice are shown; G cells are visible due to their intrinsic fluorescence (green), EC cells were immunostained using a specific antibody for 5-HT (red); tissue sections were counterstained with DAPI (blue). C) In the basal region of the antral invaginations, compared to G cells (grey bars), smaller EC cell numbers (white bars) were counted; 13.92±3.26 and 6.46±3.33 EC cells were counted in the proximal and distal antrum, respectively. D) In the upper region EC cells outnumbered G cells as 1.36±0.58 and 3.10±1.04 EC cells were found. ns, not significant. Scale bars: 200 μm.
Discussion
G cells are the prevailing EECs in the antrum, secreting the peptide hormone gastrin which is a major regulator of gastric secretion and gastric motility, but also mucosal cell proliferation.14-16 Recently we have uncovered that individual G cells showed pivotal differences in their morphology which correlated with their localization in the antral invaginations; while basally located G cells were pyramidal- or roundish-shaped, G cells in the upper region of the invaginations had a spindle-like contour and long processes.6 Based on preliminary experiments in which we determined the life span of antral G cells using BrdU labeling, we are confident that morphologically different G cells constitute distinct G cell subtypes rather than different developmental stages. By quantifying the number of BrdU-positive cells at distinctive time points post injection, we observed that G cells in the upper region exhibit a life span up to 3 days, whereas G cells in the basal region became 63 days and older. Besides, G cells with a spindle-like contour were found above the isthmus region (the region in which newly generated cells emerge) whereas roundish-shaped G cells were found below (data not shown). As the functional implications of these different G cell types are still elusive attempts have been made to elucidate the distribution of the two G cell types throughout the different regions of the antrum. Investigating longitudinal tissue sections, we found that the antral mucosa morphologically differed along the anterior/posterior axis of the antrum and that G cells were not evenly distributed within the mucosa. On the contrary, no differences in the distribution pattern of G cells between the greater and lesser curvature have been observed (data not shown). Differences in distribution patterns were observed only between the anterior (proximal antrum) and posterior region (distal antrum). G cells were less frequent in the distal antrum compared to the proximal antrum, suggesting functionally different regions of the antrum. In fact, functionally different regions of the antrum have been described before; most notably for the emptying mechanism of the antral pump. After the phase of gastric emptying in which fluids and small particles are released into the small intestine, chyme which contains large particles is forced retrograde into the relaxing middle and proximal antrum while the terminal antrum is cleared.17 Based on this observation it seems plausible that the number of G cells is higher in the proximal region compared to the distal antrum, given their pivotal role in the regulation of digestive processes. An unequal distribution of G cells was only found for G cells in the basal region, but not for G cells in the upper region of the antral invaginations; pyramidal- shaped G cells were mainly found in the proximal region, but less abundant in the distal antrum, whereas spindle-shaped G cells were found in equal amounts throughout the length of the antrum. Their different distribution patterns support the notion that the “atypical” spindle-shaped G cells serve other functions than the “typical” G cells. Keeping in mind that the distal part of the antrum is cleared after gastric emptying it is conceivable that the spindle-shaped G cells may not be primarily involved in digestive processes but may rather be involved in the regulation of gastric motility.
Besides gastrin-secreting G cells, glands of the antrum contain two other EEC types namely somatostatin-releasing D cells and serotonin-producing EC cells.8 While G cells are selectively found in the antral region of the stomach,18 D and EC cells are pan-GI EECs which are present throughout the GIT from the fundus to the rectum.19 Based on the fact that G and D cells in the antrum derive from a common multihormonal G/D precursor cell7-9 the question arose of whether those two EEC types may share a similar distribution pattern. Visualizing the G and D cells revealed that both EEC types in fact have a similar topographic distribution pattern within the antrum, however differ in numbers. The ratio of G cells versus D cells was determined as about 3:1 and was very similar in all regions. These findings strongly indicate that the “functionally antagonistic” EEC types share some mechanisms governing the topographic distribution pattern and cell number.
Interestingly, this was not the case when the G cell distribution pattern was compared with EC cells, the second pan-GI EEC type in the antrum. While G cells represented the major EEC type in the basal region of the antral invaginations, they were outnumbered by EC cells in the upper region, indicating that distinct mechanisms govern the spatial segregation of EECs in the antrum.
Further studies are needed to unravel the mechanisms underlying the generation of morphologically different G cell types which may help shed light on the function of morphologically different G cells.
Acknowledgments
The authors thank Kerstin Bach for excellent technical assistance and Dr. Timothy C. Wang for providing the mGas- EGFP mice. This work was supported by the Deutsche Forschungsgemeinschaft (n. BR 712/25-1).
References
- 1.Bjerknes M, Cheng H. Multipotential stem cells in adult mouse gastric epithelium. Am J Physiol Gastrointest Liver Physiol 2002;283:G767. [DOI] [PubMed] [Google Scholar]
- 2.Mills JC, Shivdasani RA. Gastric Epithelial stem cells. Gastroenterology 2011;140:412-24. [DOI] [PMC free article] [PubMed] [Google Scholar]
- 3.Thompson EM, Price YE, Wright NA. Kinetics of enteroendocrine cells with implications for their origin: A study of the cholecystokinin and gastrin subpopulations combining tritiated thymidine labelling with immunocytochemistry in the mouse. Gut 1990;31:406. [DOI] [PMC free article] [PubMed] [Google Scholar]
- 4.Engelstoft MS, Egerod KL, Lund ML, Schwartz TW. Enteroendocrine cell types revisited. Curr Opin Pharmacol 2013;13:912-21. [DOI] [PubMed] [Google Scholar]
- 5.Takaishi S, Shibata W, Tomita H, Jin G, Yang X, Ericksen R, et al. In vivo analysis of mouse gastrin gene regulation in enhanced GFP-BAC transgenic mice. Am J Physiol Gastrointest Liver Physiol 2011;300:G334. [DOI] [PMC free article] [PubMed] [Google Scholar]
- 6.Frick C, Rettenberger AT, Lunz ML, Breer H. Complex morphology of gastrin- releasing G-cells in the antral region of the mouse stomach. Cell Tissue Res 2016;366:301-10. [DOI] [PubMed] [Google Scholar]
- 7.Larsson L-I, St-Onge L, Hougaard DM, Sosa-Pineda B, Gruss P. Pax 4 and 6 regulate gastrointestinal endocrine cell development. Mech. De. 1998;79:153-59. [DOI] [PubMed] [Google Scholar]
- 8.Larsson L-I. Developmental biology of gastrin and somatostatin cells in the antropyloric mucosa of the stomach. Microsc Res Tech 2000;48:272-81. [DOI] [PubMed] [Google Scholar]
- 9.Kim T-H, Shivdasani RA. Stomach development, stem cells and disease. Development. 2016;143:554. [DOI] [PMC free article] [PubMed] [Google Scholar]
- 10.Lee ER, Trasler J, Dwivedi S, Leblond CP. Division of the mouse gastric mucosa into zymogenic and mucous regions on the basis of gland features. Am J Anat 1982;164:187-207. [DOI] [PubMed] [Google Scholar]
- 11.Schrumpf E, Vatn MH, Hanssen KF, Semb S, Myren J. Somatostatin inhibits insulin-stimulated gastrin release and gastric secretion of acid, pepsin, and intrinsic factor (IF) in duodenal ulcer patients. Scand J Gastroenterol. 1976; 11:517-20. [PubMed] [Google Scholar]
- 12.Alumets J, Ekelund M, El Munshid HA, Hakanson R, Loren I, Sundler F. Topography of somatostatin cells in the stomach of the rat: Possible functional significance. Cell Tissue Res 1979;202: 177-88. [DOI] [PubMed] [Google Scholar]
- 13.Lloyd KC, Amirmoazzami S, Friedik F, Chew P, Walsh JH. Somatostatin inhibits gastrin release and acid secretion by activating sst2 in dogs. Am J Physiol Gastrointest Liver Physiol 1997;272:G1481. [DOI] [PubMed] [Google Scholar]
- 14.Gregory H, Hardy PM, Jones DS, Kenner GW, Sheppard RC. The antral hormone gastrin: Structure of gastrin. Nature 1964;204:931-3. [DOI] [PubMed] [Google Scholar]
- 15.Verkijk M, Gielkens HAJ, Lamers CBHW, Masclee AAM. Effect of gastrin on antroduodenal motility: Role of intraluminal acidity. Am J Physiol Gastrointest Liver Physiol 1998; 275: G1209. [DOI] [PubMed] [Google Scholar]
- 16.Dockray GJ. Gastrin and gastric epithelial physiology. J Physiol 1999;518: 315-24. [DOI] [PMC free article] [PubMed] [Google Scholar]
- 17.Ehrlein HJ. Motor function of the stomach of non ruminant mammals in comparison to the motility of the abomasum. Ann Rec Vet 1976;7:119-24. [PubMed] [Google Scholar]
- 18.Sachs G, Zeng N, Prinz C. Physiology of isolated gastric endocrine cells. Annu Rev Physiol 1997;59:243-56. [DOI] [PubMed] [Google Scholar]
- 19.Solcia E, Rindi G, Buffa R, Fiocca R, Capella C. Gastric endocrine cells: Types, function and growth. Regul Pept 2000;93:31-5. [DOI] [PubMed] [Google Scholar]