

Abstract
The present study determined the ability of the Lactobacillus rhamnosus GG strain (LGG) to enhance the anticancer effects of geniposide on HSC-3 human oral squamous carcinoma cells. LGG (1.0×10³ CFU/ml) on its own had no impact on human oral keratinocytes and HSC-3 cancer cells. Geniposide (25 or 50 µg/ml) had no impact on human oral keratinocytes, but exerted growth inhibitory effects on HSC-3 cancer cells, which were increased in the presence of LGG. Flow cytometric analysis and a nuclear staining assay with DAPI revealed that HSC-3 cancer cells treated with LGG-geniposide (1.0×10³ CFU/ml LGG and 50 µg/ml geniposide) had a higher apoptotic rate than cells in other treatment groups, particularly that treated with geniposide (50 µg/ml) only. Geniposide also increased the mRNA and protein expression of caspase-3, −8 and −9 as well as B-cell lymphoma 2 (Bcl-2)-associated X protein, p53, p21, inhibitor of nuclear factor-κB (NF-κB) α, Fas and Fas ligand, while decreasing Bcl-2, Bcl extra large protein, inhibitor of apoptosis-1 and −2, NF-κB, cyclooxigenase-2 and inducible nitric oxide synthase in HSC-3 cells, which was increased in the presence of LGG. These results indicated that LGG enhanced the anticancer effects of geniposide in HSC-3 cells.
Keywords: Lactobacillus rhamnosus GG strain, geniposide, human oral squamous carcinoma HSC-3 cells, human oral keratinocytes, expression
Introduction
Gardenia jasminoides Ellis belongs to the Rubiaceae family and Gardenia genus, and its dried ripe fruit can be used as a medicine, with bitter and cold taste, and nourishing the heart, lungs and San Juao meridian according to the principles of Chinese Medicine (1). Gardenia fruit mainly protects the liver and nourishes the gallbladder, and its active constituent is geniposide, which belongs to the iridoid glycosides (2). It is also rich in other constituents such as organic acids, pigments and volatile oils (3). A pharmacokinetic study has found that geniposide, the active constituent of Gardenia jasminoides Ellis, is hydrolyzed by β-glucosidase produced by intestinal microorganisms to generate genipin (4). Studies have proved that genipin also significantly reduces inflammation, lipid peroxidation and angiogenesis, with low cytotoxicity, sound biocompatibility and high anti-degradation ability (5,6). Gardenia jasminoides Ellis has a low genipin content, which only accounts for 0.005–0.01%, and mainly exists in the form of its precursor-geniposide, accounting for 3–5%. At present, geniposide is extracted with organic solvents, and 100 g gardenia fruit provide ~4 g geniposide. Therefore, it is of great significance to ferment Gardenia by microorganisms to produce genipin (7). In addition, the use of microorganisms and geniposide may achieve a better control of the concentration of active constituents, which may enhance the pharmacological effect. The transformation of geniposide contained in Gardenia jasminoides by fermentation with microorganisms is carried out by β-glucosidase produced by bacteria, which breaks chemical bonds in geniposide to produce genipin (8). In the present study, high-yield lactobacillus produced by β-glucosidase was used to react with geniposide and the joint effect on cancer cells was observed.
Organisms balance the number of cells in their tissues by proliferation and apoptosis. When the balance is disturbed, certain diseases, such as cancer, may occur (9). Elucidation of the association between apoptosis and cancer may provide a new reference for the treatment of cancer. In the last 30–50 years, cytotoxic radiotherapy and chemotherapy have been used as the main treatment measures of cancer, which have certain therapeutic effects for numerous hematological malignancies and certain types of solid tumor, particularly germ cell tumors and certain pediatric malignant tumor types (10). However, malignant tumors have certain resistances to these measures; while high-dose chemotherapy may overcome the resistance, it may not be curative and also damage normal tissues and cells. For a long time, it was thought that tumors can be treated by selectively killing target cells which divide rapidly, but it is not considered to be satisfactory in clinical practice, as certain treatable cancer cells grow slowly and those with resistance divide rapidly (11). Furthermore, the treatments may induce apoptosis of tumor cells, while various cells have different apoptosis thresholds, and their responses to treatment differ accordingly. As the induction and regulation of apoptosis are complex processes, the mechanisms of apoptosis induction by various anti-tumor drugs may not be the same (12). The present study observed the effect of Lactobacillus rhamnosus GG strain (LGG) combined with geniposide on the apoptosis of cancer cells and analyzed the underlying mechanisms, providing evidence for the clinical application of LGG combined with geniposide.
Materials and methods
Preparation of experimental samples
The LGG strain was provided by Culturelle Probiotics (i-Health, Cromwell, CT, USA). Geniposide standard was purchased from Shanghai Jinsui Biotechnology Co., Ltd. (Shanghai, China).
Cell lines
Human oral keratinocytes (HOK) were supplied by Bioleaf Co. (Shanghai, China) and the HSC-3 human oral squamous cell carcinoma cell line was supplied by EK-Bioscience Co. (Shanghai, China). These cells were cultured in RPMI-1640 medium (HyClone; GE Healthcare, Little Chalfont, UK) with 10% fetal bovine serum (HyClone; GE Healthcare) at 37°C in an incubator with 5% CO2, and the medium was changed every day.
MTT assay
Culture solution was added to a suspension of the cancer cells in the logarithmic growth phase to adjust the concentration to 2×10⁴ cells/well, which were then added to the 96-well culture plate at 50 µl per well, and incubated at 37°C for 24 h. Drugs (1.0×10³ CFU/ml LGG + 25 or 50 µg/ml geniposide) were added at 50 µl per well, to adjust the concentration of cancer cells to 10 µg/ml eventually, while cells in the control group were treated with 50 µl culture solution only, followed by culture for 48 h. All culture solution in wells was discarded, then MTT solution was added in the wells and plates were incubated for another 4 h. After the supernatant was removed, 100 µl DMSO was added to the blank control group and following agitation for 30 min, the absorbance of the wells was detected at 570 nm using a 680 Microplate reader (Bio-Rad Laboratories, Inc., Hercules, CA, USA) (13).
Flow cytometric assay
A single-cell suspension was centrifuged to remove the supernatant, cells were washed with 3 ml PBS twice and then centrifuged (1,490 × g, 25°C) for 5 min. Propidium iodide (PI, 10 µg/ml) staining solution (1 ml) was added and samples were incubated at 4°C for 30 min in the dark. Subsequent to filtration through a 500-hole copper mesh (pore width, 8.2 mm), flow cytometric detection using an argon ion laser with 15 mA excitation light source and 488 nm wavelength, and a 630-nm band-pass filter was performed. A total of 10,000 cells were collected in the forward vs. side scatter dot plot diagram, with gating technology used to exclude adhesive cells and cell debris, to analyze the percentage of apoptotic cells in a PI fluorescence histogram (13).
Nuclear staining with DAPI
HSC-3 cells were cultured as an MTT assay, then all groups of HSC-3 cells were collected and washed with PBS, followed by fixing in 3.7% paraformaldehyde (Sigma-Aldrich; Merck KGaA, Darmstadt, Germany) in PBS for 10 min at 25°C. The fixed cells were stained with the DAPI solution (1 mg/ml; Sigma-Aldrich; Merck KGaA) for 10 min at 25°C. Finally, all the cells were washed three times with PBS analyzed using a fluorescence microscope (IX73; Olympus Corp., Tokyo, Japan) (13).
Reverse transcription-quantitative polymerase chain reaction (RT-qPCR) assay
RNAzol reagent (Sigma-Aldrich; Merck KGaA) was used to extract the total RNA from cancer cells, and RNase-free DNase (Gibco; Thermo Fisher Scientific, Inc., Waltham, MA, USA) was adopted to digest total RNA at 37°C for 15 min. The RNeasy kit (74104; Qiagen GmbH, Hilden, Germany) was used to purify RNA to adjust its concentration to 1 µg/µl. RNA (2 µg) was used as the template to synthetize complementary (c)DNA by reacting with reverse transcriptase at 37°C for 120 min, at 99°C for 4 min and at 4°C for 3 min, respectively. PCR (50°C for 2 min, then 40 cycles of 95°C for 30 sec, 95°C for 5 sec and 60°C for 34 sec) was then performed to amplify the cDNA using primers listed in (Table I). The housekeeping gene GAPDH was used as an internal control. Finally, agarose electrophoresis with 1% ethidium bromide was performed to quantify the PCR-amplified products (13).
Table I.
Sequences of primers used for polymerase chain reaction.
| Gene | Sequence |
|---|---|
| Caspase-3 | Forward, 5′-CAAACTTTTTCAGAGGGGATCG-3′ |
| Reverse, 5′-GCATACTGTTTCAGCATGGCA-3′ | |
| Caspase-8 | Forward, 5′-CCCCACCCTCACTTTGCT-3′ |
| Reverse, 5′-GGAGGACCAGGCTCACTTA-3′ | |
| Caspase-9 | Forward, 5′-GGCCCTTCCTCGCTTCATCTC-3′ |
| Reverse, 5′-GGTCCTTGGGCCTTCCTGGTAT-3′ | |
| Bax | Forward, 5′-AAGCTGAGCGAGTGTCTCCGGCG-3′ |
| Reverse, 5′-CAGATGCCGGTTCAGGTACTCAGTC-3′ | |
| Bcl-2 | Forward, 5′-CTCGTCGCTACCGTCGTGACTTGG-3′ |
| Reverse, 5′-CAGATGCCGGTTCAGGTACTCAGTC-3′ | |
| Bcl-xL | Forward, 5′-CCCAGAAAGGATACAGCTGG-3′ |
| Reverse, 5′-GCGATCCGACTCACCAATAC-3′ | |
| Fas | Forward, 5′-GAAATGAAATCCAAAGCT-3′ |
| Reverse, 5′-TAATTTAGAGGCAAAGTGGC-3′ | |
| FasL | Forward, 5′-GGATTGGGCCTGGGGATGTTTCA-3′ |
| Reverse, 5′-TTGTGGCTCAGGGGCAGGTTGTTG-3′ | |
| p53 | Forward, 5′-GCTCTGACTGTACCACCATCC-3′ |
| Reverse, 5′-CTCTCGGAACATCTCGAAGCG-3′ | |
| p21 | Forward, 5′-CTCAGAGGAGGCGCCATG-3′ |
| Reverse, 5′-GGGCGGATTAGGGCTTCC-3′ | |
| hIAP-1 | Reverse, 5′-GCCTGATGCTGGATAACTGG-3′ |
| Forward, 5′-GGCGACAGAAAAGTCAATGG-3′ | |
| hIAP-2 | Reverse, 5′-GCCTGATGCTGGATAACTGG-3′ |
| Forward, 5′-GCTCTTGCCAATTCTGATGG-3′ | |
| NF-κB | Forward, 5′-CACTTATGGACAACTATGAGGTCTCTGG-3′ |
| Reverse, 5′-CTGTCTTGTGGACAACGCAGTGGAATTTTAGG-3′ | |
| IκB-α | Forward, 5′-GCTGAAGAAGGAGCGGCTACT-3′ |
| Reverse, 5′-TCGTACTCCTCGTCTTTCATGGA-3′ | |
| COX-2 | Reverse, 5′-TTAAAATGAGATTGTCCGAA-3′ |
| Forward, 5′-AGATCACCTCTGCCTGAGTA-3′ | |
| iNOS | Reverse, 5′-AGAGAGATCGGGTTCACA-3′ |
| Forward, 5′-CACAGAACTGAGGGTACA-3′ | |
| GAPDH | Reverse, 5′-CGGAGTCAACGGATTTGGTC-3′ |
| Forward, 5′-AGCCTTCTCCATGGTCGTGA-3′ |
Bcl-2, B-cell lymphoma 2; Bax, Bcl-2-associated X protein; Bcl-xL, Bcl-extra large protein; FasL, Fas ligand; hIAP, human inhibitor of apoptosis; NF-κB, nuclear factor-κB; I-κB-α, inhibitor of NF-κB α; COX, cyclooxygenase; iNOS, inducible nitric oxide synthase.
Western blot analysis
Subsequent to treatment, cells of each group were lysed using RIPA lysis and extraction buffer (Gibco; Thermo Fisher Scientific, Inc.) to obtain total protein extracts. The Bradford method was adopted to determine the concentration of proteins. A 10% separation gel and a 5% stacking gel were prepared for SDS-PAGE, then 30 µg protein was subjected to SDS-PAGE and transferred to nitrocellulose filter membranes. Subsequent to blocking in 5% nonfat milk for 2 h, membranes were incubated in primary antibody (1:1,500 dilution; caspase-3, ab13847; caspase-8, ab25901; caspase-9, ab52298; Bax, ab32503; Bcl-2, ab59348; Bcl-xL, ab32370; Fas, ab82419; FasL, ab15285; p53, ab1431; p21, ab188224; HIAP-1, ab2399; HIAP-2, ab234323; NF-κB; ab220803; IκB-α, ab32518; COX-2, ab52237; iNOS, ab15323; all Abcam, Cambridge, MA, USA) at 4°C overnight. After washing with Tris-buffered saline containing Tween-20 (TBST) for 3 times, membranes were incubated with secondary antibody (1:2,000 dilution, ab131368; Abcam) at room temperature for 2 h, and then rinsed with TBST for 3 times. Enhanced chemiluminescence was used to develop the blots, and a GIS gel imager system (E-Gel Imager; Thermo Fisher Scientific, Inc.) was used to analyze and process the images (13).
Statistical analysis
The results were expressed as the mean ± standard deviation. Differences between groups were analyzed using Duncan's multiple-range test using SAS version 9.2 (SAS Institute Inc., Cary, NC, USA). P<0.05 was considered to indicate a significant difference between groups.
Results
Growth inhibitory effects of LGG and geniposide in HOK and HSC-3 cells
As presented in Figs. 1 and 2, LGG at the concentration of 0–103 CFU/ml and geniposide at 0–50 µg/ml did not inhibit the growth of normal oral cells (HOK cells), and LGG at 0–103 CFU/ml did not inhibit the growth of HSC-3 cells, while geniposide at 0–50 µg/ml exerted concentration-dependent growth inhibitory effects. Based on these results, 1.0×10³ CFU/ml of LGG and 25 or 50 µg/ml of geniposide were selected for use in the subsequent experiments. The MTT assay revealed that only geniposide treatment at 25 and 50 µg/ml had a significant inhibitory effect [optical density at 570 nm (OD570), 0.361±0.010 and 0.231±0.011, respectively, vs. 0.466±0.004 for the control group]. In addition LGG treatment at 1.0×10³ CFU/ml further decreased the OD570 value resulting from geniposide treatment at 25 and 50 µg/ml to 0.332±0.009 and 0.162±0.008, respectively. The inhibitory rates of the low concentration of geniposide (geniposide-L; 25 µg/ml), LGG-geniposide-L (LGG at 1.0×10³ CFU/ml and geniposide at 25 µg/ml), high concentration of geniposide (geniposide-H; 50 µg/ml) and LGG-geniposide-H (LGG at 1.0×10³ CFU/ml and geniposide at 50 µg/ml) were 22.5±1.8, 28.8±2.3, 50.4±2.7 and 65.2±3.3%, respectively (Table II).
Figure 1.

Effect of Lactobacillus rhamnosus GG strain on the growth of (A) human oral keratinocytes and (B) HSC-3 human oral squamous cell carcinoma cells. CFU, colony-forming units.
Figure 2.

Effect of geniposide on the growth of (A) human oral keratinocytes and (B) HSC-3 human oral squamous cell carcinoma cells. *P<0.05 and #P<0.01 vs. 0 µg/ml.
Table II.
Growth inhibitory effects of geniposide and LGG in human oral squamous carcinoma HSC-3 cells.
| Treatment | OD540 value | Inhibitory rate (%) |
|---|---|---|
| Control | 0.466±0.004 | – |
| Geniposide-L | 0.361±0.010a | 22.5±1.8b |
| LGG-geniposide-L | 0.332±0.009a | 28.8±2.3b |
| Geniposide-H | 0.231±0.011a | 50.4±2.7b |
| LGG-geniposide-H | 0.162±0.008a | 65.2±3.3 |
Groups: Geniposide-L, 25 µg/ml geniposide; LGG-geniposide-L, 1.0×10³ CFU/ml LGG + 25 µg/ml geniposide; Geniposide-H, 50 µg/ml geniposide; LGG-geniposide-H, 1.0×10³ CFU/ml LGG + 50 µg/ml geniposide. LGG, Lactobacillus rhamnosus GG strain; CFU, colony-forming units; OD, optical density.
P<0.05 vs. control group
P<0.05 vs. LGG-geniposide-H group.
Sub-G1 content of HSC-3 cells
The flow cytometry experiment revealed that the apoptotic cells (sub-G1 DNA content) in the control, geniposide-L, LGG-geniposide-L, geniposide-H and LGG-geniposide-H-treated HSC-3 cells were 2.2±0.3, 9.7±0.4, 14.3±0.6, 24.8±1.8 and 32.6±2.3%, respectively (Fig. 3A).
Figure 3.

Apoptotic effects of LGG and geniposide in human oral squamous cell carcinoma HSC-3 cells determined by (A) flow cytometry and (B) DAPI staining (arrows indicate apoptotic nuclei). Magnification, ×50. *P<0.05 and #P<0.01 vs. control group. Groups: Geniposide-L, 25 µg/ml geniposide; LGG-geniposide-L, 1.0×10³ CFU/ml LGG + 25 µg/ml geniposide; Geniposide-H, 50 µg/ml geniposide; LGG-geniposide-H, 1.0×10³ CFU/ml LGG + 50 µg/ml geniposide. LGG, Lactobacillus rhamnosus GG strain; CFU, colony-forming units.
Apoptotic HSC-3 cell observation
Images of the control HSC-3 cells revealed intact cells and homogeneous chromatin nuclei, but after treatment with geniposide, the cells revealed chromatin condensation and nuclear fragmentation. Additional LGG treatment led to the rupture of certain cells, with the high concentration of geniposide causing the largest percentage of apoptotic cells (Fig. 3B).
mRNA and protein expression of caspase-3, −8 and −9 in HSC-3 cells
Geniposide treatment raised the mRNA and protein expression of caspase-3, −8 and −9 compared to that in the control cells in a dose-dependent manner. LGG enhanced the increasing effects geniposide treatment on caspase-3, −8 and −9 expressions (Fig. 4).
Figure 4.

(A) mRNA and (B) protein expression of caspase-3, −8 and −9 in HSC-3 human oral squamous cell carcinoma cells. *P<0.05 and #P<0.01 vs. control group. Groups: Geniposide-L, 25 µg/ml geniposide; LGG-geniposide-L, 1.0×10³ CFU/ml LGG + 25 µg/ml geniposide; Geniposide-H, 50 µg/ml geniposide; LGG-geniposide-H, 1.0×10³ CFU/ml LGG + 50 µg/ml geniposide. LGG, Lactobacillus rhamnosus GG strain; CFU, colony-forming units.
mRNA and protein expression of B-cell lymphoma 2 (Bcl-2), Bcl-2-associated X protein (Bax) and Bcl-extra large protein (Bcl-xL) in HSC-3 cells
After treatment with geniposide-L, LGG-geniposide-L, geniposide-H and LGG-geniposide-H, Bax mRNA and protein expression was increased, while Bcl-2 and Bcl-xL expression was decreased in order (Fig. 5).
Figure 5.
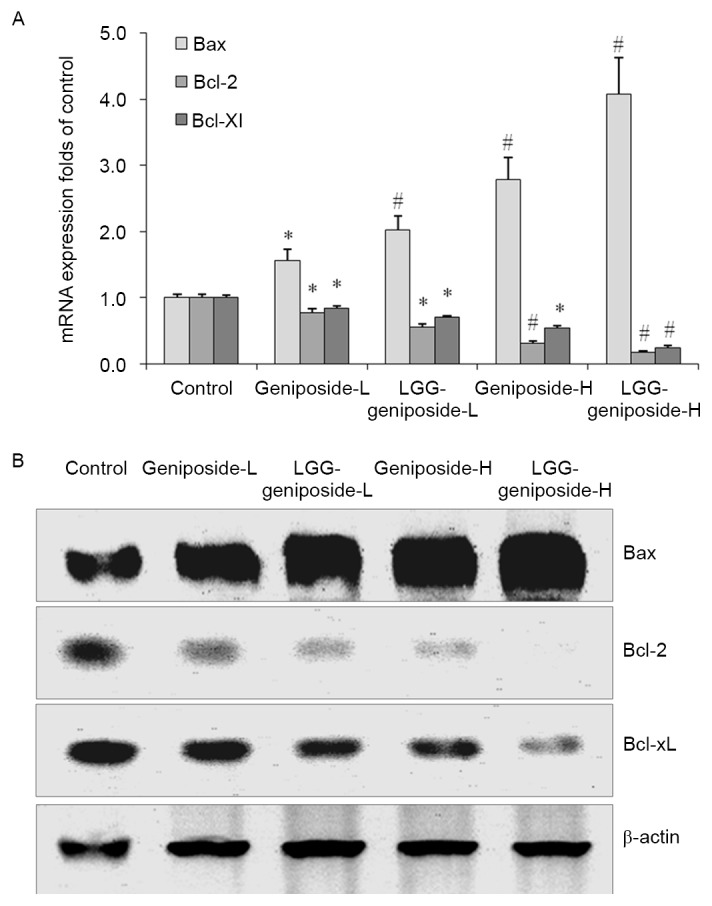
(A) mRNA and (B) protein expression of Bax, Bcl-2 and Bcl-xL in human oral squamous carcinoma HSC-3 cells. *P<0.05 and #P<0.01 vs. control group. Groups: Geniposide-L, 25 µg/ml geniposide; LGG-geniposide-L, 1.0×10³ CFU/ml LGG + 25 µg/ml geniposide; Geniposide-H, 50 µg/ml geniposide; LGG-geniposide-H, 1.0×10³ CFU/ml LGG + 50 µg/ml geniposide. LGG, Lactobacillus rhamnosus GG strain; Bcl-2, B-cell lymphoma 2; Bax, Bcl-2-associated X protein; Bcl-xL, Bcl-extra large protein; CFU, colony-forming units.
mRNA and protein expression of Fas and Fas ligand (FasL) in HSC-3 cells
The Fas and FasL mRNA and protein expression was increased by geniposide treatment, and upon additional LGG teratment, Fas and FasL expression was further increased. The high concentration of geniposide and LGG resulted in the higheset Fas and FasL expression (Fig. 6).
Figure 6.

(A) mRNA and (B) protein expression of Fas and FasL in human oral squamous carcinoma HSC-3 cells. *P<0.05 and #P<0.01 vs. control group. Groups: Geniposide-L, 25 µg/ml geniposide; LGG-geniposide-L, 1.0×10³ CFU/ml LGG + 25 µg/ml geniposide; Geniposide-H, 50 µg/ml geniposide; LGG-geniposide-H, 1.0×10³ CFU/ml LGG + 50 µg/ml geniposide. LGG, Lactobacillus rhamnosus GG strain; FasL, Fas ligand; CFU, colony-forming units.
mRNA and protein expression of p53 and p21 in HSC-3 cells
The p53 and p21 mRNA and protein expression in the LGG-geniposide-H group was higher than that in the other groups, and LGG/geniposide combination treatment resulted in a higher p53 and p21 expression than treatment with geniposide only (Fig. 7).
Figure 7.

(A) mRNA and (B) protein expression of p53 and p21 in human oral squamous carcinoma HSC-3 cells. *P<0.05 and #P<0.01 vs. control group. Groups: Geniposide-L, 25 µg/ml geniposide; LGG-geniposide-L, 1.0×10³ CFU/ml LGG + 25 µg/ml geniposide; Geniposide-H, 50 µg/ml geniposide; LGG-geniposide-H, 1.0×10³ CFU/ml LGG + 50 µg/ml geniposide. LGG, Lactobacillus rhamnosus GG strain; CFU, colony-forming units.
mRNA and protein expression of human inhibitor of apoptosis (HIAP)-1 and HIAP-2 in HSC-3 cells
Geniposide reduced the mRNA and protein expression of HIAP-1 and HIAP-2 in HSC-3 cells compared with that in the control cells (Fig. 8). Treatment with 50 µg/ml geniposide resulted in a the lower HIAP-1 and HIAP-2 expression than 25 g/ml geniposide, and LGG-geniposide-H-treated cells had the lowest expression.
Figure 8.

(A) mRNA and (B) protein expression of HIAP-1 and HIAP-2 in human oral squamous carcinoma HSC-3 cells. *P<0.05 and #P<0.01 vs. control group. Groups: Geniposide-L, 25 µg/ml geniposide; LGG-geniposide-L, 1.0×10³ CFU/ml LGG + 25 µg/ml geniposide; Geniposide-H, 50 µg/ml geniposide; LGG-geniposide-H, 1.0×10³ CFU/ml LGG + 50 µg/ml geniposide. LGG, Lactobacillus rhamnosus GG strain; HIAP, human inhibitor of apoptosis; CFU, colony-forming units.
mRNA and protein expression of nuclear factor-κB (NF-κB) and inhibitor of NF-κB α (IκB-α) in HSC-3 cells
Geniposide reduced NF-κB mRNA and protein expression and raised IκB-α expression compared with that in the untreated control cells, which was further enhanced in the presence of LGG. Therefore, LGG-geniposide-H-treated cells had the lowest NF-κB expression and highest IκB-α expression (Fig. 9).
Figure 9.

(A) mRNA and (B) protein expression of NF-κB and IκB-α in human oral squamous carcinoma HSC-3 cells. *P<0.05 and #P<0.01 vs. control group. Groups: Geniposide-L, 25 µg/ml geniposide; LGG-geniposide-L, 1.0×10³ CFU/ml LGG + 25 µg/ml geniposide; Geniposide-H, 50 µg/ml geniposide; LGG-geniposide-H, 1.0×10³ CFU/ml LGG + 50 µg/ml geniposide. LGG, Lactobacillus rhamnosus GG strain; NF-κB, nuclear factor-κB; I-κB-α, inhibitor of NF-κB α; CFU, colony-forming units.
mRNA and protein expression of cyclooxygenase (COX)-2 and inducible nitric oxide synthase (iNOS) in HSC-3 cells
LGG-geniposide-H resulted in the lowest COX-2 and iNOS mRNA and protein expression compared with that in the other groups, and in the LGG-geniposide-L group, the expression was lower than that in the geniposide-L group (Fig. 10).
Figure 10.
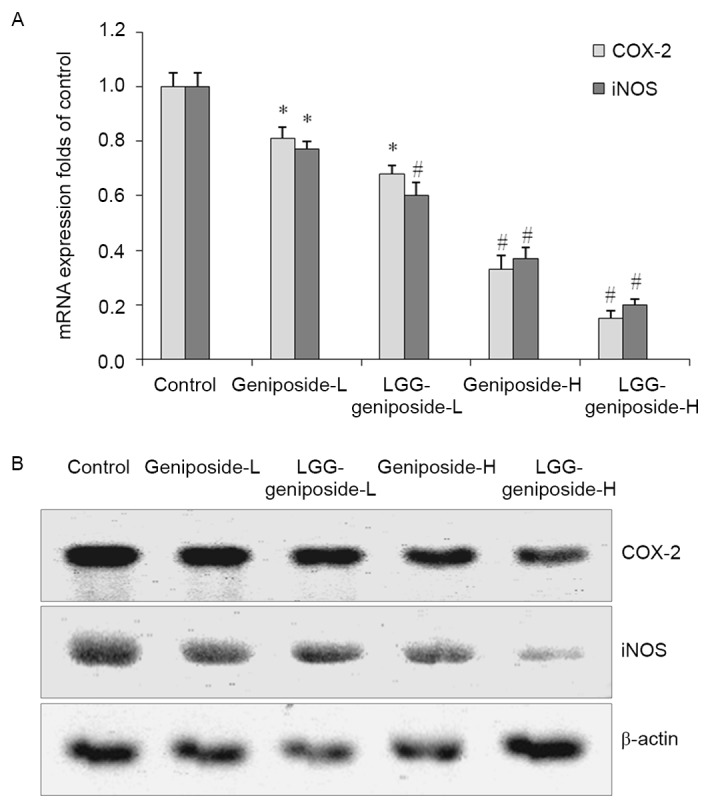
The mRNA (A) and protein (B) expression of COX-2 and iNOS in human oral squamous carcinoma HSC-3 cells. *P<0.05 and #P<0.01 vs. control group. Groups: Geniposide-L, 25 µg/ml geniposide; LGG-geniposide-L, 1.0×10³ CFU/ml LGG + 25 µg/ml geniposide; Geniposide-H, 50 µg/ml geniposide; LGG-geniposide-H, 1.0×10³ CFU/ml LGG + 50 µg/ml geniposide. LGG, Lactobacillus rhamnosus GG strain; COX, cyclooxygenase; iNOS, inducible nitric oxide synthase; CFU, colony-forming units.
Discussion
The ability of cancer cells to induce apoptosis is an important index for the determination of anticancer cancer effects (13). In the present study, geniposide and LGG had no effects on normal oral cells (HOK cells), but geniposide on its own or in combination with LGG had marked apoptotic effects on HSC-3 oral cancer cells.
As an upstream protein involved in exogenous apoptosis, caspase-8 shears and activates downstream apoptosis-inducing proteins such as caspase-3, −6 and −7, causing cell apoptosis (14). Apoptotic protease activating factor 1 binds to the original structural domain of the precursor of caspase-9 through the complementary domain of caspase, leading to the self-activation of caspase-9, which further activates the downstream caspase-3, −6 and −7, inducing endogenous apoptosis of cells (15). Caspase-3 is involved in exogenous as well as endogenous apoptosis, and numerous apoptotic factors interact with downstream effector caspase-3 to ultimately induce cell apoptosis (16).
The inhibition of apoptosis is vital for the incidence and development of cancer, and Bcl-2 family proteins have important roles in regulating the apoptosis of cancer cells. The Bcl-2 family is made up of the apoptosis inhibitory factors Bcl-2 and Bcl-xL, and the apoptosis-promoting factor Bax, and their ratio determines whether the cell is able to accept the apoptotic signal (17). To a certain extent, apoptosis or apoptosis inhibition are regulated by the above two genes. Disturbed apoptosis regulation is crucial to the development of tumors, and the Bcl-2 family has a major role in this process (18). As the main members of the Bcl-2 family, Bcl-2, Bax and Bcl-xL mainly regulate the apoptosis of cells by affecting the mitochondrial pathway. When cells receive death signals, Bax, which is bound to Bcl-2 or Bcl-xL, is displaced, increasing the permeability of the mitochondrial membrane and leading to the release of a series of substances, thus eventually causing the death of cells (19).
Fas, FasL and caspase-3 are the important proteins mediating the apoptosis of cells. FasL may be induced by certain stress responses, such as ultraviolet light and DNA damage, and the interactions between FasL and Fas may induce programmed death of cells, which is an important mechanism of the body to clear mutated cells (20). FasL is expressed on the surface of tumor cells, and tumor-specific antigen may induce tumor-infiltrating T lymphocytes to express Fas in large quantities, enhancing the sensitivity of T cells to apoptosis. T cells induce apoptosis of T lymphocytes, which causes high expression of Fas by FasL, resulting in immunosuppression. Fas-mediated apoptosis is also associated with numerous other factors, such as p53 gene mutations or the lack of co-stimulatory factor (21).
p53, the major protein regulating the Bcl-2 family, controls different proteins of Bcl-2 family in various ways, affecting the biological behavior of pancreatic cancer. p53 may upregulate Bax and downregulate Bcl-2 or Bcl-xL, affecting the apoptosis of cancer cells, and changing the permeability of mitochondria, thus affecting the function of downstream pro-apoptotic genes (22). As the clumping factor of cyclin D kinase (CDK), low concentrations of tumor suppressor gene p21 positively regulate the function of CDK, facilitating the development of cells and promoting the transition from G1 to S stage, but highly expressed p21 protein and cyclin bind to CDK competitively to inhibit the activity of CDK, causing the cell development to stagnate in G1 stage, thus inhibiting cell proliferation or inducing cell apoptosis (23). p73 and p53 protein are homologous in target gene binding, but their functions have great differences. As p73 causes cell cycle arrest and induces apoptosis, it may inhibit tumors to a certain extent (24).
The apoptosis-inhibiting genes HIAP-1 and HIAP-2 inhibit caspase to weaken its function to induce apoptosis. Therefore, regulating and weakening the functions of HIAP-1 and HIAP-2 genes is conducive to the activation of caspase, inducing the apoptosis of cancer cells (25).
The NF-κB system is composed of the NF-κB family and its inhibitor IκB-α. NF-κB is an extremely important transcriptional activator, and IκB-α is the inhibitory protein of NF-κB (26). NF-κB is vital to the inflammation process, and is also the key regulatory protein to the development of cancer. It has an important role in information transmission in association with tumor growth, and is closely associated with the incidence and development of tumors (27). Studies have found that NF-κB is highly expressed in numerous types of tumor, and activated NF-κB promotes the expression of a variety of genes involved in the development of cancer (28,29). Helicobacter pylori infection was found to activate NF-κB and the expression of COX-2, which have important roles in the incidence and development of cancer (30).
COX-2 and iNOS are not only the target molecules of inflammation, but are also closely associated with the development of tumors, particularly colon cancer. The increased expression of COX-2 and iNOS affects signal transduction pathways, leading to the occurrence, invasion and metastasis of tumors (31). At the same time, iNOS induces the expression of COX-2 and catalyzes the production of NO to enhance the activity of COX-2. Therefore, COX-2 and iNOS complement each other to cause cancer. Inhibiting the expression of inflammatory factors COX-2 and iNOS and the synthesis of induced products may block the proliferation of tumor cells and may provide approaches for treating cancer (32).
Genipin a major anticancer agent, which is produced by transformation of geniposide by β-glycosidase produced by lactic acid bacteria (33). LGG is a good probiotic producing β-glycosidase, and in the present study, LGG was likely to transform geniposide into genipin, leading to an increased inhibitory effect on oral cancer cells.
In present study, the anticancer enhancement effects of LGG on geniposide in HSC-3 cancer cells were determined by an MTT assay, flow cytometry, RT-qPCR and western blot experiments. Geniposide demonstrated a strong anticancer effect on HSC-3 cancer cells, which was enhanced by a relatively low concentration of LGG. These results indicated that LGG enhances the anticancer effects for geniposide, and that this combination may be used in cancer treatment.
References
- 1.Wu S, Jin Y, Liu QA, Wu JX, Bi YA, Wang ZZ, Xiao W. Acousto-optic tunable filter near-infrared spectroscopy for in-line monitoring liquid-liquid extraction of Gardenia jasminoides Ellis based on statistical analysis. Pharmazie. 2015;70:640–645. [PubMed] [Google Scholar]
- 2.Kim SJ, Kim JK, Lee DU, Kwak JH, Lee SM. Genipin protects lipopolysaccharide-induced apoptotic liver damage in D-galactosamine-sensitized mice. Eur J Pharmacol. 2010;635:188–193. doi: 10.1016/j.ejphar.2010.03.007. [DOI] [PubMed] [Google Scholar]
- 3.Zhu H, Yin R, Han F, Guan J, Zhang X, Mao X, Zhao L, Li Q, Hou X, Bi K. Characterization of chemical constituents in Zhi-Zi-Da-Huang decoction by ultra high performance liquid chromatography coupled with quadrupole time-of-flight mass spectrometry. J Sep Sci. 2014;37:3489–3496. doi: 10.1002/jssc.201400728. [DOI] [PubMed] [Google Scholar]
- 4.Gong G, Zheng Z, Liu H, Wang L, Diao J, Wang P, Zhao G. Purification and characterization of a β-glucosidase from aspergillus niger and its application in the hydrolysis of geniposide to genipin. J Microbiol Biotechnol. 2014;24:788–794. doi: 10.4014/jmb.1401.01053. [DOI] [PubMed] [Google Scholar]
- 5.Koo HJ, Song YS, Kim HJ, Lee YH, Hong SM, Kim SJ, Kim BC, Jin C, Lim CJ, Park EH. Antiinflammatory effects of genipin, an active principle of gardenia. Eur J Pharmacol. 2004;495:201–208. doi: 10.1016/j.ejphar.2004.05.031. [DOI] [PubMed] [Google Scholar]
- 6.Cho HI, Kim SJ, Choi JW, Lee SM. Genipin alleviates sepsis-induced liver injury by restoring autophagy. Br J Pharmacol. 2016;173:980–991. doi: 10.1111/bph.13397. [DOI] [PMC free article] [PubMed] [Google Scholar]
- 7.Zhang C, Xiao Y, Li L, Li W, Yin X. Comparative studies on contents of iridoid in different parts of fruit from Gardenia jasminoides. Zhongguo Zhong Yao Za Zhi. 2009;34:1949–1951. (In Chinese) [PubMed] [Google Scholar]
- 8.Yang YS, Zhang T, Yu SC, Ding Y, Zhang LY, Qiu C, Jin D. Transformation of geniposide into genipin by immobilized β-glucosidase in a two-phase aqueous-organic system. Molecules. 2011;16:4295–4304. doi: 10.3390/molecules16054295. [DOI] [PMC free article] [PubMed] [Google Scholar]
- 9.Katakwar P, Metgud R, Naik S, Mittal R. Oxidative stress marker in oral cancer: A review. J Cancer Res Ther. 2016;12:438–446. doi: 10.4103/0973-1482.151935. [DOI] [PubMed] [Google Scholar]
- 10.Mirzaei HR, Sahebkar A, Salehi R, Nahand JS, Karimi E, Jaafari MR, Mirzaei H. Boron neutron capture therapy: Moving toward targeted cancer therapy. J Cancer Res Ther. 2016;12:520–525. doi: 10.4103/0973-1482.176167. [DOI] [PubMed] [Google Scholar]
- 11.Song S, Hao Y, Yang X, Patra P, Chen J. Using gold nanoparticles as delivery vehicles for targeted delivery of chemotherapy drug fludarabine phosphate to treat hematological cancers. J Nanosci Nanotechnol. 2016;16:2582–2586. doi: 10.1166/jnn.2016.12349. [DOI] [PubMed] [Google Scholar]
- 12.Liu A, Liu S. Noncoding RNAs in growth and death of cancer cells. Adv Exp Med Biol. 2016;927:137–172. doi: 10.1007/978-981-10-1498-7_5. [DOI] [PubMed] [Google Scholar]
- 13.Zhao X, Ju JH, Kim HM, Park KY. Antimutagenic activity and in vitro anticancer effects of bamboo salt on HepG2 human hepatoma cells. J Environ Pathol Toxicol Oncol. 2013;32:9–20. doi: 10.1615/JEnvironPatholToxicolOncol.2013006370. [DOI] [PubMed] [Google Scholar]
- 14.Chen G, Cheng X, Zhao M, Lin S, Lu J, Kang J, Yu X. RIP1-dependent Bid cleavage mediates TNFα-induced but Caspase-3-independent cell death in L929 fibroblastoma cells. Apoptosis. 2015;20:92–109. doi: 10.1007/s10495-014-1058-0. [DOI] [PubMed] [Google Scholar]
- 15.Guerrero AD, Chen M, Wang J. Delineation of the caspase-9 signaling cascade. Apoptosis. 2008;13:177–186. doi: 10.1007/s10495-007-0139-8. [DOI] [PubMed] [Google Scholar]
- 16.Agostini-Dreyer A, Jetzt AE, Stires H, Cohick WS. Endogenous IGFBP-3 mediates intrinsic apoptosis through modulation of Nur77 phosphorylation and nuclear export. Endocrinology. 2015;156:4141–4151. doi: 10.1210/en.2015-1215. [DOI] [PubMed] [Google Scholar]
- 17.Nakazawa M, Matsubara H, Matsushita Y, Watanabe M, Vo N, Yoshida H, Yamaguchi M, Kataoka T. The human Bcl-2 family Member Bcl-rambo localizes to mitochondria and induces apoptosis and morphological aberrations in drosophila. PLoS One. 2016;11:e0157823. doi: 10.1371/journal.pone.0157823. [DOI] [PMC free article] [PubMed] [Google Scholar]
- 18.Tiwari P, Khan MJ. Molecular and computational studies on apoptotic pathway regulator, Bcl-2 gene from breast cancer cell line MCF-7. Indian J Pharm Sci. 2016;78:87–93. doi: 10.4103/0250-474X.180254. [DOI] [PMC free article] [PubMed] [Google Scholar]
- 19.O'Neill KL, Huang K, Zhang J, Chen Y, Luo X. Inactivation of prosurvival Bcl-2 proteins activates Bax/Bak through the outer mitochondrial membrane. Genes Dev. 2016;30:973–988. doi: 10.1101/gad.276725.115. [DOI] [PMC free article] [PubMed] [Google Scholar]
- 20.Chen SQ, Lin JP, Zheng QK, Chen SJ, Li M, Lin XZ, Wang SZ. Protective effects of paeoniflorin against FasL-induced apoptosis of intervertebral disc annulus fibrosus cells via Fas-FasL signalling pathway. Exp Ther Med. 2015;10:2351–2355. doi: 10.3892/etm.2015.2776. [DOI] [PMC free article] [PubMed] [Google Scholar]
- 21.Shin EM, Kim S, Merfort I, Kim YS. Glycyrol induces apoptosis in human Jurkat T cell lymphocytes via the Fas-FasL/caspase-8 pathway. Planta Med. 2011;77:242–247. doi: 10.1055/s-0030-1250260. [DOI] [PubMed] [Google Scholar]
- 22.Zhang J, Huang K, O'Neill KL, Pang X, Luo X. Bax/Bak activation in the absence of Bid, Bim, Puma, and p53. Cell Death Dis. 2016;7:e2266. doi: 10.1038/cddis.2016.167. [DOI] [PMC free article] [PubMed] [Google Scholar]
- 23.Gongpan P, Lu Y, Wang F, Xu Y, Xiong W. AS160 controls eukaryotic cell cycle and proliferation by regulating the CDK inhibitor p21. Cell Cycle. 2016;15:1733–1741. doi: 10.1080/15384101.2016.1183853. [DOI] [PMC free article] [PubMed] [Google Scholar]
- 24.Wang Y, Wang X, Flores ER, Yu J, Chang S. Dysfunctional telomeres induce p53-dependent and independent apoptosis to compromise cellular proliferation and inhibit tumor formation. Aging Cell. 2016;15:646–660. doi: 10.1111/acel.12476. [DOI] [PMC free article] [PubMed] [Google Scholar]
- 25.Ling Q, Xu X, Wei X, Wang W, Zhou B, Wang B, Zheng S. Oxymatrine induces human pancreatic cancer PANC-1 cells apoptosis via regulating expression of Bcl-2, and IAP families and releasing of cytochrome c. J Exp Clin Cancer Res. 2011;30:66. doi: 10.1186/1756-9966-30-66. [DOI] [PMC free article] [PubMed] [Google Scholar]
- 26.Huang C, Wang J, Lu X, Hu W, Wu F, Jiang B, Ling Y, Yang R, Zhang W. Z-guggulsterone negatively controls microglia-mediated neuroinflammation via blocking IκB-α-NF-κB signals. Neurosci Lett. 2016;619:34–42. doi: 10.1016/j.neulet.2016.02.021. [DOI] [PubMed] [Google Scholar]
- 27.He G, Li LI, Guan E, Chen J, Qin YI, Xie Y. Fentanyl inhibits the progression of human gastric carcinoma MGC-803 cells by modulating NF-κB-dependent gene expression in vivo. Oncol Lett. 2016;12:563–571. doi: 10.3892/ol.2016.4619. [DOI] [PMC free article] [PubMed] [Google Scholar]
- 28.Lu YX, Ju HQ, Wang F, Chen LZ, Wu QN, Sheng H, Mo HY, Pan ZZ, Xie D, Kang TB, et al. Inhibition of the NF-κB pathway by nafamostat mesilate suppresses colorectal cancer growth and metastasis. Cancer Lett. 2016;380:87–97. doi: 10.1016/j.canlet.2016.06.014. [DOI] [PubMed] [Google Scholar]
- 29.McLoed AG, Sherrill TP, Cheng DS, Han W, Saxon JA, Gleaves LA, Wu P, Polosukhin VV, Karin M, Yull FE, et al. Neutrophil-derived IL-1β impairs the efficacy of NF-κB inhibitors against lung cancer. Cell Rep. 2016;16:120–132. doi: 10.1016/j.celrep.2016.05.085. [DOI] [PMC free article] [PubMed] [Google Scholar]
- 30.Wu CY, Wang CJ, Tseng CC, Chen HP, Wu MS, Lin JT, Inoue H, Chen GH. Helicobacter pylori promote gastric cancer cells invasion through a NF-kappaB and COX-2-mediated pathway. World J Gastroenterol. 2005;11:3197–3203. doi: 10.3748/wjg.v11.i21.3197. [DOI] [PMC free article] [PubMed] [Google Scholar]
- 31.Hasan SK, Siddiqi A, Nafees S, Ali N, Rashid S, Ali R, Shahid A, Sultana S. Chemopreventive effect of 18β-glycyrrhetinic acid via modulation of inflammatory markers and induction of apoptosis in human hepatoma cell line (HepG2) Mol Cell Biochem. 2016;416:169–177. doi: 10.1007/s11010-016-2705-2. [DOI] [PubMed] [Google Scholar]
- 32.Chiarugi V, Magnelli L, Gallo O. Cox-2, iNOS and p53 as play-makers of tumor angiogenesis (review) Int J Mol Med. 1998;2:715–719. doi: 10.3892/ijmm.2.6.715. [DOI] [PubMed] [Google Scholar]
- 33.Wan LH, Yao Z, Ni F, Wei M, Zhou Z, Wang HQ, Sun Y, Zhong ZX. Biosynthesis of genipin from gardenoside catalyzed by β-glucosidase in two-phase medium. CIESC J. 2014;65:3583–3591. [Google Scholar]