

Abstract
As a unique member of the cadherin superfamily, T-cadherin (T-cad) has been demonstrated to be associated with gastric cancer (GC) prognosis. To elucidate the function of T-cad in GC in vitro, the present study firstly examined T-cad protein expression in normal and gastric cancer tissues and cell lines, and it was demonstrated to be significantly downregulated in gastric cancer samples compared with normal samples. Control and T-cad expression vectors were then transfected into the MGC8-03 and AGS GC cell lines. Utilizing MTT, clonogenic, flow cytometry, wound healing and Transwell invasion assays in addition to Western blotting, the present study demonstrated that the overexpression of T-cad suppressed GC cell growth and colony formation via cell cycle arrest at the G0/G1 phase via downregulating the expression of cyclin dependent kinase 4 and Cyclin D1. In addition, overexpression of T-cad significantly inhibited GC cell migration and invasion by increasing E-cadherin and decreasing Vimentin expression. These findings suggest T-cad may be important in GC cell proliferation and metastasis and serve as a promising target for the treatment of GC in the future.
Keywords: gastric cancer, T-cadherin, cell proliferation, cell cycle, migration, invasion
Introduction
Gastric cancer (GC), as a common gastrointestinal tumor, is one of the leading causes of cancer related mortality worldwide, particularly in East Asian countries, including China and Japan (1–3). Although surgical resection combined with adjuvant therapy has achieved advances, the 5-year survival rate remains less than 30%, causing unsatisfactory clinical outcome of GC patients (4,5). The main reason is that most patients are diagnosed as unresectable advanced or metastatic stage (6), which make it difficult to improve the early diagnosis and effective treatment for GC. Currently, studies have shown that the initiation and development of GC is closely associated with a sequential accumulation of various molecular and genetic alterations (7,8). Therefore, it is urgently needed to investigate the underlying molecular mechanisms of initiation and metastasis to develop appropriate approaches for improving its diagnosis and treatment.
Cadherins are members of a large family of transmemrane glycoproteins that play an important role in the maintenance of normal tissue architecture by mediating specific cell-cell adhesion, cell recognition and signaling (9,10). Accumulating evidences have shown that perturbations in cadherins are implicated in tumor development, especially in invasion and metastasis (11) as putative products of tumor suppressor genes (12–15). For T-cadherin (T-cad, also known as CDH13 or H-cadherin) is a unique atypical glycosylphosphatidylinositol (GPI)-anchored member of classical cadherin superfamily, which lacks the highly conserved transmembrane and cytoplasmic domains (16–18). Recently, interest in the role of T-cad in human malignancies is increasing. T-cad has been found to be downregulated in lung cancer, ovarian cancer, bladder cancer, cervical and prostate cancer, but abundantly expressed in hepatocellular carcinoma and osteosarcoma (19). Moreover, T-cad could regulate progression of tumor types including breast, hepatic and skin carcinomas by modulating tumor cell proliferation and migration (18). In breast cancer, overexpression of T-cad markedly reduced cell invasive potential and growth rate (20). Wang et al demonstrated reduction of T-cad facilitated tumorigenicity in prostate cancer (21). Notably, T-cad could exert pleiotropic effects to promote tumor growth through different mechanisms on cancer cells in vitro and vivo (22). Although previous studies indicated T-cad is frequently deleted in human GC and decreased T-cad is associated with GC poor prognosis (23,24), little is known about the biological effects of T-cad in GC.
In this study, we showed that T-cad was downregulated in GC tissues and cell lines. Then the effects of T-cad overexpression on the cell proliferation, cell cycle, migration and invasion were further evaluated in GC cells in vitro. Our data indicate that T-cad is involved in uncontrolled cell proliferation and invasion of GC cells by, at least in part, influencing cell growth and motility.
Materials and methods
GC tissue specimens and cell lines
The GC tissue and adjacent noncancerous tissue were collected from patients who underwent surgical resection in our hospital. The fresh tissue samples were immediately snapped-frozen in liquid nitrogen and stored at −80°C for further analysis.
Human GC cell lines, MGC80-3, SGC-7901, AGS, HGC27 and normal human immortalized normal gastric epithelial cell line GES-1 were obtained from the Cancer Research Institution of China Medical University. All of these cell lines were cultured in RPMI-1640 medium (Hyclone, Logan, UT, USA) containing 10% fetal bovine serum (FBS; HyClone), 10 units/ml penicillin and 10 mg/ml streptomycin, and incubated in a 5% CO2 incubator at 37°C.
T-cad overexpressing in GC cell lines
The plasmids for pcDNA3.1 and pcDNA-T-cadherin (pcDNA-Tcad; Invitrogen Life Technologies, Carlsbad, CA, USA) were purchased and respectively transfected into GC cell lines, MGC80-3 and AGS using Lipofectamine® 2000 (Invitrogen Life Technologies) according to manufacturer's instructions. Then stably transfected cells were obtained and cultured for 48 h before confirming the expression of T-cad by qRT-PCR and western blotting.
RNA isolation and qRT-PCR
Total RNA was isolated from tissues or cells using the RNeasy Mini kit (Qiagen, Hilden, Germany) according to the manufacturer's instructions. The gene-specific primers were as follows: T-cad, forward: 5′-TTCAGCAGAAAGTGTTCCATAT-3′, reverse: 5′-GTGCATGGACGAACAGAGT-3′; GAPDH, forward: 5′-GACCCCTTCATTGACCTCAACTAC-3′, reverse: 5′-TGGTGGTGCAGGATGCATTGCTGA-3′. The qRT-PCR was performed on a Fast Real-time PCR 7500 System (Applied Biosystems Life Technologies, Foster City, CA, USA) by using SYBR-Green PCR Master Mix following the reaction procedure: 1 min at 95°C, 40 cycles of 95°C for 5 sec, and 60°C for 20 sec. Gene expression was normalized to the expression of GAPDH by the 2−ΔΔCq method (25). Each experiment was performed in triplicate and repeated three times.
Protein extraction and western blot
Total proteins were extracted from tissues or cells using RIPA lysis buffer (Beyotime Institute of Biotechnology, Shanghai, China). Enhanced BCA Protein Assay Kit (Beyotime Institute of Biotechnology) was used to quantify the protein concentration. Then equivalent proteins of each sample were separated by SDS-PAGE on 10% polyacrylamide gels and transfered to polyvinylidene fluoride membranes (Millipore Corp., Billerica, MA, USA). The membranes were blocked in PBS containing 5% non-fat milk for 2 h at room temperature, and then incubated with primary antibodies, including anti-T-cad (1:1,000; Abcam, Cambridge, MA, USA), anti-CDK4, anti-Cyclin D1, anti-E-cadherin, anti-Vimentin and anti-GAPDH overnight at 4°C. After washing three times with PBS for 5 min, membranes were incubated with the corresponding horseradish peroxidase-conjugated secondary antibodies for 1 h at room temperature. After washing, the target proteins were visualized by an enhanced chemiluminescence detection system. GAPDH was used as an internal control.
Cell viability and colony formation assays
MTT assays were performed every day to determine cell viability in GC cells over the following 5 days. Briefly, cells were seeded in 96-well plates at a density of 2×10³ cells per well and incubated with 20 µl MTT (0.5 mg/ml, Sigma, USA) for 4 h at 37°C. Then, 150 µl dimethylsulfoxide (DMSO; Sigma, St. Louis, MO, USA) was added to dissolve the purple formazan crystals for 1 h. Finally, the absorbance of each well was read on an ELISA reader (Bio-Rad, Berkeley, CA, USA) at a wavelength of 595 nm.
For the colony formation assay, cells (500 cells per well) were cultured in 6-well plates after 48 h transfection. After 7 day culture, the cells were fixed in 4% paraformaldehyde and then stained with crystals purple (Sigma). Surviving colonies (>50 cells per colony) were then observed and manually counted through a light microscope. Each experiment was performed in triplicate and repeated three times.
Cell cycle assay
The cell cycle distribution was analyzed by flow cytometry using PI staining. Briefly, cells were seeded in 6-cm dishes after 48 h transfection at a density of 2×10⁵ cells per dish. Then cells were washed with cold PBS for three times and fixed in 70% ethanol at 4°C for 24 h. After washed with PBS again, cells were then stained with PBS containing 0.05 mg/ml of PI and RNase A (Beyotime Institute of Biotechnology) for 30 min in the dark. Then cells were determined for DNA content using a FACSCalibur (BD Biosciences, San Diego, CA, USA) and data were analyzed with the ModFit DNA software. Each experiment was performed in triplicate and repeated three times.
Wound healing assay
For wound-healing-assay, cells were seeded into 6-well plates and culture overnight until grown to approximately 90% confluence. Then cells were scratched by a 10-µl sterile plastic tip in a definite array. After washing the well with PBS, the cells migrating into the wounded areas were observed and photographed under a fluorescence microscope at 0 and 48 h time points. The cell wound healing rate was evaluated by calculating the percentage of the wound area compared with the area of total cells. Each experiment was performed in triplicate and repeated three times.
Transwell migration and invasion assays
The cell migration assay was performed using a Transwell chambers (8-µm pore size; Corning Inc., Acton, MA, USA). At 48 h after transfection, a total of 1×10⁵ cells were trypsinized and added to the upper chamber in serum-free medium, and culture medium containing 10% FBS was added into the lower chamber. After incubating for 24 h, the cells that migrated into the lower chamber were fixed with 4% paraformaldehyde and stained with crystal violet. Finally, cells were photographed and counted under a microscope. For the cell invasion assay, the procedure was similar to the cell migration assay, except the Transwell chambers were coated with 200 µl of Matrigel. Each experiment was performed in triplicate and repeated three times.
Statistical analysis
All quantitative data were expressed as mean ± standard deviation (SD) of three independent experiments. Statistical analysis was performed using GraphPad Prism 5.0 software (GraphPad Software, Inc., La Jolla, CA, USA). The differences between two groups were evaluated using the Student's t-test. P<0.05 was considered to indicate a statistically significant difference.
Results
Relative low levels of T-cad expression in GC tissues and cell lines
To investigate T-cad expression in GC, 8 pairs of GC and corresponding adjacent noncancerous tissues were collected and the basic clinicopathologic features of patients were summarized in Table I. Then these tissues were subjected to qRT-PCR and western blotting analyses. As shown in Fig. 1A, the mRNA levels of T-cad were significantly downregulated in GC tissues compared with adjacent noncancerous tissues (P=0.0041). In line with this result, clearly decreased levels of T-cad protein were detected in all the tumors tissues in comparison to the paired noncancerous tissues (Fig. 1B). In addition, we examined the expression of T-cad in several GC cell lines. As presented in Fig. 1C and D, the levels of T-cad mRNA and protein in GC cell lines was much lower than that in normal GES-1 cells, of which MGC80-3 and AGS exhibited the lowest signals of T-cad than the other GC cell lines. These data suggested that T-cad might serve as a tumor suppressor in GC.
Table I.
The clinicopathologic factors of gastric cancer (n=8).
| Characteristics | Cases |
|---|---|
| Age (years) | |
| <50 | 5 |
| ≥50 | 3 |
| Gender | |
| Male | 2 |
| Female | 6 |
| TNM stage | |
| I, II | 5 |
| III, IV | 3 |
| Tumor site | |
| Upper | 2 |
| Middle | 3 |
| Low | 3 |
Figure 1.

T-cadherin is downregulated in GC tissues and cell lines. The mRNA and protein levels of T-cadherin in GC tissues and adjacent noncancerous tissues were determined using (A) qRT-PCR and (B) western blotting analyses, respectively. The (C) qRT-PCR and (D) western blotting were used to measure the mRNA and protein levels of T-cadherin in GC cell lines (MGC80-3, SGC-7901, HGC27 and AGS) and normal GES-1 cell line, respectively. Quantitative data were expressed as mean ± standard deviation of three independent experiments. GC, gastric cancer; N, adjacent noncancerous tissues; T, GC tissues; GAPDH serves as an internal control.
Overexpression of T-cad suppressed cellular proliferation ability in GC cells
We successfully constructed stable clones overexpressing T-cad from MGC80-3 and AGS with lower signals of T-cad. As shown in Fig. 2A and B, overexpression of T-cad in the two GC cell lines were confirmed by western blotting after transfection for 48 h. Then MTT and colony formation assays were performed to determine cell proliferation ability. The results showed that GC cell viability was dramatically decreased in T-cad overexpression group compared with the empty vector group in MGC80-3 (Fig. 2C) and AGS (Fig. 2D) cells after transfection for 4 and 5 days (P<0.001). Consistent with the MTT assay, colony formation assay also indicated that T-cad overexpression led to an obvious reduction of colony number in MGC80-3 (Fig. 2E) and AGS (Fig. 2F) cells. Collectively, these findings supports that T-cad could inhibit cell proliferation in GC.
Figure 2.

T-cadherin inhibits GC cell proliferation. Overexpression of T-cadherin protein in transfected cell lines, (A) MGC80-3 and (B) AGS was confirmed by western blotting. MTT assay was used to measure cell viability in (C) MGC80-3 and (D) AGS after transfection with empty vector pcDNA or pcDNA-T-cadherin (pcDNA-Tcad). These data are shown as the mean ± standard deviation of three independent experiments. The size and number of colonies formed in (E) MGC80-3 and (F) AGS cells recorded under a light microscope. The representative pictures shown are from one of three independent experiments. ***P<0.001 vs. control or empty vector pcDNA.
Overexpression of T-cad induced cell cycle G0/G1 arrest in GC
Next, we investigated the mechanisms underlying the growth suppression effects of T-cad overexpression by analyzing cell cycle distribution of GC cells via a flow cytometer. As shown in Fig. 3A, the percentage of cells in G0/G1 phase was significantly increased, but in S phase was remarkably decreased in T-cad overexpression group, compared with control and empty vector groups in MGC80-3 cells (P<0001). Similar results were also found in AGS cells (Fig. 3B, P<0.001, P<0.01). The data revealed that T-cad overexpression could arrest cell cycle at G0/G1 phase, which might be closely associated with growth suppression effects.
Figure 3.

T-cadherin arrested cell cycle at G0/G1 phase in GC cells. Flow cytometry was used to analyze cell cycle distribution in empty vector pcDNA or pcDNA-T-cadherin (pcDNA-Tcad)-transfected (A) MGC80-3 and (B) AGS cells. Left panel shows representative dot plots and right panels show the quantitative analysis. These data are shown as the mean ± standard deviation of three independent experiments. **P<0.01, ***P<0.001 vs. control or empty vector pcDNA.
Overexpression of T-cad reduced cellular motility, migration and invasion in GC
In addition to cell proliferation, we also performed wound-healing and transwell assays to determine the effects of T-cad on GC cell metastatic ability. As shown in Fig. 4A, an evident acceleration in the wound closure rate was observed in control group or empty vector groups compared with cells following pcDNA-Tcad transfection. Quantitative analysis further demonstrated that the wound areas was significantly larger in T-cad overexpression group compared with control group or empty vector group in MGC80-3 cells after incubation for 48 h (P<0001). In transwell assay, the number of migrated cells in pcDNA-Tcad group was significantly reduced compared with the control group or empty vector group MGC80-3 cells (Fig. 4B, P<0.05). Subsequently, cell invasion was determined and the results indicated that the invasive ability of MGC80-3 cells was remarkably suppressed by T-cad overerxpression (Fig. 4C, P<0.01). These consistent results suggested that T-cad could inhibit tumor cell migration and invasion in GC.
Figure 4.

T-cadherin suppressed GC cell motility, migration and invasion. (A) Wound-healing assay was used to evaluate motility of cells transfected with control, empty vector pcDNA, pcDNA-Tcad. The wound area was visualized and calculated at 1 and 48 h. (B) Cell migration transfected with control, empty vector pcDNA, pcDNA-Tcad was examined by transwell assay. (C) The cell invasive ability transected with control, empty vector pcDNA, pcDNA-Tcad was determined by Matrigel cell culture chambers. These data are shown as the mean ± standard deviation of three independent experiments. *P<0.05, **P<0.01, ***P<0.001 vs. control or empty vector pcDNA.
Overexpression of T-cad regulated cell cycle and metastatic markers
To gain insights into the molecular mechanism of the tumor-suppressive effect of T-cad, we detected the expression alterations of some cell cycle regulators and motility markers using Western blotting. As shown in Fig. 5, the expression levels of CDK4 and Cyclin D1, associated with G1-S transition, were obviously downregulated in pcDNA-Tcad group. Furthermore, inhibition of metastasis by T-cad overexpression resulted from downregulation of Vimentin and upregulation of E-cadherin. These results suggest that T-cad inhibits cell proliferation, migration and invasion might by regulating the expression of important markers involved in cell cycle, migration and invasion.
Figure 5.
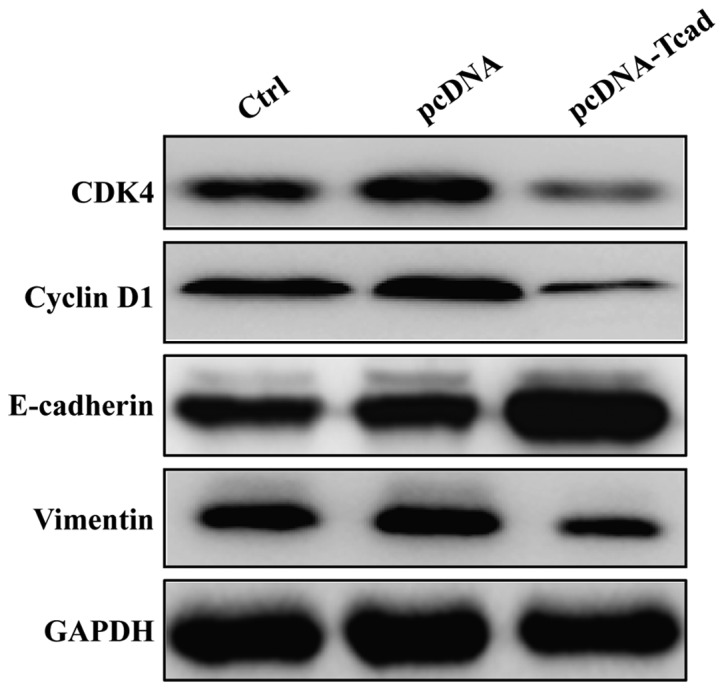
Effect of T-cadherin on markers associated with cell cycle progression and metastatic potential in GC. Western blotting was used to analyze the expression of CDK4, Cyclin D1, E-cadherin, Vimentin and MMP2 in MGC80-3 cells following control, empty vector pcDNA, pcDNA-Tcad transfection, respectively. GAPDH serves as an internal control.
Discussion
T-cad gene is a novel adhesion molecule found to map to chromosome 16q24, a region often exhibiting loss of heterozygosity in cancer including breast, prostate cancer and others (26–28). Recently, it has been reported to be an important independent prognostic predictor in GC. However, its potential biological role in GC remains not fully understood. In this study, we showed that the mRNA and protein expression levels of T-cad were significantly lower in the GC tissues and cell lines compared with controls, which is agreement with the previous reports about decreased T-cad in GC (23,29). Furthermore, we performed gain-of-function assay on GC cells to investigate the biological effects of T-cad on cell proliferation, migration and invasion in vitro. It was found that the proliferative and motility activity of GC cells decreased by T-cad overexpression. Consistent with our data, most studies have shown that enhanced T-cad cDNA expression inhibited tumor cell growth, whereas T-cad silencing stimulated proliferation, invasion and metastasis in several in vitro and in vivo models (22,30–32).
It has been suggested that T-cad may affect cell proliferation through regulating cell cycle progression, as demonstrated by Ivanov et al (33) and Zhong et al (34). To further investigate the underlying mechanism of the growth inhibition effect of T-cad, we determined whether T-cad overexpression had an impact on cell cycle distribution. As expect, T-cad overexpression induced cell cycle arrest at G0/G1 phase through downregulation of CDK4 and Cyclin D1 expression in GC cells. Interestingly, T-cad could negatively regulates the cell proliferation by inducing a delay in the G2/M phase in squamous carcinoma (35) and astrocytomas (36). The different cell cycle arrest mechanisms might be ascribed to different tumor types.
In addition, T-cad encodes a cell surface glycoprotein belonging to the cadherin family responsible for selective cell recognition and adhesion. In human tumors, cell-cell association is often disorganized and thought to be a cause of the unregulated invasion and metastasis behavior of tumor cells (37,38). Therefore, we speculate T-cad might be associated with GC cell migration and invasion. As speculated, our results showed that T-cad overexpression suppressed GC cell migration and invasion by upregulating E-cadherin expression and downregulation the expression of Vimentin and MMP-2. E-cadherin, another of the cadherin family, is an essential adhesive tumor suppressor as the hallmark of epithelial-mesenchymal transition (EMT) (39). Recently, it was reported that loss of E-cadherin promotes tumor metastatic and DNA methylation-induced silencing is significantly correlated with increased invasive potential of melanoma cells (40). Moreover, a significant correlation was found between reduced levels of E-cadherin via promoter aberrant methylation and several poor prognostic factors, namely ulceration, head/neck localization, mitotic count, metastasis and reduced overall/disease-free survival in cutaneous melanoma. Likewise, these above poor prognostic factors are frequently associated with epigenetic downregulation of E-cadherin in mucosal or uveal melanoma (40). These evidences further demonstrated E-cadherin plays a crucial role in the events affeting melanoma progression and might be considered as a prognostic factor for melanoma. In addition, the promoter of E-cadherin frequently underwent hypermethylation in human GC accompanied by inactivation of T-cad, suggesting their positive correlation in GC (41,42). Vimentin, as an intermediate filament during EMT, is required for facilitating mesenchymal cell migration (43). Given the evidence discussed, our findings of their correlation suggest that T-cad might play an important role in GC metastasis by positively regulating E-cadherin expression and negatively regulating Vimentin expression.
Collectively, our study revealed the preliminary biological function of T-cad in GC cells and found restoration of T-cad obviously suppressed GC cell biological behaviors by inhibiting cell proliferation and motility. Our studies suggest that T-cad might represent an important target for GC treatment. In addition, some additional limitations are presented in this study. Firstly, the mRNA determination of CDK4, Cyclin D1, Vimentin and E-cadherin levels following ectopic expression of T-cad was nor performed. Secondly, the luciferase assay was absent not to demonstrate whether T-cadherin directly or indirectly regulated these downstream molecules. Therefore, still further analysis of T-cad regulation in GC will be the aim of or future work.
Acknowledgements
The present study was supported by funding from the Medical Foundation of Fujian (no. 2015J01439).
References
- 1.Piazuelo MB, Correa P. Gastric cáncer: Overview. Colomb Med (Cali) 2013;44:192–201. [PMC free article] [PubMed] [Google Scholar]
- 2.Torre LA, Bray F, Siegel RL, Ferlay J, Lortet-Tieulent J, Jemal A. Global cancer statistics, 2012. CA Cancer J Clin. 2015;65:87–108. doi: 10.3322/caac.21262. [DOI] [PubMed] [Google Scholar]
- 3.Sugano K. Screening of gastric cancer in Asia. Best Pract Res Clin Gastroenterol. 2015;29:895–905. doi: 10.1016/j.bpg.2015.09.013. [DOI] [PubMed] [Google Scholar]
- 4.Xia P, Song CL, Liu JF, Wang D, Xu XY. Prognostic value of circulating CD133(+) cells in patients with gastric cancer. Cell Prolif. 2015;48:311–317. doi: 10.1111/cpr.12175. [DOI] [PMC free article] [PubMed] [Google Scholar]
- 5.Gigek CO, Chen ES, Calcagno DQ, Wisnieski F, Burbano RR, Smith MA. Epigenetic mechanisms in gastric cancer. Epigenomics. 2012;4:279–294. doi: 10.2217/epi.12.22. [DOI] [PubMed] [Google Scholar]
- 6.Zhu W, Ye L, Zhang J, Yu P, Wang H, Ye Z, Tian J. PFK15, a small molecule inhibitor of PFKFB3, induces cell cycle arrest, apoptosis and inhibits invasion in gastric cancer. PLoS One. 2016;11:e0163768. doi: 10.1371/journal.pone.0163768. [DOI] [PMC free article] [PubMed] [Google Scholar]
- 7.Yasui W, Sentani K, Sakamoto N, Anami K, Naito Y, Oue N. Molecular pathology of gastric cancer: Research and practice. Pathol Res Pract. 2011;207:608–612. doi: 10.1016/j.prp.2011.09.006. [DOI] [PubMed] [Google Scholar]
- 8.Baniak N, Senger JL, Ahmed S, Kanthan SC, Kanthan R. Gastric biomarkers: A global review. World J Surg Oncol. 2016;14:212. doi: 10.1186/s12957-016-0969-3. [DOI] [PMC free article] [PubMed] [Google Scholar]
- 9.Nagafuchi A, Tsukita S, Takeichi M. Transmembrane control of cadherin-mediated cell-cell adhesion. Semin Cell Biol. 1993;4:175–181. doi: 10.1006/scel.1993.1021. [DOI] [PubMed] [Google Scholar]
- 10.Takeichi M. Cadherin cell adhesion receptors as a morphogenetic regulator. Science. 1991;251:1451–1455. doi: 10.1126/science.2006419. [DOI] [PubMed] [Google Scholar]
- 11.Wheelock MJ, Johnson KR. Cadherins as modulators of cellular phenotype. Annu Rev Cell Dev Biol. 2003;19:207–235. doi: 10.1146/annurev.cellbio.19.011102.111135. [DOI] [PubMed] [Google Scholar]
- 12.Takeichi M. Cadherins in cancer: Implications for invasion and metastasis. Curr Opin Cell Biol. 1993;5:806–811. doi: 10.1016/0955-0674(93)90029-P. [DOI] [PubMed] [Google Scholar]
- 13.Mayer B, Johnson JP, Leitl F, Jauch KW, Heiss MM, Schildberg FW, Birchmeier W, Funke I. E-cadherin expression in primary and metastatic gastric cancer: Down-regulation correlates with cellular dedifferentiation and glandular disintegration. Cancer Res. 1993;53:1690–1695. [PubMed] [Google Scholar]
- 14.Bringuier PP, Umbas R, Schaafsma HE, Karthaus HF, Debruyne FM, Schalken JA. Decreased E-cadherin immunoreactivity correlates with poor survival in patients with bladder tumors. Cancer Res. 1993;53:3241–3245. [PubMed] [Google Scholar]
- 15.Oka H, Shiozaki H, Kobayashi K, Inoue M, Tahara H, Kobayashi T, Takatsuka Y, Matsuyoshi N, Hirano S, Takeichi M, et al. Expression of E-cadherin cell adhesion molecules in human breast cancer tissues and its relationship to metastasis. Cancer Res. 1993;53:1696–1701. [PubMed] [Google Scholar]
- 16.Angst BD, Marcozzi C, Magee AI. The cadherin superfamily: Diversity in form and function. J Cell Sci. 2001;114:629–641. doi: 10.1242/jcs.114.4.629. [DOI] [PubMed] [Google Scholar]
- 17.Takeuchi T, Ohtsuki Y. Recent progress in T-cadherin (CDH13, H-cadherin) research. Histol Histopathol. 2001;16:1287–1293. doi: 10.14670/HH-16.1287. [DOI] [PubMed] [Google Scholar]
- 18.Philippova M, Joshi MB, Kyriakakis E, Pfaff D, Erne P, Resink TJ. A guide and guard: The many faces of T-cadherin. Cell Signal. 2009;21:1035–1044. doi: 10.1016/j.cellsig.2009.01.035. [DOI] [PubMed] [Google Scholar]
- 19.Andreeva AV, Kutuzov MA. Cadherin 13 in cancer. Genes Chromosomes Cancer. 2010;49:775–790. doi: 10.1002/gcc.20787. [DOI] [PubMed] [Google Scholar]
- 20.Lee SW. H-cadherin, a novel cadherin with growth inhibitory functions and diminished expression in human breast cancer. Nat Med. 1996;2:776–782. doi: 10.1038/nm0796-776. [DOI] [PubMed] [Google Scholar]
- 21.Wang XD, Wang BE, Soriano R, Zha J, Zhang Z, Modrusan Z, Cunha GR, Gao WQ. Expression profiling of the mouse prostate after castration and hormone replacement: Implication of H-cadherin in prostate tumorigenesis. Differentiation. 2007;75:219–234. doi: 10.1111/j.1432-0436.2006.00135.x. [DOI] [PubMed] [Google Scholar]
- 22.Pfaff D, Philippova M, Kyriakakis E, Maslova K, Rupp K, Buechner SA, Iezzi G, Spagnoli GC, Erne P, Resink TJ. Paradoxical effects of T-cadherin on squamous cell carcinoma: Up- and down-regulation increase xenograft growth by distinct mechanisms. J Pathol. 2011;225:512–524. doi: 10.1002/path.2900. [DOI] [PubMed] [Google Scholar]
- 23.Tang Y, Dai Y, Huo J. Decreased expression of T-cadherin is associated with gastric cancer prognosis. Hepatogastroenterology. 2012;59:1294–1298. doi: 10.5754/hge12016. [DOI] [PubMed] [Google Scholar]
- 24.Mori Y, Matsunaga M, Abe T, Fukushige S, Miura K, Sunamura M, Shiiba K, Sato M, Nukiwa T, Horii A. Chromosome band 16q24 is frequently deleted in human gastric cancer. Br J Cancer. 1999;80:556–562. doi: 10.1038/sj.bjc.6690391. [DOI] [PMC free article] [PubMed] [Google Scholar]
- 25.Livak KJ, Schmittgen TD. Analysis of relative gene expression data using real-time quantitative PCR and the 2(-Delta Delta C(T)) Method. Methods. 2001;25:402–408. doi: 10.1006/meth.2001.1262. [DOI] [PubMed] [Google Scholar]
- 26.Lindblom A, Rotstein S, Skoog L, Nordenskjöld M, Larsson C. Deletions on chromosome 16 in primary familial breast carcinomas are associated with development of distant metastases. Cancer Res. 1993;53:3707–3711. [PubMed] [Google Scholar]
- 27.Carter BS, Ewing CM, Ward WS, Treiger BF, Aalders TW, Schalken JA, Epstein JI, Isaacs WB. Allelic loss of chromosomes 16q and 10q in human prostate cancer. Proc Natl Acad Sci USA. 1990;87:8751–8755. doi: 10.1073/pnas.87.22.8751. [DOI] [PMC free article] [PubMed] [Google Scholar]
- 28.Chen T, Sahin A, Aldaz CM. Deletion map of chromosome 16q in ductal carcinoma in situ of the breast: Refining a putative tumor suppressor gene region. Cancer Res. 1996;56:5605–5609. [PubMed] [Google Scholar]
- 29.Wei B, Shi H, Lu X, Shi A, Cheng Y, Dong L. Association between the expression of T-cadherin and vascular endothelial growth factor and the prognosis of patients with gastric cancer. Mol Med Rep. 2015;12:2075–2081. doi: 10.3892/mmr.2015.3592. [DOI] [PubMed] [Google Scholar]
- 30.Pfaff D, Philippova M, Buechner SA, Maslova K, Mathys T, Erne P, Resink TJ. T-cadherin loss induces an invasive phenotype in human keratinocytes and squamous cell carcinoma (SCC) cells in vitro and is associated with malignant transformation of cutaneous SCC in vivo. Br J Dermatol. 2010;163:353–363. doi: 10.1111/j.1365-2133.2010.09801.x. [DOI] [PubMed] [Google Scholar]
- 31.Bosserhoff AK, Ellmann L, Quast AS, Eberle J, Boyle GM, Kuphal S. Loss of T-cadherin (CDH-13) regulates AKT signaling and desensitizes cells to apoptosis in melanoma. Mol Carcinog. 2014;53:635–647. doi: 10.1002/mc.22018. [DOI] [PubMed] [Google Scholar]
- 32.Philippova M, Pfaff D, Kyriakakis E, Buechner SA, Iezzi G, Spagnoli GC, Schoenenberger AW, Erne P, Resink TJ. T-cadherin loss promotes experimental metastasis of squamous cell carcinoma. Eur J Cancer. 2013;49:2048–2058. doi: 10.1016/j.ejca.2012.12.026. [DOI] [PubMed] [Google Scholar]
- 33.Ivanov D, Philippova M, Allenspach R, Erne P, Resink T. T-cadherin upregulation correlates with cell-cycle progression and promotes proliferation of vascular cells. Cardiovasc Res. 2004;64:132–143. doi: 10.1016/j.cardiores.2004.06.010. [DOI] [PubMed] [Google Scholar]
- 34.Zhong Y, Lopez-Barcons L, Haigentz M, Jr, Ling YH, Perez-Soler R. Exogenous expression of H-cadherin in CHO cells regulates contact inhibition of cell growth by inducing p21 expression. Int J Oncol. 2004;24:1573–1579. [PubMed] [Google Scholar]
- 35.Mukoyama Y, Zhou S, Miyachi Y, Matsuyoshi N. T-cadherin negatively regulates the proliferation of cutaneous squamous carcinoma cells. J Invest Dermatol. 2005;124:833–838. doi: 10.1111/j.0022-202X.2005.23660.x. [DOI] [PubMed] [Google Scholar]
- 36.Huang ZY, Wu Y, Hedrick N, Gutmann DH. T-cadherin-mediated cell growth regulation involves G2 phase arrest and requires p21(CIP1/WAF1) expression. Mol Cell Biol. 2003;23:566–578. doi: 10.1128/MCB.23.2.566-578.2003. [DOI] [PMC free article] [PubMed] [Google Scholar]
- 37.Hermiston ML, Gordon JI. Inflammatory bowel disease and adenomas in mice expressing a dominant negative N-cadherin. Science. 1995;270:1203–1207. doi: 10.1126/science.270.5239.1203. [DOI] [PubMed] [Google Scholar]
- 38.Behrens J. The role of cell adhesion molecules in cancer invasion and metastasis. Breast Cancer Res Treat. 1993;24:175–184. doi: 10.1007/BF01833258. [DOI] [PubMed] [Google Scholar]
- 39.Pecina-Slaus N. Tumor suppressor gene E-cadherin and its role in normal and malignant cells. Cancer Cell Int. 2003;3:17. doi: 10.1186/1475-2867-3-17. [DOI] [PMC free article] [PubMed] [Google Scholar]
- 40.Venza M, Visalli M, Catalano T, Biondo C, Beninati C, Teti D, Venza I. DNA methylation-induced E-cadherin silencing is correlated with the clinicopathological features of melanoma. Oncol Rep. 2016;35:2451–2460. doi: 10.3892/or.2016.4618. [DOI] [PubMed] [Google Scholar]
- 41.Tamura G, Yin J, Wang S, Fleisher AS, Zou T, Abraham JM, Kong D, Smolinski KN, Wilson KT, James SP, et al. E-Cadherin gene promoter hypermethylation in primary human gastric carcinomas. J Natl Cancer Inst. 2000;92:569–573. doi: 10.1093/jnci/92.7.569. [DOI] [PubMed] [Google Scholar]
- 42.Hibi K, Kodera Y, Ito K, Akiyama S, Nakao A. Methylation pattern of CDH13 gene in digestive tract cancers. Br J Cancer. 2004;91:1139–1142. doi: 10.1038/sj.bjc.6602095. [DOI] [PMC free article] [PubMed] [Google Scholar]
- 43.Schoumacher M, Goldman RD, Louvard D, Vignjevic DM. Actin, microtubules and vimentin intermediate filaments cooperate for elongation of invadopodia. J Cell Biol. 2010;189:541–556. doi: 10.1083/jcb.200909113. [DOI] [PMC free article] [PubMed] [Google Scholar]