

Abstract
Background
Cancer wasting is characterized by muscle loss and may contribute to fatigue and poor quality of life (QoL). Our aim was to investigate associations between skeletal muscle index (SMI) and skeletal muscle radiodensity (SMD) and selected QoL outcomes in advanced non‐small cell lung cancer (NSCLC) at diagnosis.
Methods
Baseline data from patients with stage IIIB/IV NSCLC and performance status 0–2 enrolled in three randomized trials of first‐line chemotherapy (n = 1305) were analysed. Associations between SMI (cm2/m2) and SMD (Hounsfield units) based on computed tomography‐images at the third lumbar level and self‐reported physical function (PF), role function (RF), global QoL, fatigue, and dyspnoea were investigated by linear regression using flexible non‐linear modelling.
Results
Complete data were available for 734 patients, mean age 65 years. Mean SMI was 47.7 cm2/m2 in men (n = 420) and 39.6 cm2/m2 in women (n = 314). Low SMI values were non‐linearly associated with low PF and RF (men P = 0.016/0.020, women P = 0.004/0.012) and with low global QoL (P = 0.001) in men. Low SMI was significantly associated with high fatigue (P = 0.002) and more pain (P = 0.015), in both genders, but not with dyspnoea. All regression analyses showed poorer physical outcomes below an SMI breakpoint of about 42–45 cm2/m2 for men and 37–40 cm2/m2 for women. In both genders, poor PF and more dyspnoea were significantly associated with low SMD.
Conclusions
Low muscle mass in NSCLC negatively affects the patients' PF, RF, and global QoL, possibly more so in men than in women. However, muscle mass must be below a threshold value before this effect can be detected.
Keywords: Non‐small cell lung cancer, Quality of life, Body composition, Muscle mass
Introduction
Lung cancer is the leading cause of cancer death worldwide,1 most patients (85%) present with non‐small cell lung cancer (NSCLC), and the majority is diagnosed with advanced disease.2 Despite modern chemotherapy and/or novel agents targeting genetic mutations and rearrangements,3, 4 the majority of advanced disease patients does not attain disease control, with 5‐year survival rates not exceeding 1–2%.3, 4, 5 Major treatment goals are therefore to minimize the patients' symptom burden and maintain functioning and quality of life (QoL).6, 7 Weight loss and malnutrition are identified as contributors to poor QoL in NSCLC,8, 9 and weight‐losing patients with inoperable NSCLC report more fatigue, pain, and poorer global QoL than their weight‐stable counterparts.10 Because weight loss leads to loss of lean body mass, these findings might be directly linked to muscle waste. Less muscle mass may influence muscle function and lead to loss of strength, reduced pulmonary function, increased disability, and thereby poorer QoL.11, 12
Recent studies utilizing computed tomography (CT) images to assess skeletal muscle mass have detected that muscle wasting is a prominent feature in NSCLC even with normal or high body mass index (BMI).13, 14 Furthermore, muscle wasting and low muscle mass have been linked to poorer survival and increased risk of treatment toxicity in various cancer diagnoses, including NSCLC.15, 16, 17, 18, 19 In advanced NSCLC, a recent study from our group showed that low muscle mass was a significant predictor for chemotherapy‐induced haematological toxicity.20
Increased fat content within the skeletal muscle may affect the muscle quality and influence both muscle strength and function.21, 22 The fat content in muscle is reflected by the skeletal muscle radiation attenuation also known as skeletal muscle radiodensity (SMD).23 The SMD of human muscle can be obtained by CT scans and is measured as mean Hounsfield units (HU) of the cross‐sectional muscle area.21, 23 Recent studies on cancer patients have indicated that reduced SMD is associated with poorer survival,14, 24 and former results from the present population suggested that SMD may be a more important prognostic factor than skeletal muscle index (SMI) in advanced NSCLC.25 Despite the emerging evidence on the negative impact of low muscle mass, less attention has been paid to the importance of muscle wasting for muscle function in cancer. To our knowledge, the direct associations between CT‐based measures of muscle mass and patient‐reported outcomes reflecting functional status have not formerly been reported in NSCLC. This paper aims to investigate these associations at the time of diagnosis, and we hypothesize that pronounced low muscle mass and low SMD affect patient‐reported functional status, global QoL, dyspnoea, and fatigue negatively and are associated with loss of appetite.
Material and methods
Patients and assessments
The study is based on three subsequent randomized controlled trials (RCTs), conducted between 2003 and 2009, comparing different first‐line chemotherapy regimens in advanced NSCLC.26, 27, 28 Overall survival, QoL, and toxicity were the main endpoints, and the main inclusion criteria were similar: chemonaïve patients, age ≥ 18 years, stage IIIB/IV, and performance status 0–2. Median survival was not significantly different between trial arms, in any of the RCTs and ranged between 6.3 and 7.3 months in all trials. For the present study, only baseline data acquired before start of treatment were used. Complete data on relevant muscle measures and appetite loss were required for inclusion in the present study.
Baseline data comprised demographics, disease stage, histology, performance status, height, weight, and QoL. QoL was assessed using the European Organization for Research and Treatment of Cancer Quality of Life Core Questionnaire (QLQ)‐Core 3029 and the lung cancer‐specific module QLQ‐Lung Cancer 13.30 The QoL baseline assessments were performed at inclusion, before start of chemotherapy. For the purpose of the present study, we used the two functional scales: physical function (PF) with five items and role function (RF) with two items, the global QoL scale (two items), the fatigue scale (three items), and one single item on appetite loss. From QLQ‐Lung Cancer 13, the three‐item dyspnoea scale was used as it gives a wider picture of respiratory problems than the single dyspnoea item of the QLQ‐Core 30. All items are scored on a 4‐point ordinal scale, except the two items of the global QoL scale that are scored on a 7‐point scale. Before statistical analyses, the scale scores were linearly transformed to a 0–100 scale as recommended in the European Organization for Research and Treatment of Cancer scoring manual.31 Higher scores on the functional and global QoL scales represent better functioning/QoL, whereas higher scores on fatigue, dyspnoea, and appetite loss indicate more symptoms. Differences of 10 points or more are usually regarded as clinically significant32 and as such perceptible to patients.
A CT scan of the thorax/upper abdomen was performed within 4 weeks before the baseline QoL registrations and start of chemotherapy. The CT scans were analysed using Slice‐O‐Matic software (v.4.3 Tomovision, Montreal Canada) by three observers blinded for patient data. The total cross‐sectional areas of skeletal muscle and adipose tissue (cm2) were quantified from images at the third lumbar (L3) level, which is strongly correlated to the corresponding whole body tissue masses.33 For tissue demarcation, pre‐established thresholds of HU in the range of −29 to +150 HU for muscle tissue, −150 to −50 HU for visceral adipose tissue, and −190 to −30 HU for subcutaneous and intramuscular adipose tissue were used.34 As a measure of skeletal muscle mass, the total cross‐sectional skeletal muscle area (cm2) was normalized for stature by dividing by squared height (m2) and expressed as SMI (cm2/m2). SMD was measured as the mean HU of the entire cross‐sectional muscle area at L3. BMI was calculated from the weight and height (kg/m2).
Statistics
Data from all RCTs were analysed jointly. Because of the descriptive context, we report mean values and range. Independent sample t‐tests were used to investigate differences between groups on continuous variables. For categorical variables, Pearson's chi‐squared tests were applied.
Because of gender differences in muscle mass, the association to baseline QoL parameters were analysed separately for men and women. SMI was defined as the explanatory variable for muscle mass. The association between SMI and the defined outcomes was investigated by linear regression using flexible non‐linear modelling with restricted cubic splines35, 36 and likewise the association between SMD and the defined outcomes.
Using restricted cubic splines, no assumption of the specific form of the relationship is needed. It means that the independent variable is transformed into segments, defined by knots allowing for smoothly fitted curves for each segment. The procedure includes formal tests of linearity in the relationships and allows for flexible descriptions of non‐linearity. The increase of degrees of freedom is moderate. Modelling using restricted cubic splines is available in commonly used regression models including linear, logistic, and Cox regression. The main analyses were unadjusted, and in addition, sensitivity to adjustment for age and stage was investigated as these variables were judged to be the most relevant, possible confounding factors.
Being assessed by a single item, the scores for appetite loss had only four possible response categories. Thus, the linear regression method applied for the other QoL parameters was not suitable to investigate the association between the muscle measures and this symptom. Hence, to explore a possible relationship, mean SMI and mean SMD were compared between patients reporting no appetite loss and those who indicated having either ‘a little’, ‘quite a bit’, or ‘very much’.
All P‐values were two‐sided, and values <0.05 defined statistical significance. Analyses were performed using R (The R foundation for statistical computing, Vienna, Austria) with the R package rms for flexible non‐linear modelling and with IBM SPSS v.18 (Armonk, NY, USA).
Ethics
The study was performed according to the Helsinki declaration and approved by the Regional Committee for Medical Research Ethics South‐East.
Results
Study population and general characteristics
A total of 1305 patients were included in the RCTs. Baseline CT scans were collected from 1119 patients (86%). Because of lack of images at the L3‐level or poor image quality, only 771 patients were available for quantification of muscle mass. Another 37 patients were excluded because of missing data on height, appetite loss, or SMD, leaving 734 patients for the present analyses. Most missing CT scans were from the earliest study (RCT 1, n = 174) as they were stored on film and not analysable. The final sample of the present study included 420 men (57%) and 314 women (43%) with a mean age of 66.5 and 63.7 years, respectively. The included patients comprised a lower proportion of stage IIIB and a higher proportion of performance status one than the excluded. Otherwise, the two cohorts were comparable. The distribution of chemotherapy regimens and baseline characteristics were also comparable between genders. A full description of the selection of patients, the study population, and the excluded patients has been presented earlier.25
Body composition
The mean BMI of both genders was within the normal range (Table 1). Overall, a BMI below 20 (underweight) was found in 18% of our patients, while 5% presented with a BMI ≥ 30 (obesity). The muscle measures varied largely, but the variables did not deviate substantially from normal distributions. The mean skeletal muscle area was 148.8 cm2 (SD 23.8) in men and 107.3 cm2 (SD 16.3) in women (P < 0.001), and the SMI was 47.7 cm2/m2 (SD 7.6, range 27.9–74.5) and 39.6 cm2/m2 (SD 5.7, range 26.1–54.6) (P < 0.001) in men and women, respectively. The mean SMD was 37.4 HU (SD 8.1, range 15.8–60.4) in men and 37.0 HU (SD 9.0, range 14.8–62.3) in women (ns). A detailed description of how SMI and SMD differed according to stage of disease, age, and performance status for each gender separately is to be found in a supplementary table (Supplementary Information, Table S1).
Table 1.
Baseline patient characteristics
| Patients | ||||||
|---|---|---|---|---|---|---|
| All | Men | Women | ||||
| n = 734 | n = 420 | n = 314 | ||||
| (100%) | (57.2%) | (42.8%) | ||||
| Age, years, mean (SD) | 65.4 (9.4) | 66.5 (8.8) | 63.7 (9.8) | |||
| Follow‐up, months, median (SD) | 7.2 (7.5) | 6.4 (7.1) | 8.0 (8.0) | |||
| n | % | n | % | n | % | |
| Age ≥ 75 | 132 | 18.0 | 80 | 19.0 | 52 | 16.6 |
| Histology | ||||||
| Squamous | 171 | 23.3 | 122 | 29.0 | 49 | 15.6 |
| Adenocarcinoma | 388 | 52.9 | 197 | 46.9 | 191 | 60.8 |
| Large cell | 46 | 6.3 | 23 | 5.5 | 23 | 7.3 |
| Other | 129 | 17.6 | 78 | 18.6 | 51 | 16.2 |
| Disease stage | ||||||
| Stage IIIB | 152 | 20.7 | 83 | 19.8 | 69 | 22.0 |
| Stage IV | 582 | 79.3 | 337 | 80.2 | 245 | 78.0 |
| Performance status (PS) | ||||||
| PS 0 | 165 | 22.5 | 98 | 23.3 | 67 | 21.3 |
| PS 1 | 404 | 55.0 | 226 | 53.8 | 178 | 56.7 |
| PS 2 | 165 | 22.5 | 96 | 22.9 | 69 | 22.0 |
| Study | ||||||
| RCT 1 | 153 | 20.8 | 93 | 22.1 | 60 | 19.1 |
| RCT 2 | 266 | 36.2 | 153 | 36.4 | 113 | 36.0 |
| RCT 3 | 315 | 42.9 | 174 | 41.4 | 141 | 44.9 |
| BMI, kg/m2, mean (SD) | 23.4 (3.9) | 23.5 (3.6) | 23.4 (4.3) | |||
BMI, body mass index; RCT, randomized controlled trial; SD, standard deviation.
Quality of life and association to muscle measurements
The patients' baseline QoL data are presented in Table 2. There were statistically significant differences between men and women for global QoL and fatigue. None of these differences exceeded 10 points, and they were all in favour of better scores among men. Appetite loss was reported by 224 (53.3%) men and 178 (56.7%) women.
Table 2.
Baseline scores on the quality of life scales hypothesized to be affected by muscle wasting and low muscle radiation attenuation, all patients and according to gender
| Quality of life scores | |||||
| All patients | Men | Women | |||
| Mean | SD | Mean | Mean | P | |
| QLQ‐C30 | |||||
| Physical function | 64.3 | +/−24.0 | 65.6 | 62.4 | 0.080 |
| Role function | 51.5 | +/−35.0 | 51.5 | 51.4 | 0.950 |
| Global QoL | 52.7 | +/−24.6 | 55.0 | 49.7 | 0.004 |
| Fatigue | 47.7 | +/−27.3 | 46.0 | 50.0 | 0.047 |
| Appetite loss | 33.4 | +/−36.3 | 32.1 | 35.2 | 0.240 |
| LC‐13 | |||||
| Dyspnoea | 38.7 | +/−26.3 | 38.7 | 38.6 | 0.979 |
QoL, quality of life; SD, standard deviation; QLQ‐C30, Quality of Life Questionnaire‐Core 30; LC‐13, Lung Cancer‐13.
Diagrams illustrating the associations between SMI and PF, RF and global QoL including 95% confidence intervals are displayed in Figure 1. For both genders, the regression analyses showed significant non‐linear associations between SMI and PF (men: P = 0.016, women: P = 0.004), and between SMI and RF (men: P = 0.020, women: P = 0.012). For global QoL, there was a significant association to SMI only for men (P = 0.001). Below a breakpoint at about 42–45 cm2/m2 for men and 37–40 cm2/m2 for women, the patients' scores deteriorated with decreasing SMI. SMI values above this breakpoint were associated with relatively stable PF and RF scores. Fatigue (Figure 2) varied significantly with SMI but only in the male population (P = 0.002). The associations between SMI and dyspnoea were insignificant for both genders (P ≥ 0.493). All regression curves had breakpoints corresponding to those observed for PF and RF, below which the reported symptom level rapidly increased with decreasing SMI. Adjustment for age and stage of disease did not substantially change the slopes of any of the regression curves, and the breakpoints generally corresponded to those found in the unadjusted analyses. Furthermore, the associations that were significant in the unadjusted analyses were also significant in adjusted analyses.
Figure 1.
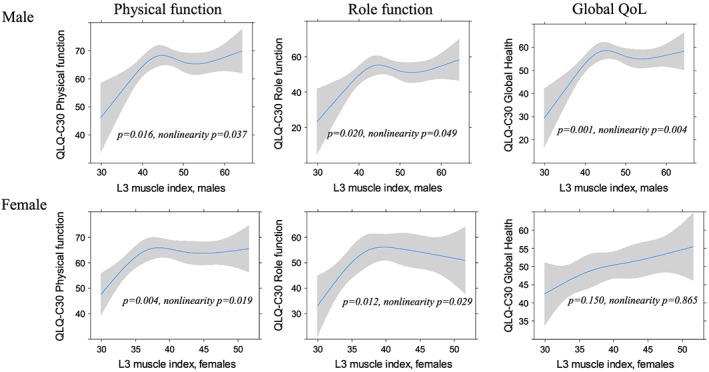
The relation between the third lumbar (L3) skeletal muscle index (cm2/m2) and physical function, role function, and global quality of life (QoL).
Figure 2.
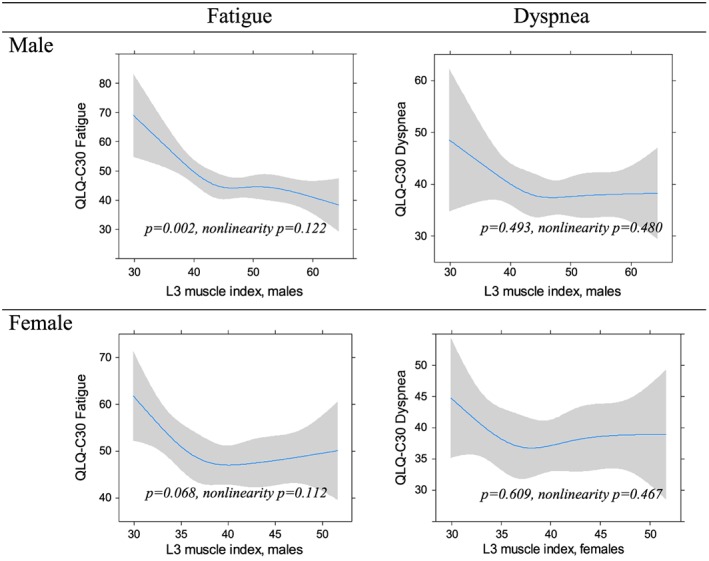
The relation between the third lumbar (L3) skeletal muscle index (cm2/m2) and fatigue and dyspnoea.
Men who reported appetite loss had a significantly lower SMI (46.6 cm2/m2) compared with those who did not (48.8 cm2/m2) (P = 0.003). For women, there was a trend in the same direction. SMI was 39.1 cm2/m2 and 40.3 cm2/m2 among women with and without appetite loss, respectively (P = 0.058).
For both genders, the regression analyses showed significant associations between SMD and PF (men: P = 0.015, women: P < 0.001) and between SMD and dyspnoea (men: P = 0.002, women: P = 0.01). These associations were not significantly non‐linear, but a trend of patterns with a breakpoint as for the associations between SMI and the QoL variables was seen. This breakpoint was similar for men and women, around 32–34 HU. Adjusted for age and stage of disease, the slopes and the corresponding breakpoints remained visually similar. SMD and dyspnoea were also still significantly associated (men: P = 0.005, women P = 0.029), whereas the association between SMD and PF was significant for women only (men: P = 0.053, women: P = 0.002). In the unadjusted analysis, SMD was also significantly associated to fatigue among men (P = 0.041), and the association was significantly non‐linear (P = 0.028). With adjustment for age and stage of disease, the association was no longer significant (P = 0.066), but the association was significantly non‐linear (P = 0.035).
Discussion
This study provides new findings regarding the relationship between low muscle mass in cancer and QoL. We found that low muscle mass (expressed as SMI) was significantly non‐linearly associated with self‐reported functional deterioration in advanced NSCLC patients of both genders also when adjusted for age and stage of disease. In our male cohort, low SMI was also significantly associated with poor global QoL and high intensity of fatigue but did not show significant non‐linearity. SMD, which gives an indication of fat infiltration in muscle that may affect both muscle strength and function,21, 23 was significantly associated with PF and dyspnoea for both genders. However, adjusted analyses demonstrated no significant association with PF in the male cohort but a significant association to fatigue.
In the present study, muscle assessments were performed with a well‐established radiological method,14 and we used widely accepted attenuation ranges for the demarcation of muscle area (−29 to +150 HU).23 To assess QoL, validated and widely used questionnaires were applied, and the results are based on data from a large, disease‐specific, relatively homogeneous cohort with advanced NSCLC. All patients were enrolled in nationwide RCTs according to similar criteria, and all assessments were obtained before start of treatment. A primary study limitation was that muscle measures could not be obtained for a substantial proportion of the targeted population. The exclusion of patients from the original cohorts was, however, mainly due to technicalities, and we therefore believe that our findings are representative for NSCLC patients eligible for first‐line palliative chemotherapy. Because the RCTs were not designed for the present purpose and the cross‐sectional design, data on weight loss and comorbidity were not available for all patients, and we do not know if the muscle loss was recent or not. Thus, we cannot rule out that the influence of low muscle mass on QoL may differ according to aetiology and rate of development.
To the best of our knowledge, only one study has performed analyses that are somewhat similar to ours in a cancer population. In this study of a variety of advanced cancers, there were no statistically significant associations between SMI and dyspnoea, fatigue, or appetite loss.37 However, the results from our cohort visually indicated that muscular mass had to fall below a certain value before a negative impact on physical function and the other QoL scores could be detected. A corresponding trend was found for SMD. Declining physical function and performance has traditionally been attributed to decreased muscle mass, but our results indicate that modest reductions in skeletal muscle mass, as measured by SMI, may not affect function. This is in line with emerging evidence from non‐cancer populations showing similar non‐linear relationships between muscle mass and functional status. In elderly patients, it is demonstrated that muscle waste has to progress to a point below 30% of the mean of young adults before decrease in functional abilities are observed.21, 38 It has also been shown that physical performance is not solely dependent on muscle mass but also muscle strength.22, 39 Muscle strength, in turn, is reported to be independently associated with muscle radiodensity,40 and in accordance with our findings, greater muscular fat infiltration is found to increase the risk of immobility in older men and women.41
Former studies in cancer patients have mainly linked low muscle mass to increased morbidity and mortality.15, 16, 19, 34, 38 Our study indicates that skeletal muscle mass below formerly reported threshold values (male, SMI < 43 cm2/m2 when BMI <25 and female, SMI < 41 cm2/m2 for all BMI groups)14 is also associated with low physical function and probably affects global QoL. Similar findings have been found in connection with chronic heart failure.39 As low SMI appears to be a benchmark for higher morbidity and mortality, low physical functioning and QOL, maintaining patients above these threshold values could potentially be associated with important clinical benefit. Treatments that will enhance muscle mass or at least slow its depletion, improve strength, and enhance the capacity for independent functioning are therefore needed. Nutritional supplements that are able to generate an anabolic response40 and drugs, for example Anamorelin,41 have demonstrated effects in the prevention and treatment of muscle loss in NSCLC. In future studies, it would be of interest to further investigate these effects as well as combine them with physical activity. It has already been demonstrated that physical activity may enhance muscle mass or at least slow its depletion, improve strength, and enhance the capacity for independent functioning in advanced stages of cancer.42
Our findings indicate a difference between men and women regarding the impact of muscular depletion on global QoL and fatigue. An explanation may be that both global QoL and fatigue are measures that are likely to be influenced by several factors other than muscular depletion and functional ability.
In contrast to our hypothesis, we did not detect a significant association between SMI and dyspnoea. Accordingly, no beneficial effects of muscle mass on lung function have been demonstrated in studies of chronic pulmonary disease,43, 44 indicating that in lung diseases, the disease itself may be more important for the respiratory function than skeletal muscle waste. Still, the regression curves for SMI and dyspnoea showed a similar pattern as the curves for physical and RF, possibly indicating a point below which muscle waste affects dyspnoea. The significant association between SMD and dyspnoea may support this assumption. As documented in geriatric patients, elevated fat content in the skeletal muscle may affect muscle strength more than plain muscle waste.21, 22
Loss of appetite is one of the most prevalent symptoms in advanced cancer and considered an important component of cancer cachexia.45 Both the female and male patients in this study reported average scores above 30 on appetite loss, which is significantly higher than scores seen in the general population.46 We found significant associations between SMI and poor appetite, which may indicate that reduced food intake may have affected the ability to preserve muscle mass.45 Normally, loss of weight includes muscle loss and evolves from decreased food intake. However, many patients with NSCLC lose more weight than expected from an estimated energy deficit.47, 48, 49 This may indicate the presence of cancer cachexia where loss of skeletal muscle mass is considered to be driven by metabolic alterations.49 Whether low muscle mass in this study was related to undernutrition, cancer cachexia, comorbid conditions, or a combination of these cannot be determined from the available data. Thus, the impact of these factors should be further investigated in larger prospective studies.
In conclusion, pronounced low skeletal muscle mass in patients with NSCLC seemed to affect functional status and global health negatively. Our data indicate that these effects occur when muscle mass falls below a breakpoint quite similar to the threshold values formerly found to be associated with increased mortality.34, 38 Our findings show the importance of connecting CT derived body composition to meaningful patient‐centred outcomes. Further studies are warranted both to confirm these findings and to determine the importance of weight loss and cachexia for QoL in cancer patients.
Conflict of interest
There are no conflicts of interests connected to the manuscript.
Supporting information
Table S1. Body composition according to stage, age and physical performance in relation to gender.
Acknowledgements
We want to thank Rachel Murphy (PhD) and Nina Esfandiari (B.Sc) both at the Department of Oncology, University of Alberta, Canada, for their participation in the body composition analyses. Thanks to Nina Helbekkmo and Ingrid Sandstad for handling the collection of CT scans from the VING study. We also thank the Departments of Radiology at Haukeland University Hospital, Bergen, St Olav University Hospital, Trondheim and Hamar, Gjøvik and Kongsvinger Hospital, Innlandet Hospital HF, as well as the following and their respective Departments of Radiology for their participation in the collection of CT scans: Bjørn Wembstad, Hammerfest Hospital and Kåre Hansen, Kirkenes Hospital; Helse Finnmark HF. Nada Zafran Groh, University Hospital North Norway Harstad; University Hospital North Norway HF. Heinrich Backmann, Nordland Hospital Bodø and Finn Larsen Aas, Nordland Hospital Vesterålen; Nordland Hospital HF. Kristina Helander, Helgeland Hospital Mo i Rana; Hans Henrik Strøm, Helgeland Hospital Sandnessjøen; Reidar Berntsen Helgeland, Hospital Mosjøen; Helgeland Hospital HF. Randi Sudbø, Namsos Hospital and Thor Naustdal, Levanger Hospital; Nord Trøndelag HF. Bjørn Jakobsen, Molde Hospital; Finn Wammer, Ålesund Hospital; Ivar Blix, Kristiansund Hospital, and Inge Eskeland, Volda Hospital; Helse Møre og Romsdal HF. Anita Spikkeland, Voss Hospital; Helse Bergen HF. Tesfaye Madebo and Oddveig Garpestad, Stavanger University Hospital HF; Sverre Fluge, Haugesund Hospital; Helse Fonna HF.
The authors certify that they comply with the ethical guidelines for authorship and publishing of the Journal of Cachexia, Sarcopenia and Muscle.50
The study was funded by South‐Eastern Norway Regional Health Authority. The collection of CT scans was supported by unrestricted grants from Pierre Fabre, Norway. The Canadian participation in the body composition analyses was supported by the Canadian Institute of Health Research and Alberta Cancer Foundation.
Bye, A. , Sjøblom, B. , Wentzel‐Larsen, T. , Grønberg, B. H. , Baracos, V. E. , Hjermstad, M. J. , Aass, N. , Bremnes, R. M. , Fløtten, Ø. , and Jordhøy, M. (2017) Muscle mass and association to quality of life in non‐small cell lung cancer patients. Journal of Cachexia, Sarcopenia and Muscle, 8: 759–767. doi: 10.1002/jcsm.12206.
References
- 1. Jemal A, Bray F, Center MM, Ferlay J, Ward E, Forman D. Global cancer statistics. CA Cancer J Clin 2011;61:69–90. [DOI] [PubMed] [Google Scholar]
- 2. Morgensztern D, Ng SH, Gao F, Govindan R. Trends in stage distribution for patients with non‐small cell lung cancer: a National Cancer Database survey. J Thorac Oncol 2010;5:29–33. [DOI] [PubMed] [Google Scholar]
- 3. Schiller JH, Harrington D, Belani CP, Langer C, Sandler A, Krook J, et al. Comparison of four chemotherapy regimens for advanced non‐small‐cell lung cancer. N Engl J Med 2002;346:92–98. [DOI] [PubMed] [Google Scholar]
- 4. Lee CK, Brown C, Gralla RJ, Hirsh V, Thongprasert S, Tsai CM, et al. Impact of EGFR inhibitor in non‐small cell lung cancer on progression‐free and overall survival: a meta‐analysis. J Natl Cancer Inst 2013;105:595–605. [DOI] [PubMed] [Google Scholar]
- 5. Shaw AT, Engelman JA. ALK in lung cancer: past, present, and future. J Clin Oncol 2013;31:1105–1111. [DOI] [PMC free article] [PubMed] [Google Scholar]
- 6. Triano LR, Deshpande H, Gettinger SN. Management of patients with advanced non‐small cell lung cancer. Drugs 2010;70:167–179. [DOI] [PubMed] [Google Scholar]
- 7. Fallowfield LJ, Harper P. Health‐related quality of life in patients undergoing drug therapy for advanced non‐small‐cell lung cancer. Lung Cancer 2005;48:365–377. [DOI] [PubMed] [Google Scholar]
- 8. Khalid U, Spiro A, Baldwin C, Sharma B, McGough C, Norman AR, et al. Symptoms and weight loss in patients with gastrointestinal and lung cancer at presentation. Support Care Cancer 2007;15:39–46. [DOI] [PubMed] [Google Scholar]
- 9. Sanchez‐Lara K, Turcott JG, Juarez E, Guevara P, Nunez‐Valencia C, Onate‐Ocana LF, et al. Association of nutrition parameters including bioelectrical impedance and systemic inflammatory response with quality of life and prognosis in patients with advanced non‐small‐cell lung cancer: a prospective study. Nutr Cancer 2012;64:526–534. [DOI] [PubMed] [Google Scholar]
- 10. Scott HR, McMillan DC, Brown DJ, Forrest LM, McArdle CS, Milroy R. A prospective study of the impact of weight loss and the systemic inflammatory response on quality of life in patients with inoperable non‐small cell lung cancer. Lung Cancer 2003;40:295–299. [DOI] [PubMed] [Google Scholar]
- 11. Kilgour RD, Vigano A, Trutschnigg B, Lucar E, Borod M, Morais JA. Handgrip strength predicts survival and is associated with markers of clinical and functional outcomes in advanced cancer patients. Support Care Cancer 2013;21:3261–3270. [DOI] [PubMed] [Google Scholar]
- 12. Kilgour RD, Vigano A, Trutschnigg B, Hornby L, Lucar E, Bacon SL, et al. Cancer‐related fatigue: the impact of skeletal muscle mass and strength in patients with advanced cancer. J Cachexia Sarcopenia Muscle 2010;1:177–185. [DOI] [PMC free article] [PubMed] [Google Scholar]
- 13. Baracos VE, Reiman T, Mourtzakis M, Gioulbasanis I, Antoun S. Body composition in patients with non‐small cell lung cancer: a contemporary view of cancer cachexia with the use of computed tomography image analysis. Am J Clin Nutr 2010;91:1133S–1137S. [DOI] [PubMed] [Google Scholar]
- 14. Martin L, Birdsell L, Macdonald N, Reiman T, Clandinin MT, McCargar LJ, et al. Cancer cachexia in the age of obesity: skeletal muscle depletion is a powerful prognostic factor, independent of body mass index. J Clin Oncol Off J Am Soc Clin Oncol 2013;31:1539–1547. [DOI] [PubMed] [Google Scholar]
- 15. Arrieta O, De la Torre‐Vallejo M, López‐Macías D, Orta D, Turcott J, Macedo‐Pérez E‐O, et al. Nutritional Status, body surface, and low lean body mass/body mass index are related to dose reduction and severe gastrointestinal toxicity induced by afatinib in patients with non‐small cell lung cancer. Oncologist 2015;20:967–974. [DOI] [PMC free article] [PubMed] [Google Scholar]
- 16. Kazemi‐Bajestani SMR, Mazurak VC, Baracos V. Computed tomography‐defined muscle and fat wasting are associated with cancer clinical outcomes. Semin Cell Dev Biol 2015; Elsevier. [DOI] [PubMed] [Google Scholar]
- 17. Anandavadivelan P, Brismar TB, Nilsson M, Johar AM, Martin L. Sarcopenic obesity: a probable risk factor for dose limiting toxicity during neo‐adjuvant chemotherapy in oesophageal cancer patients. Clin Nutr 2016;35:724–730. [DOI] [PubMed] [Google Scholar]
- 18. Tan B, Brammer K, Randhawa N, Welch N, Parsons S, James E, et al. Sarcopenia is associated with toxicity in patients undergoing neo‐adjuvant chemotherapy for oesophago‐gastric cancer. Euro J Surg Oncol (EJSO) 2015;41:333–338. [DOI] [PubMed] [Google Scholar]
- 19. Jung H‐W, Kim JW, Kim J‐Y, Kim S‐W, Yang HK, Lee JW, et al. Effect of muscle mass on toxicity and survival in patients with colon cancer undergoing adjuvant chemotherapy. Support Care Cancer 2015;23:687–694. [DOI] [PubMed] [Google Scholar]
- 20. Sjøblom B, Grønberg BH, Benth JŠ, Baracos VE, Fløtten Ø, Hjermstad MJ, et al. Low muscle mass is associated with chemotherapy‐induced haematological toxicity in advanced non‐small cell lung cancer. Lung Cancer 2015;90:85–91. [DOI] [PubMed] [Google Scholar]
- 21. Goodpaster BH, Park SW, Harris TB, Kritchevsky SB, Nevitt M, Schwartz AV, et al. The loss of skeletal muscle strength, mass, and quality in older adults: the health, aging and body composition study. J Gerontol Ser A Biol Med Sci 2006;61:1059–1064. [DOI] [PubMed] [Google Scholar]
- 22. Fragala MS, Kenny AM, Kuchel GA. Muscle quality in aging: a multi‐dimensional approach to muscle functioning with applications for treatment. Sports Med 2015;45:641–658. [DOI] [PubMed] [Google Scholar]
- 23. Aubrey J, Esfandiari N, Baracos V, Buteau F, Frenette J, Putman C, et al. Measurement of skeletal muscle radiation attenuation and basis of its biological variation. Acta Physiol 2014;210:489–497. [DOI] [PMC free article] [PubMed] [Google Scholar]
- 24. Antoun S, Lanoy E, Iacovelli R, Albiges‐Sauvin L, Loriot Y, Merad‐Taoufik M, et al. Skeletal muscle density predicts prognosis in patients with metastatic renal cell carcinoma treated with targeted therapies. Cancer 2013;119:3377–3384. [DOI] [PubMed] [Google Scholar]
- 25. Sjøblom B, Grønberg BH, Wentzel‐Larsen T, Baracos VE, Hjermstad MJ, Aass N, et al. Skeletal muscle radiodensity is prognostic for survival in patients with advanced non‐small cell lung cancer. Clin Nutr 2016;35:1386–1393. [DOI] [PubMed] [Google Scholar]
- 26. Helbekkmo N, Sundstrøm S, Aasebø U, Brunsvig PF, Von Plessen C, Hjelde H, et al. Vinorelbine/carboplatin vs gemcitabine/carboplatin in advanced NSCLC shows similar efficacy, but different impact of toxicity. Br J Cancer 2007;97:283–289. [DOI] [PMC free article] [PubMed] [Google Scholar]
- 27. Grønberg BH, Bremnes RM, Fløtten Ø, Amundsen T, Brunsvig PF, Hjelde HH, et al. Phase III study by the Norwegian lung cancer study group: pemetrexed plus carboplatin compared with gemcitabine plus carboplatin as first‐line chemotherapy in advanced non‐small‐cell lung cancer. J Clin Oncol 2009;27:3217–3224. [DOI] [PubMed] [Google Scholar]
- 28. Fløtten Ø, Grønberg B, Bremnes R, Amundsen T, Sundstrøm S, Rolke H, et al. Vinorelbine and gemcitabine vs vinorelbine and carboplatin as first‐line treatment of advanced NSCLC. A phase III randomised controlled trial by the Norwegian Lung Cancer Study Group. Br J Cancer 2012;107:442–447. [DOI] [PMC free article] [PubMed] [Google Scholar]
- 29. Aaronson NK, Ahmedzai S, Bergman B, Bullinger M, Cull A, Duez NJ, et al. The European Organization for Research and Treatment of Cancer QLQ‐C30: a quality‐of‐life instrument for use in international clinical trials in oncology. J Natl Cancer Inst 1993;85:365–376. [DOI] [PubMed] [Google Scholar]
- 30. Bergman B, Aaronson NK, Ahmedzai S, Kaasa S, Sullivan M. The EORTC QLQ‐LC13: a modular supplement to the EORTC Core Quality of Life Questionnaire (QLQ‐C30) for use in lung cancer clinical trials. EORTC Study Group on quality of life. Eur J Cancer 1994;30A:635–642. [DOI] [PubMed] [Google Scholar]
- 31. Fayers PM, Aaronson NK, Bjordal K, Grønvold M, Curran D, Bottomley A. EORTC QLQ‐C30 Scoring Manual. Brussels: European Organisation for Research and Treatment of Cancer; 2001. [Google Scholar]
- 32. Cella D, Hahn EA, Dineen K. Meaningful change in cancer‐specific quality of life scores: differences between improvement and worsening. Qual Life Res 2002;11:207–221. [DOI] [PubMed] [Google Scholar]
- 33. Shen W, Punyanitya M, Wang Z, Gallagher D, St‐Onge M‐P, Albu J, et al. Visceral adipose tissue: relations between single‐slice areas and total volume. Am J Clin Nutr 2004;80:271–278. [DOI] [PMC free article] [PubMed] [Google Scholar]
- 34. Prado CM, Lieffers JR, McCargar LJ, Reiman T, Sawyer MB, Martin L, et al. Prevalence and clinical implications of sarcopenic obesity in patients with solid tumours of the respiratory and gastrointestinal tracts: a population‐based study. Lancet Oncol 2008;9:629–635. [DOI] [PubMed] [Google Scholar]
- 35. Harrell FE. Regression Modeling Strategies: With Applications to Linear Models, Logistic Regression, and Survival Analysis. Springer Science & Business Media; 2013. [Google Scholar]
- 36. Durrleman S, Simon R. Flexible regression models with cubic splines. Stat Med 1989;8:551–561. [DOI] [PubMed] [Google Scholar]
- 37. Parsons HA, Baracos VE, Dhillon N, Hong DS, Kurzrock R. Body composition, symptoms, and survival in advanced cancer patients referred to a phase I service. PLoS One 2012;7: e29330. [DOI] [PMC free article] [PubMed] [Google Scholar]
- 38. van Vledder MG, Levolger S, Ayez N, Verhoef C, Tran TC, Ijzermans JN. Body composition and outcome in patients undergoing resection of colorectal liver metastases. Br J Surg 2012;99:550–557. [DOI] [PubMed] [Google Scholar]
- 39. Fülster S, Tacke M, Sandek A, Ebner N, Tschöpe C, Doehner W, et al. Muscle wasting in patients with chronic heart failure: results from the studies investigating co‐morbidities aggravating heart failure (SICA‐HF). Eur Heart J 2013;34:512–519. [DOI] [PubMed] [Google Scholar]
- 40. Engelen MPKJ, Safar AM, Bartter T, Koeman F, Deutz NEP. High anabolic potential of essential amino acid mixtures in advanced nonsmall cell lung cancer. Ann Oncol 2015;26:1960–1966. [DOI] [PMC free article] [PubMed] [Google Scholar]
- 41. Temel JS, Abernethy AP, Currow DC, Friend J, Duus EM, Yan Y, et al. Anamorelin in patients with non‐small‐cell lung cancer and cachexia (ROMANA 1 and ROMANA 2): results from two randomised, double‐blind, phase 3 trials. Lancet Oncol 2016;17:519–531. [DOI] [PubMed] [Google Scholar]
- 42. Stene GB, Helbostad JL, Balstad TR, Riphagen II, Kaasa S, Oldervoll LM. Effect of physical exercise on muscle mass and strength in cancer patients during treatment–a systematic review. Crit Rev Oncol Hematol 2013;88:573–593. [DOI] [PubMed] [Google Scholar]
- 43. Maiolo C, Mohamed E, Carbonelli M. Body composition and respiratory function. Acta Diabetol 2003;40:s32–s38. [DOI] [PubMed] [Google Scholar]
- 44. Marquis K, Debigaré R, Lacasse Y, LeBlanc P, Jobin J, Carrier G, et al. Midthigh muscle cross‐sectional area is a better predictor of mortality than body mass index in patients with chronic obstructive pulmonary disease. Am J Respir Crit Care Med 2002;166:809–813. [DOI] [PubMed] [Google Scholar]
- 45. Evans WJ, Morley JE, Argiles J, Bales C, Baracos V, Guttridge D, et al. Cachexia: a new definition. Clin Nutr 2008;27:793–799. [DOI] [PubMed] [Google Scholar]
- 46. Hinz A, Singer S, Brähler E. European reference values for the quality of life questionnaire EORTC QLQ‐C30: results of a German investigation and a summarizing analysis of six European general population normative studies. Acta Oncol 2014;53:958–965. [DOI] [PubMed] [Google Scholar]
- 47. Bosaeus I. Nutritional support in multimodal therapy for cancer cachexia. Support Care Cancer 2008;16:447–451. [DOI] [PubMed] [Google Scholar]
- 48. Baracos VE. Cancer‐associated cachexia and underlying biological mechanisms. Annu Rev Nutr 2006;26:435–461. [DOI] [PubMed] [Google Scholar]
- 49. Fearon K, Strasser F, Anker SD, Bosaeus I, Bruera E, Fainsinger RL, et al. Definition and classification of cancer cachexia: an international consensus. Lancet Oncol 2011;12:489–495. [DOI] [PubMed] [Google Scholar]
- 50. von Haehling S, Morley JE, Coats AJS, Anker SD. Ethical guidelines for authorship and publishing in the Journal of Cachexia, Sarcopenia and Muscle. J Cachexia Sarcopenia Muscle 2015;6:315–316. [DOI] [PMC free article] [PubMed] [Google Scholar]
Associated Data
This section collects any data citations, data availability statements, or supplementary materials included in this article.
Supplementary Materials
Table S1. Body composition according to stage, age and physical performance in relation to gender.