

Abstract
Background
A body mass index (BMI) adjusted weight loss grading system (WLGS) is related to survival in patients with cancer. The aim of this study was to examine the applicability of the WLGS by confirming its prognostic validity, evaluating its relationship to cachexia domains, and exploring its ability to predict cachexia progression.
Methods
An international, prospective observational study of patients with incurable cancer was conducted. For each patient, weight loss grade was scored 0–4. Weight loss grade 0 represents a high BMI with limited weight loss, progressing through to weight loss grade 4 representing low BMI and a high degree of weight loss. Survival analyses were used to confirm prognostic validity. Analyses of variance were used to evaluate the relationship between the WLGS and cachexia domains [anorexia, dietary intake, Karnofsky performance status (KPS), and physical and emotional functioning]. Cox regression was used to evaluate if the addition of cachexia domains to the WLGS improved prognostic accuracy. Predictive ability of cachexia progression was assessed by estimating proportion of patients progressing to a more advanced weight loss grade.
Results
One thousand four hundred six patients were analysed (median age 66 years; 50% female, 63% KPS ≤ 70). The overall effect of the WLGS on survival was significant as expressed by change in −2 log likelihood (P < 0.001) and persisted after adjustment for age, sex, and cancer type and stage (P < 0.001). Median survival decreased across the weight loss grades ranging from 407 days (95% CI 312–502)—weight loss grade 0 to 119 days (95% CI 93–145)—weight loss grade 4. All cachexia domains significantly deteriorated with increasing weight loss grade, and deterioration was greatest for dietary intake, with a difference corresponding to 0.87 standard deviations between weight loss grades 0 and 4. The addition of KPS, anorexia, and physical and emotional functioning improved the prognostic accuracy of the WLGS. Likelihood of cachexia progression was greater in patients with weight loss grade 2 (39%) than that with weight loss grade 0 (19%) or 1 (22%).
Conclusions
The WLGS is related to survival, cachexia domains, and the likelihood of progression. Adding certain cachexia domains to the WLGS improves prognostic accuracy.
Keywords: Neoplasms, Cachexia, Classification, Weight loss, Survival, Nutritional status
Introduction
Cancer cachexia was first described by Hippocrates as severe weight loss and a sign of impending death.1 It is considered to be one of the most distressing aspects of advanced cancer, resulting in progressive functional impairment and psychological distress,2, 3 and it impedes the delivery of anticancer treatment.4, 5 About 80% of patients with advanced cancer experience weight loss,6 which is a key component of cancer cachexia. Cachexia contributes to about 20% of cancer‐related deaths.6, 7 Despite this, there has been relatively little research in this area, resulting in a failure to advance treatment and a therapeutic nihilism that cachexia is an inevitable and untreatable consequence of advanced cancer.8
One of the barriers to cachexia research has been the lack of an agreed definition and classification system. The latter is fundamental as cancer cachexia is not a single entity but a syndrome with various stages.9 Various definitions have been used, resulting in heterogeneous research populations, making comparison of findings difficult.10
A major step in advancing the research agenda in cachexia was taken in 2011 when a consensus‐based cachexia definition was published.11 Cachexia was defined as a ‘multifactorial syndrome characterized by an ongoing muscle loss (with or without fat loss) that cannot be fully reversed by nutritional support and leads to progressive functional impairment’.11 Integral was the idea that cachexia is a progressive process from an early to a late stage, and the stages of pre‐cachexia, cachexia, and refractory cachexia were proposed (Figure 1). Diagnostic criteria, based predominantly on weight loss and body mass index (BMI), were assigned to the cachexia stage, whereas for the other stages, only suggestive characteristics were presented. Further work was recommended to validate the definition and classification.
Figure 1.
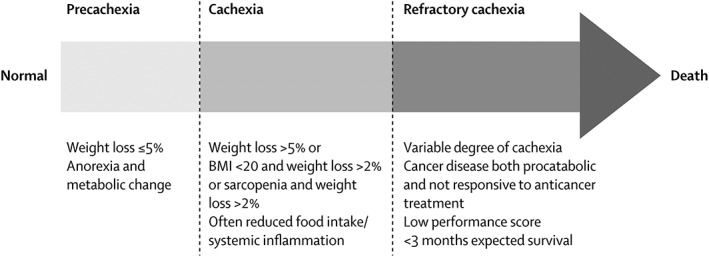
Postulated stages of cachexia (Reprinted from The Lancet Oncology, 12(5), Fearon K, Strasser F, Anker SD, Bosaeus I, Bruera E, Fainsinger RL, et al., Definition and classification of cancer cachexia: an international consensus, 489–95, Copyright (2011), with permission from Elsevier).
Another important step forward was made when Martin et al. 12 confirmed that severity of weight loss depends on the concurrent depletion of fat and muscle reserves. They showed that weight loss, adjusted for concurrent BMI, predicted survival; patients with a low degree of weight loss and a high BMI had the best prognosis, and those with a high degree of weight loss and a low BMI had the worst prognosis. By combining weight loss and BMI, they produced and validated a weight loss grading system (WLGS) ranging from 0 to 4, with each weight loss grade predicting survival independently of cancer type and stage, age, sex, and performance status.
The WLGS was not intended as a classification system of cancer cachexia. However, because weight loss is a key component of the syndrome, the WLGS could still potentially be used to classify cancer cachexia. In order to test this hypothesis, concurrent validity in relation to established cachexia domains needs to be demonstrated. Further, because cachexia is a trajectory from pre‐cachexia to refractory cachexia, a classification system should be able to predict which patients are at risk of having cachexia progression. This is of particular interest early in the cachexia trajectory.
Thus, the present study had three aims: (i) to confirm the prognostic validity of the WLGS in an independent, prospective cohort of patients with incurable cancer; (ii) to evaluate the concurrent validity of the WLGS in relation to cachexia domains (anorexia, dietary intake, performance status, and physical and emotional functioning) and to explore if adding these domains to the WLGS improves prognostic accuracy; and (iii) to evaluate if the WLGS predicts cachexia progression.
Methods
Patients and study design
Between April 2011 and October 2013, 1739 patients from 30 centres across Europe (27), Canada (2), and Australia (1) were included in the European Palliative Care Cancer Symptom study.13 This was a prospective observational study by the European Palliative Care Research Centre (PRC) and the European Association for Palliative Care (EAPC) Research Network with the aim of improving the understanding of the development of symptoms and how these symptoms may best be assessed and classified in order to improve symptom management. Eligible patients met the following key criteria: ≥18 years of age, with incurable cancer, enrolled in a palliative care programme, and available for at least one follow‐up registration. All patients provided written informed consent.
Data collection and weight loss grading
Patients were assessed at baseline and approximately every 4 weeks for at least three follow‐up visits or until death. The following information was collected: patient demographics, height, current body weight, and patient‐reported weight loss in the 6 months prior to inclusion. Weight loss at subsequent visits was computed by adding measured weight change to baseline‐reported weight loss. BMI was recalculated at every visit based on current body weight. Weight loss grade was assessed and given a score of 0–4 by combining weight loss and BMI (Table 1).12
Table 1.
Grading of weight loss (0–4) based on percentage weight loss and current body mass index12
| Body mass index (kg/m2) | ||||||
|---|---|---|---|---|---|---|
| Weight loss (%) | ≥28 | 25–27.9 | 22–24.9 | 20–21.9 | <20 | |
| <2.5 | 0 | 0 | 1 | 1 | 3 | |
| 2.5–5.9 | 1 | 2 | 2 | 2 | 3 | |
| 6–10.9 | 2 | 3 | 3 | 3 | 4 | |
| 11–14.9 | 3 | 3 | 3 | 4 | 4 | |
| ≥15 | 3 | 4 | 4 | 4 | 4 | |
Table 2 includes the items from the Patient‐Generated Subjective Global Assessment (PG‐SGA)14 and the European Organization for Research and Treatment of Cancer Quality of Life Questionnaire (EORTC‐QLQ) C15 PAL15 that were used to collect data pertaining to the cachexia domains for nutrition and functional and psychosocial effects. Both instruments are commonly used and well validated patient reported outcome measurements. The clinical meaning of PG‐SGA scores is listed in Table 2. Regarding the EORTC‐QLQ, a difference in score of ≥20 was considered a definite clinical significant difference, a difference in score of 10–20 was considered a moderate difference, and a difference in score of 5–10 was considered a small difference.16 In addition, health care personnel‐reported performance status (Karnofsky scale) was assessed due to its long standing importance in cancer prognostication.17 The Karnofsky scale ranges from 0 (Dead) to 100 (normal, no complaints, and no evidence of disease).
Table 2.
Cachexia domains assessed
| Cachexia domain | Factors | Reported by | Instrument | Scale |
|---|---|---|---|---|
| Nutrition | Dietary intake | Patient | PG‐SGA (food intake sub‐score)14 |
0 points: unchanged or more than usual 1 point: normal food but less than normal amount (or nutrition by vein) 2 points: little solid food 3 points: only liquids or nutritional supplements 4 points: very little of anything |
| Appetite loss | Patient | EORTC QLQ C15 PAL15 | 0–100a | |
| Functional and psychosocial effects | Emotional functioning | Patient | EORTC QLQ C15 PAL15 | 0–100a |
| Physical functioning | ||||
| Fatigue | ||||
| Performance status | Health care personnel | Karnofsky scale17 | 0–100a |
Abbreviations: EORTC QLQ, European Organization for Research and Treatment of Cancer Quality of Life Questionnaire; PG‐SGA, Patient‐Generated Subjective Global Assessment.
For emotional functioning, physical functioning, and performance status, 100 is the best score, while for appetite loss and fatigue, 100 is the worst score.
Statistical considerations
To evaluate the prognostic validity of the WLGS, time to death or last known date to be alive was calculated and Kaplan–Meier curves were plotted for each grade. Hazard ratios (HRs) were calculated by using Cox proportional hazard methods. Adjustments for possible differences in age, sex, and cancer type (digestive organ cancer, respiratory organ cancer, breast cancer, cancer of urinary tract and male genitalia, gynaecological cancer, haematological cancer, and others) and stage (local, locally advanced, or metastatic/disseminated) between weight loss grades were made. Adjustments for differences in performance status between grades were not performed as a worsening in this parameter is an expected consequence of cachexia progression.
To investigate the baseline differences between weight loss grades 0 and 4 in terms of severity of appetite loss, dietary intake, performance status, fatigue, and physical and emotional functioning, one‐way analysis of variance was used. A linear test for trend was applied to confirm if severity increased with grade. Where normality could not be assumed, the non‐parametric Kruskal–Wallis test and Jonckheere–Terpstra test were used instead. To illustrate the magnitude of change over the entire spectrum of the WLGS, absolute change in mean values between grade 0 and grade 4 was calculated. To rank which domain had the greatest relative change, the absolute change in mean values of each domain was divided by its standard deviation.
To examine if the cachexia domains improved the prognostic validity of the WLGS, a survival prediction model was built by using Cox proportional hazard methods. The general prognostic factors age, sex, and cancer type and stage were added first, and then a forward stepwise (likelihood ratio) method was used to add the cachexia domains (appetite loss, dietary intake, performance status, fatigue, and physical and emotional functioning) and the WLGS.
To assess the likelihood of progression of cachexia during follow‐up, a longitudinal analysis was performed. Weight loss grade was assessed at every follow‐up visit and the proportion of patients progressing to higher grades, improving to lower grades, or dying after 1, 2, and 3 months was calculated.
High attrition resulting in missing data was expected because of patient deterioration. Therefore, a sensitivity analysis replacing missing values with extreme values was performed to assess the robustness of the longitudinal analysis. This significantly altered the results (data not shown), and thus, for patients alive but unable to attend follow‐up, imputations of likely values for missing data on body weight were performed by using the iterative estimation and maximization algorithm with auxiliary variables sex, height, body weight, weight loss, and appetite loss. This was done in order to minimize potential bias that could arise by simply ignoring missing assessments. A moderate effect of imputations was observed, with the largest difference seen in patients with weight loss grade 2, where it led to a computational increase in risk of cachexia progression of 9 percentage points compared with the non‐imputed dataset.
Statistical analyses were performed with IBM SPSS Statistics for Windows, version 21, IBM Corp, Armonk, NY, USA.
Results
A total of 1406 patients had data available on BMI and weight loss at baseline; those who did not were excluded (n = 333). Patient characteristics are shown in Table 3. Median [IQR] age was 66 [57–74] years, 705 (50%) were female, and most were outpatients (1136, 81%) and had a KPS ≤70 (886, 63%). The 333 patients who were excluded were significantly older (median age 70 vs. 66), had a poorer performance status (KPS ≤ 70, 83% vs. 63%) and a shorter median time since diagnosis (13 vs. 19 months), and were more likely to be hospice or nursing home inpatients (25% vs. 6%).
Table 3.
Baseline characteristics of the total population and by weight loss grade
| Total | Weight loss grade | |||||
|---|---|---|---|---|---|---|
| 0 | 1 | 2 | 3 | 4 | ||
| n | 1406 | 326 | 325 | 135 | 347 | 273 |
| Median age [years] (IQR) | 66 (57–74) | 65 (56–73) | 65 (56–74) | 66 (60–74) | 66 (56–74) | 67 (58–75) |
| Sex | ||||||
| Female | 705 (50%) | 173 (53%) | 188 (58%) | 61 (46%) | 166 (48%) | 117 (43%) |
| Male | 700 (50%) | 153 (47%) | 137 (42%) | 74 (54%) | 181 (52%) | 155 (57%) |
| KPS | ||||||
| ≤70 | 886 (63%) | 175 (54%) | 162 (50%) | 86 (64%) | 241 (70%) | 222 (81%) |
| >70 | 517 (37%) | 149 (46%) | 163 (50%) | 49 (36%) | 105 (30%) | 51 (19%) |
| Principal cancer diagnosis | ||||||
| Cancer of the digestive organs | 418 (30%) | 71 (22%) | 85 (26%) | 45 (33%) | 112 (32%) | 105 (38%) |
| Cancer of the respiratory organs | 282 (20%) | 58 (18%) | 63 (19%) | 36 (27%) | 70 (20%) | 55 (20%) |
| Breast cancer | 252 (18%) | 87 (27%) | 83 (26%) | 22 (16%) | 36 (10%) | 24 (9%) |
| Other cancers | 174 (12%) | 33 (10%) | 32 (10%) | 10 (7%) | 57 (16%) | 42 (15%) |
| Urinary cancer or cancer of the male genitalia | 160 (11%) | 43 (13%) | 38 (12%) | 17 (13%) | 40 (12%) | 22 (8%) |
| Gynaecological cancer | 82 (6%) | 27 (8%) | 18 (6%) | 3 (2%) | 16 (5%) | 18 (7%) |
| Haematological cancer | 38 (3%) | 7 (2%) | 6 (2%) | 2 (1%) | 16 (5%) | 7 (3%) |
| Stage | ||||||
| Local | 61 (4%) | 15 (5%) | 17 (5%) | 4 (3%) | 18 (5%) | 7 (3%) |
| Locally advanced | 148 (11%) | 36 (11%) | 27 (8%) | 12 (9%) | 35 (10%) | 38 (14%) |
| Metastatic | 1190 (85%) | 273 (84%) | 279 (86%) | 118 (88%) | 293 (85%) | 227 (83%) |
| Median time since diagnosis [months] (IQR) | 19 (7–48) | 25 (11–58) | 23 (9–51) | 17 (6–37) | 14 (5–38) | 14 (5–43) |
| Current oncologic treatment | ||||||
| No treatment | 560 (40%) | 100 (31%) | 97 (30%) | 52 (39%) | 171 (49%) | 140 (51%) |
| Chemotherapy | 625 (45%) | 153 (47%) | 179 (55%) | 67 (50%) | 129 (37%) | 97 (36%) |
| Radiotherapy | 74 (5%) | 19 (6%) | 17 (5%) | 11 (8%) | 15 (4%) | 12 (4%) |
| Hormonal therapy | 141 (10%) | 48 (15%) | 37 (11%) | 9 (7%) | 24 (7%) | 23 (8%) |
| Other | 83 (6%) | 30 (9%) | 18 (6%) | 6 (4%) | 20 (6%) | 9 (3%) |
| Mean weight loss (6 months)[%] (SD) | 5.9 (7.5) | 0.1 (0.4) | 0.4 (1.2) | 5.3 (2.2) | 8.0 (5.8) | 16.9 (6.1) |
| BMI [kg/m2] (SD) | 24 (4.9) | 29 (3.7) | 24 (3.0) | 26 (5.2) | 23 (3.9) | 20 (2.9) |
Abbreviations: BMI, body mass index; IQR, interquartile range; KPS, Karnofsky performance status; SD, standard deviation.
Of the 1406 patients included, 574 (41%) patients completed 3 months of follow‐up, while 259 (18%) died. A total of 573 (41%) were lost to follow‐up: 239 (17%), 126 (9%), and 208 (15%) after the first, second, and third visits respectively. Although several patients were lost to follow‐up after the baseline visit, survival data was still available for a total of 1327 patients.
Prognostic validity
Survival worsened with increasing weight loss grade (Figure 2). The overall effect of the WLGS on survival was significant as expressed by change in −2 log likelihood (P < 0.001) and persisted after adjustment for age, sex, and cancer type and stage (P < 0.001).
Figure 2.
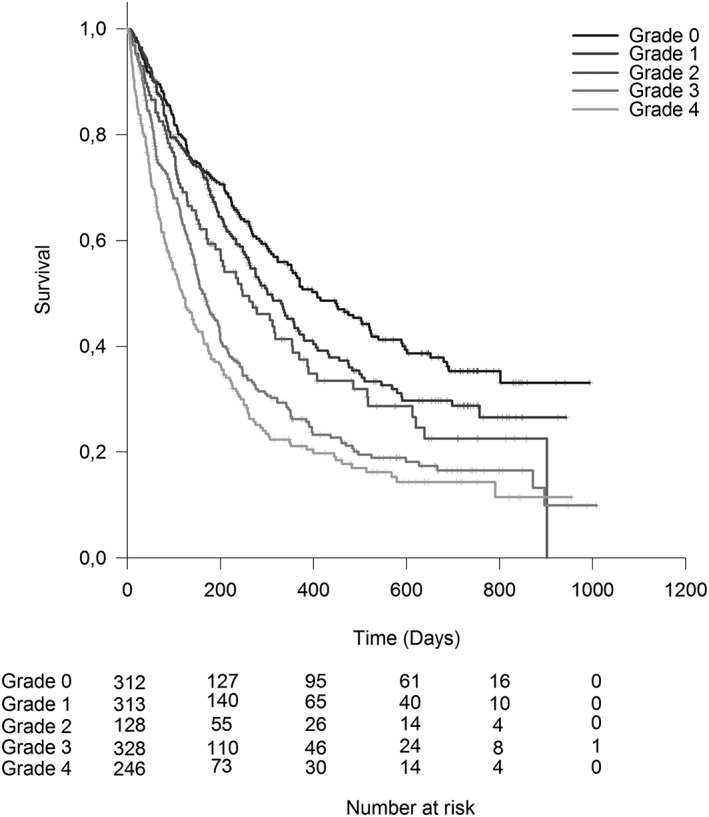
Cumulative survival by weight loss grade.
Median (95% CI) survival ranged from 407 (312–502) days in weight loss grade 0 to 119 (93–145) days in weight loss grade 4 (Table 4). Adjusted HR ranged from 1.2 (P = 0.20) in weight loss grade 1 to 2.2 (P < 0.001) in weight loss grade 4 (Table 4).
Table 4.
Median survival, unadjusted and adjusted HRs, and P‐values by weight loss grade
| Weight loss grade | n a | Number of deaths | Median survival [days] (95% CI) | Unadjusted HR (95% CI) | P | Adjusted HR (95% CI)b | P |
|---|---|---|---|---|---|---|---|
| 0 | 312 | 156 | 407 (312–502) | 1.0 | 1.0 | ||
| 1 | 313 | 164 | 301 (244–358) | 1.2 (1.0–1.5) | 0.11 | 1.2 (0.9–1.4) | 0.20 |
| 2 | 128 | 78 | 247 (154–340) | 1.5 (1.1–1.9) | 0.004 | 1.3 (1.0–1.7) | 0.08 |
| 3 | 328 | 233 | 161 (137–185) | 2.0 (1.6–2.5) | <0.001 | 1.9 (1.5–2.3) | <0.001 |
| 4 | 246 | 186 | 119 (93–145) | 2.6 (2.1–3.2) | <0.001 | 2.2 (1.8–2.8) | <0.001 |
Abbreviations: CI, confidence interval; HR, hazard ratio.
Five patients were excluded from the adjusted analysis because of missing values of independent variables.
Adjusted for age, sex, and cancer type and stage.
Concurrent validity in relation to other cachexia domains and impact on prognostic accuracy
There was a worsening of all cachexia domains with increasing weight loss grade (P < 0.001) (Figure 3). Between grades 0 and 1, the severity of the cachexia domains was similar with overlapping confidence intervals.
Figure 3.
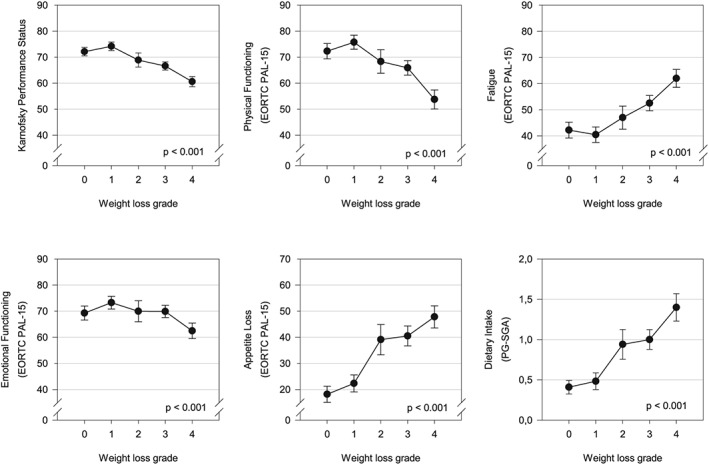
Relationship between the different cachexia domains and weight loss grade (error bars: 95% confidence intervals). Analysis of variance and test for linear trend were significant for all cachexia domains (P < 0.001); this was confirmed by non‐parametric analouges (Kruskal–Wallis test and Jonckheere–Terpstra test) in physical functioning, fatigue, emotional functioning, appetite loss, and dietary intake due to the non‐normal distributions of these variables.
The magnitude of the differences between grades 0 and 4 was greatest for food intake. The mean score worsened from 0.4 to 1.4 (0.87 SD), followed by appetite loss 18 to 48 (0.86 SD), fatigue 42 to 62 (0.69 SD), physical functioning 72 to 54 (0.64 SD), KPS 71 to 63 (0.46 SD), and emotional functioning 69 to 63 (0.29 SD).
When performance status (P < 0.001), physical functioning (P < 0.001), emotional functioning (P = 0.004), and appetite loss (P = 0.005) were added to the WLGS (P < 0.001), the accuracy of survival prediction improved. Of note was that the magnitude of improvement due to performance status (Karnofsky) or physical functioning (EORTC‐QLQ C15 PAL) depended on which of the two factors were added first (data not shown). This indicates some collinearity between the two. However, they were both highly significant when present together, indicating some degree of independent contribution, so both were kept in the model.
Predicting the progression of cachexia
Figure 4 is based on the imputed dataset and presents the likelihood of surviving patients progressing or improving according to the WLGS dependent on their baseline weight loss grade. There was a slightly higher tendency of progression of cachexia in grade 1 compared with grade 0, while the risk was considerably higher in grade 2. The tendency towards improvement declined over the last three grades.
Figure 4.
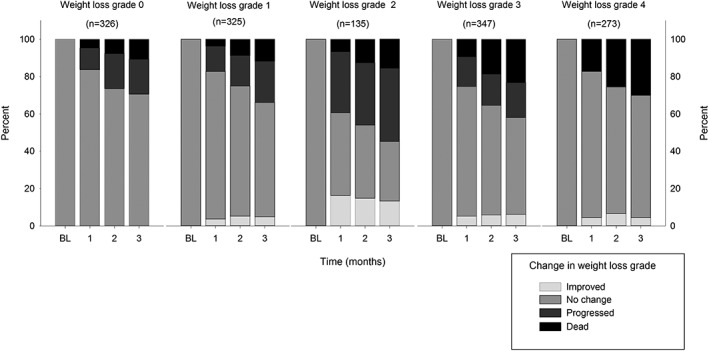
Bar charts for each baseline weight loss grade (0–4) showing the likelihood of improvement to preceding or progress to subsequent grades or death at 1, 2, and 3 months of follow‐up.
After 3 months, the proportions of patients with weight loss grades 0 to 3 progressing to a more advanced weight loss grade were 19%, 22%, 39%, and 19%, respectively. Conversely, those with weight loss grade 1 to 4 improving to a lower weight loss grade were 5%, 13%, 6%, and 4%, respectively.
Discussion
The present study has confirmed the prognostic validity of the WLGS in an independent, prospective cohort of patients with incurable cancer. Moreover, the WLGS also has concurrent validity in relation to established cachexia domains and predicts cachexia progression. It has also been demonstrated that the addition of cachexia domains to the WLGS serves to improve its prognostic accuracy.
The present study has several implications for the management of cancer cachexia. Firstly, the findings support the observation made previously by Martin et al. 12 that survival significantly worsens with increasing weight loss grade and are consistent with several other publications showing that patients with involuntary weight loss have a poor prognosis.4, 18, 19 Looking at weight loss grades 1 and 2 individually, survival did worsen compared with that at weight loss grade 0. However, the difference did not reach statistical significance, although weight loss grade 2 showed a tendency towards significance. Failure to reach significance may be due to the smaller sample in the present study compared with the study by Martin et al. 12
Secondly, the WLGS not only predicts survival but the present findings suggest that it may also be useful in cachexia classification as it has concurrent validity in relation to established cachexia domains. Of these, dietary intake and appetite loss were the factors most strongly related to increasing grade, which is not surprising given that these factors are central in the pathophysiology of cancer cachexia.20 From grades 0 to 4, dietary intake changed from a mean value of 0.4, representing a near normal intake of nutrients (normal intake is score 0), to 1.4, which represents a reduced intake of normal food (or feeding by nasogastric tube or vein) (score 1) or intake of little solid food (score 2).14 KPS changed from a mean value close to 70 to close to 60, the difference being the ability to fully care for oneself vs. requiring occasional assistance.17 Appetite loss and fatigue changed by a score of 20, which is considered to be a definite clinical significant change. Physical functioning changed by a score of 18, which is considered to be a moderate change, and emotional functioning changed by a score of 6, which is considered to be a small change.16
Performance status, appetite loss, and physical and emotional functioning improve prognostication of survival independently of the WLGS. This suggests that they can be used in combination with the WLGS to further improve the prognostic ability of the system. Future research should examine their full potential to classify cancer cachexia.
The third and, arguably, the finding with the greatest potential clinical relevance was that weight loss grade was predictive of the likelihood of cachexia progression. The risk of progression was considerably higher in weight loss grade 2 compared with that in weight loss grade 0 or 1. This suggests that more patients have started on the cachexia trajectory in weight loss grade 2 than in weight loss grade 0 or 1. Notably, the percentage of patients receiving chemotherapy was similar in patients with weight loss grades 0–2 (47%, 55%, and 50%, respectively), so less anti‐cancer treatment does not seem to explain the increased risk of cachexia progression in weight loss grade 2. Regarding the two most severe grades of the WLGS (grades 3 and 4), the probability of improvement decreased, reflecting that irreversibility increases as cachexia becomes more advanced. This is consistent with the findings of Prado et al. who found that weight gain is unlikely to occur in the last 90 days of advanced cancer patients' lives.21 Overall, the risk of progression to more severe grades superseded the rate of improvement at any grade (with the obvious exception of grade 4), confirming the progressive nature of cachexia.
So how might these findings influence practice? One such way is the early identification of patients where cachexia interventions should be implemented. As less than a quarter of patients with grades 0 and 1 have cachexia progression, it would seem sensible to start cachexia intervention for patients with grade 2 where the likelihood of progression is greater. That way, one might avoid over‐treating many patients. This strategy is supported by the finding that patients with grade 2 have a higher symptom load (appetite loss and fatigue), lower dietary intake, and poorer function than patients with lower weight loss grade. Thus, grade 2 seems to fit the description of pre‐cachexia in the consensus definition.11 At the other end of the scale, patients with grade 4 had a median survival of a little over 3 months and a mean KPS close to 60. This is in accordance with the description of refractory cachexia in the consensus definition, and aggressive treatment attempts against cachexia, as well as chemotherapy, should be avoided in this group of patients.11 Instead, the attention should be given to palliation and immediate symptom relief.
The main limitation of this study was the expected, but considerable, attrition that may have affected the longitudinal analyses. Presumably, the high dropout rate was caused by patients deteriorating and becoming too weak to continue participation. This was addressed by performing imputations of missing values aiming to reduce the risk of bias. Another limitation was the lack of information on important cachexia domains such as systemic inflammation and objective measures of muscle and fat mass. Systemic inflammation is interesting because it is considered a driver of cancer cachexia,6 and markers of inflammation could potentially be important in diagnosing cachexia. Measures of muscle and fat mass could have explained whether observed weight gain was due to improvement of cachexia or due to accumulation of fluids or shifts in body composition. Nevertheless, concurrent validity could be evaluated with regard to important cachexia domains such as appetite, food intake, and physical function. Furthermore, because cachexia development is likely to be affected by the response to chemotherapy, nutrition, and other treatments of cachexia, one cannot claim that this study describes the natural development of cachexia in an untreated population. Nevertheless, it describes the development of cachexia in a population without systematic intervention against cachexia. The strengths of this study are the longitudinal design and the large number of patients included from several countries, both rare in palliative research.
Conclusion
Our findings support that the WLGS predicts survival and is in keeping with the cancer cachexia phenotype. Furthermore, the addition of key cachexia domains improves prognostic accuracy of the WLGS. Prospective clinical trials should examine the WLGS's ability to stratify cachexia treatments. This could have significant implications for clinical practice and challenge the widely accepted paradigm that cancer cachexia is an inevitable consequence of advanced disease.
Project management
Marianne J. Hjermstad, PRC/NTNU; Stein Kaasa, PRC/NTNU/EAPC‐RN; Dagny F. Haugen, PRC/NTNU; Pål Klepstad, PRC/NTNU; Gunnhild Jakobsen, PRC/NTNU, Norway; Augusto Caraceni, PRC/EAPC‐RN; Cinzia Brunelli, PRC/Italy; Per Sjøgren, EAPC‐RN, Denmark; Florian Strasser, Switzerland; Barry Laird, PRC/UK.
Project steering committee
Marianne J. Hjermstad, PRC/NTNU; Stein Kaasa, PRC/NTNU/EAPC‐RN, Norway; Augusto Caraceni, PRC/EAPC‐RN; Cinzia Brunelli, PRC/Italy; Per Sjøgren, EAPC‐RN, Denmark; Luc Deliens EAPC‐RN, Belgium; Mike Bennett, EAPC‐RN, UK; David Currow, Australia; Vickie Baracos, Canada.
Core centre collaborators, one from each site
Erik Løhre, St Olavs Hospital‐Trondheim University Hospital; Nina Aass, Oslo University Hospital; Elisabeth Brenne, Øya Helsehus; Inge Raknes, Haraldsplass Deaconess Hospital, Norway; Geana Kurita, Rigshospitalet; Mogens Groenvold, Bispebjerg Hospital, Denmark; Florian Strasser, Cantonal Hospital St Gallen; Cristian Camartin, Kantonspital, Graubünden, Switzerland; Alessandra Pigni, Fondazione IRCCS Istituto Nazionale dei Tumori; Luigi Cavanna, Oncologia Medica Ospedale Di Piacenza; Adriana Turriziani, Hospice Villa Speranza Roma; Franco Rizzi, UO Complessa di Cure Palliative e Terapia del Dolore, AO ICP Milan; Laura Piva, Unità di Cure Palliative Azienda Ospedaliera San Paolo, Milan; Giampiero Porzio, Oncologia Medica Università degli Studi, L'Aquila; Rondini Ermanno, UO Oncologia Medica Arcispedale S. Maria Nuova IRCCS, Reggio Emilia, Italy; Mike Bennett, Leeds Institute of Health Sciences/University of Leeds; Barry Laird, Western General Hospital Edinburgh/Beatson West of Scotland Cancer Centre, Edinburgh; Andrew Wilcock, Nottingham University Hospitals NHS Trust, Nottingham; Karen Harvie, Marie Curie Hospice, Glasgow, UK; Maria Nabal, Hospital Universitário Arnau de Vilanova Lleida; Antonio N. Tejedor, Hospital Centro de Cuidados Laguna, Madrid; Josep Porta Sales, Institut Català d'Oncologia, Barcelona; Marina Martínez, Clinica Universidad De Navarra Pamplona, Spain; Konrad Fassbender, University of Alberta, Canada; David Currow, Flinders University, Australia; Nikolay Yordanov, Comprehensive Cancer Center Vratsa, Bulgaria; Koen Pardon, Ghent University Hospital Flanders, Belgium; Ioseb Abesadze, Cancer Prevention Center, Tblisi, Georgia; Madalena Feio, Instituto Português de Oncologia Francisco Gentil Lisbon, Portugal.
Conflicts of interest
F.S. has had punctual advisorships for Acacia, ACRAF, Amgen, Baxter, Celgene, Danone, Fresenius, GlaxoSmithKline, Grünenthal, Helsinn, ISIS Global, Millennium/Takeda, Mundipharma, Novartis, Novelpharm, Nycomed, Obexia, Otsuka, Ono, Pharm‐Olam, Pfizer, Psioxus, PrIME, Santhera, Sunstone, Teva, and Vifor. He has received unrestricted industry grants for clinical research from Celgene, Fresenius, and Helsinn. He has participated in a clinical cachexia trial lead by Novartis.
O.M.V., D.B., A.W., P.F., V.E.B., M.J.H., S.K., B.L., and T.S.S. declare that they have no conflicts of interest.
Acknowledgements
The European Palliative Care Cancer Symptom study is a collaborative effort between the European Palliative Care Research Centre (PRC) and the European Association for Palliative Care Research Network (EAPC‐RN). The study was approved by all appropriate ethical committees and was conducted in keeping with the Helsinki declaration. The authors certify that they comply with the ethical guidelines for authorship and publishing of the Journal of Cachexia, Sarcopenia, and Muscle.22
This study was funded by the Joint Research Council at Norwegian University of Science and Technology (NTNU) and St. Olavs Hospital‐Trondheim University Hospital (6070); Norwegian Cancer Society; Helsinn.
Vagnildhaug, O. M. , Blum, D. , Wilcock, A. , Fayers, P. , Strasser, F. , Baracos, V. E. , Hjermstad, M. J. , Kaasa, S. , Laird, B. , Solheim, T. S. , and for the European Palliative Care Cancer Symptom study group (2017) The applicability of a weight loss grading system in cancer cachexia: a longitudinal analysis. Journal of Cachexia, Sarcopenia and Muscle, 8: 789–797. doi: 10.1002/jcsm.12220.
Trial registration number ClinicalTrials.gov identifier: NCT01362816.
References
- 1. Katz AM, Katz PB. Diseases of the heart in the works of Hippocrates. Br Heart J 1962;24:257–264. [DOI] [PMC free article] [PubMed] [Google Scholar]
- 2. Hinsley R, Hughes R. ‘The reflections you get’: an exploration of body image and cachexia. Int J Palliat Nurs 2007;13:84–89. [DOI] [PubMed] [Google Scholar]
- 3. McClement S. Cancer anorexia‐cachexia syndrome: psychological effect on the patient and family. J Wound Ostomy Continence Nurs 2005;32:264–268. [DOI] [PubMed] [Google Scholar]
- 4. Dewys WD, Begg C, Lavin PT, Band PR, Bennett JM, Bertino JR, et al. Prognostic effect of weight loss prior to chemotherapy in cancer patients. Eastern Cooperative Oncology Group. Am J Med 1980;69:491–497. [DOI] [PubMed] [Google Scholar]
- 5. Ross PJ, Ashley S, Norton A, Priest K, Waters JS, Eisen T, et al. Do patients with weight loss have a worse outcome when undergoing chemotherapy for lung cancers? Br J Cancer 2004;90:1905–1911. [DOI] [PMC free article] [PubMed] [Google Scholar]
- 6. Fearon KC. Cancer cachexia: developing multimodal therapy for a multidimensional problem. Eur J Cancer 2008;44:1124–1132. [DOI] [PubMed] [Google Scholar]
- 7. Tisdale MJ. Cachexia in cancer patients. Nat Rev Cancer 2002;2:862–871. [DOI] [PubMed] [Google Scholar]
- 8. Millar C, Reid J, Porter S. Healthcare professionals' response to cachexia in advanced cancer: a qualitative study. Oncol Nurs Forum 2013;40:E393–E402. [DOI] [PubMed] [Google Scholar]
- 9. Blum D, Omlin A, Fearon K, Baracos V, Radbruch L, Kaasa S, et al. Evolving classification systems for cancer cachexia: ready for clinical practice? Support Care Cancer 2010;18:273–279. [DOI] [PubMed] [Google Scholar]
- 10. Blum D, Omlin A, Baracos VE, Solheim TS, Tan BH, Stone P, et al. Cancer cachexia: a systematic literature review of items and domains associated with involuntary weight loss in cancer. Crit Rev Oncol Hematol 2011;80:114–144. [DOI] [PubMed] [Google Scholar]
- 11. Fearon K, Strasser F, Anker SD, Bosaeus I, Bruera E, Fainsinger RL, et al. Definition and classification of cancer cachexia: an international consensus. Lancet Oncol 2011;12:489–495. [DOI] [PubMed] [Google Scholar]
- 12. Martin L, Senesse P, Gioulbasanis I, Antoun S, Bozzetti F, Deans C, et al. Diagnostic criteria for the classification of cancer‐associated weight loss. J Clin Oncol 2015;33:90–99. [DOI] [PubMed] [Google Scholar]
- 13. Hjermstad MJ, Aass N, Aielli F, Bennett M, Brunelli C, Caraceni A, et al. Characteristics of the case mix, organisation and delivery in cancer palliative care: a challenge for good‐quality research. BMJ Support Palliat Care 2016; https://doi.org/10.1136/bmjspcare‐2015‐000997. [DOI] [PubMed] [Google Scholar]
- 14. Bauer J, Capra S, Ferguson M. Use of the scored Patient‐Generated Subjective Global Assessment (PG‐SGA) as a nutrition assessment tool in patients with cancer. Eur J Clin Nutr 2002;56:779–785. [DOI] [PubMed] [Google Scholar]
- 15. Groenvold M, Petersen MA, Aaronson NK, Arraras JI, Blazeby JM, Bottomley A, et al. The development of the EORTC QLQ‐C15‐PAL: a shortened questionnaire for cancer patients in palliative care. Eur J Cancer 2006;42:55–64. [DOI] [PubMed] [Google Scholar]
- 16. Osoba D, Rodrigues G, Myles J, Zee B, Pater J. Interpreting the significance of changes in health‐related quality‐of‐life scores. J Clin Oncol 1998;16:139–144. [DOI] [PubMed] [Google Scholar]
- 17. Schag CC, Heinrich RL, Ganz PA. Karnofsky performance status revisited: reliability, validity, and guidelines. J Clin Oncol 1984;2:187–193. [DOI] [PubMed] [Google Scholar]
- 18. Haugstvedt TK, Viste A, Eide GE, Soreide O. Factors related to and consequences of weight loss in patients with stomach cancer. The Norwegian Multicenter experience. Norwegian Stomach Cancer Trial. Cancer 1991;67:722–729. [DOI] [PubMed] [Google Scholar]
- 19. Sanders KJ, Hendriks LE, Troost EG, Bootsma GP, Houben RM, Schols AM, et al. Early weight loss during chemoradiotherapy has a detrimental impact on outcome in NSCLC. J Thorac Oncol 2016;11:873–879. [DOI] [PubMed] [Google Scholar]
- 20. Solheim TS, Blum D, Fayers PM, Hjermstad MJ, Stene GB, Strasser F, et al. Weight loss, appetite loss and food intake in cancer patients with cancer cachexia: three peas in a pod?—analysis from a multicenter cross sectional study. Acta Oncol 2014;53:539–546. [DOI] [PubMed] [Google Scholar]
- 21. Prado CM, Sawyer MB, Ghosh S, Lieffers JR, Esfandiari N, Antoun S, et al. Central tenet of cancer cachexia therapy: do patients with advanced cancer have exploitable anabolic potential? Am J Clin Nutr 2013;98:1012–1019. [DOI] [PubMed] [Google Scholar]
- 22. von Haehling S, Morley JE, Coats AJS, Anker SD. Ethical guidelines for publishing in the Journal of Cachexia, Sarcopenia and Muscle: update 2015. J Cachexia Sarcopenia Muscle 2015;6:315–316. [DOI] [PMC free article] [PubMed] [Google Scholar]