

Abstract
Background
Ultrasound is a non‐invasive and readily available tool that can be prospectively applied at the bedside to assess muscle mass in clinical settings. The four‐site protocol, which images two anatomical sites on each quadriceps, may be a viable bedside method, but its ability to predict musculature has not been compared against whole‐body reference methods. Our primary objectives were to (i) compare the four‐site protocol's ability to predict appendicular lean tissue mass from dual‐energy X‐ray absorptiometry; (ii) optimize the predictability of the four‐site protocol with additional anatomical muscle thicknesses and easily obtained covariates; and (iii) assess the ability of the optimized protocol to identify individuals with low lean tissue mass.
Methods
This observational cross‐sectional study recruited 96 university and community dwelling adults. Participants underwent ultrasound scans for assessment of muscle thickness and whole‐body dual‐energy X‐ray absorptiometry scans for assessment of appendicular lean tissue. Ultrasound protocols included (i) the nine‐site protocol, which images nine anterior and posterior muscle groups in supine and prone positions, and (ii) the four‐site protocol, which images two anterior sites on each quadriceps muscle group in a supine position.
Results
The four‐site protocol was strongly associated (R 2 = 0.72) with appendicular lean tissue mass, but Bland–Altman analysis displayed wide limits of agreement (−5.67, 5.67 kg). Incorporating the anterior upper arm muscle thickness, and covariates age and sex, alongside the four‐site protocol, improved the association (R 2 = 0.91) with appendicular lean tissue and displayed narrower limits of agreement (−3.18, 3.18 kg). The optimized protocol demonstrated a strong ability to identify low lean tissue mass (area under the curve = 0.89).
Conclusions
The four‐site protocol can be improved with the addition of the anterior upper arm muscle thickness, sex, and age when predicting appendicular lean tissue mass. This optimized protocol can accurately identify low lean tissue mass, while still being easily applied at the bedside.
Keywords: Muscle mass, Ultrasound, Muscle thickness, Sarcopenia, Appendicular lean tissue mass, Body composition
Introduction
Quantifying lean tissue or muscle mass in ageing and clinical populations is of increasing importance due to emerging associations between low muscle mass and poor physical function, as well as increased rates of morbidity and mortality.1, 2, 3, 4, 5 Lean tissue or muscle mass can be assessed by using several accurate and precise modalities such as dual‐energy X‐ray absorptiometry (DXA), computed tomography (CT), and magnetic resonance imaging (MRI).6 DXA is often used in research settings because it provides a cost‐effective and accurate assessment of lean tissue, with minimal exposure to radiation. These advantages have led to DXA being commonly utilized for the assessment of low lean tissue mass in ageing populations7; however, it is rarely applied for lean tissue assessment purposes in clinical centres due to the limited accessibility of these scanners for body composition analysis in these settings. In certain clinical populations, CT and MRI scans, which have been performed as part of routine care, can be utilized for muscle mass assessments.8 However, these scans are not routinely performed for all patients, and analysis requires specialized software and is often limited to retrospective analysis.9 Development of a tool that can be easily and prospectively applied at the bedside would enable researchers and clinicians to determine the effectiveness of targeted nutritional or rehabilitative therapies on the maintenance of muscle tissue health throughout a patient's disease trajectory or stay within a hospital.
Emerging literature highlights that musculoskeletal ultrasonography may be useful for assessment of muscle or lean tissue mass.10, 11 Ultrasound is a non‐invasive, readily available, and cost‐effective option that can be applied at the bedside to assess the thickness or cross‐sectional area (CSA) of specific muscle groups at predefined landmarks. Comprehensive protocols, such as the nine‐site protocol—which images anterior and posterior muscle groups in a standing posture,12 have been shown to strongly associate (R 2 = 0.94) with whole‐body lean tissue or muscle mass.10, 13 However, few bedside viable ultrasound protocols, such as the four‐site protocol—which images the anterior muscle thickness of both quadriceps,14 have been assessed for accuracy in predicting muscle or lean tissue mass.
Here, we assessed the agreement between the four‐site protocol and DXA‐measured appendicular lean tissue mass. We next sought to optimize the accuracy of the four‐site protocol with additional bedside accessible muscle thicknesses and easily obtained covariates and assessed the ability of the optimized protocol to identify individuals with low lean tissue mass. As secondary objectives, we assessed the reliability of the four‐site protocol and whether minimal or maximal compression of the ultrasound probe against the skin is ideal for lean tissue estimates.
Participants and methods
Study design and participants
This observational study recruited 96 participants between August 2015 and May 2016 to attend a single data collection session at the University of Waterloo (Supporting Information, Figure S1). Participants underwent anthropometric measures, a whole‐body DXA scan and ultrasound assessments, in a supine or prone position, using the previously established nine‐site 12 and four‐site 14 protocols. A subset (n = 16) of participants had inter‐rater reliability performed by using the four‐site protocol for a single leg (alternating between dominant and non‐dominant legs). This study was reviewed and cleared by a University of Waterloo Clinical Research Ethics Committee. Written informed consent was obtained from all participants in accordance with established protocols for human research.
Participants (≥18 years of age) were recruited from the University of Waterloo student population, the Kitchener‐Waterloo community, and the Waterloo Research Aging Participant Pool by the way of posters, email, and telephone; recruitment from these diverse participant groups was performed to increase the heterogeneity of the study cohort. Participants were screened by using a health questionnaire and excluded if they (i) had a previous history of neuromuscular disorders; (ii) were currently or suspect they may be pregnant; (iii) had undergone a barium swallow or nuclear medicine scan within the past 3 weeks; (iv) had a stroke within the past 5 years; or (v) had a prosthetic joint replacement. Participants were instructed to refrain from alcohol consumption for 24 h and moderate to vigorous physical activity for 48 h prior to their scheduled data collection session.
Dual‐energy X‐ray absorptiometry imaging procedures
Participant's height and weight were obtained, in either lightweight clothing (shorts and t‐shirt) or a cloth hospital gown, by using a balance beam scale and stadiometer. Prior to DXA scans, Certified Medical Radiation Therapists performed quality control and phantom calibration procedures by using whole‐body and spine phantoms. Participants were positioned supine on the DXA scanning table, shoulders depressed, and forearms positioned parallel to the bed, just inside the scanning limits of the table. Participant's legs were extended, with their toes internally rotated and held in position by using a masking tape, which prevented movement during scanning. The Certified Medical Radiation Therapists conducted one to two whole‐body DXA scans (Hologic Discovery QDR 4500, Hologic, Toronto, ON) on each participant. The second scan was required if the participant (n = 2) did not fit within the lateral limits of the scanning table; these scans were analysed by summing left and right segments of the body bisected along the mid‐line of the spine, as previously described.15 Using Hologic software (version 13.2), the whole‐body scan was segmented into the head, trunk, left, and right upper limbs and left and right lower limbs by a single investigator according to a standardized protocol.16 The lean tissue mass in the upper and lower limbs, known as appendicular lean tissue mass, was summed and used for all regression analysis as this lean tissue depot is predominately skeletal muscle mass and has strong associations with whole‐body muscle mass measured by using MRI.17 Individuals were identified as having lower than normal lean tissue mass by dividing their appendicular lean tissue mass by their height squared (kg/m2) and by using previously published cut‐points of ≤7.26 kg/m2 for men and ≤5.45 kg/m2 for women.18
Regional analyses were performed for direct comparison of the four‐site protocol muscle thicknesses to the corresponding site on the DXA scan for lean tissue measures. Specifically, lean tissue at the mid‐point and distal third between the anterior superior iliac spine and upper patella was measured by using the DXA software. The pixels in the y‐axis pertaining to the anterior superior iliac spine and the upper patella were determined visually by a single investigator and used to calculate the relative distances and pixels associated with the mid‐point and distal third sites. Regions of interest, two pixels in height and wide enough to encompass the skin on both sides of the upper thigh, were placed to quantify the lean soft tissue. Lean tissue was averaged across all four sites and compared with average muscle thickness from the four‐site protocol by using both minimal and maximal compression.
Ultrasound imaging procedures
General procedures
A real‐time B‐mode ultrasound imaging device (M‐Turbo, SonoSite, Markham, ON) equipped with a multi‐frequency linear array transducer (L38xi: 5–10 MHz) was used to obtain transverse images of muscle groups at predefined sites. The musculoskeletal and resolution settings were chosen, and adjustable parameters: gain, time gain compensation, and compression (dynamic range of 0) were held constant throughout the imaging process, whereas depth was adjusted as required in order to obtain a complete image of the muscle thickness. Muscle thickness measures were obtained from frozen images by using onscreen calipers, measuring the distance between the upper margin of the underlying bone and the lower boundary of the ventral fascia of the muscle group of interest ( Figure S2).19 Muscle thickness measures that do not use a bony surface (abdomen and anterior lower leg), the upper and lower boundaries of the muscle fascia was used for analysis. All measurements were made with the participant in the prone or supine position, with the arms resting at the participant's side with a neutral wrist rotation and their ankles wrapped with an adjustable strap to ensure neutral rotation of the lower limbs. All bony landmarks were identified by palpation, and specific sites to be imaged were measured with the use of a flexible tape measure and marked by using easily removable ink. During image analysis and caliper placement, all raters were blinded to thickness measures by the use of a removable sticker on the ultrasound screen to ensure that subsequent thickness measures were not influenced by prior image analysis.
Four‐site protocol
The four‐site protocol imaged the anterior surface of the left and right rectus femoris and vastus intermedialis muscles at (i) the mid‐point between the anterior superior iliac spine and the upper pole of the patella and (ii) two‐thirds distal from the anterior superior iliac spine to the upper pole of the patella.20 Each landmark was imaged twice, using minimal and maximal compression. Here, minimal compression was achieved by coating the transducer with ample water‐soluble transmission gel and positioned to obtain an image containing the highest density of cortical bone of the femur (neutral probe tilt). A thick layer of ultrasound gel was maintained between the probe‐skin interface to ensure that there is no tissue depression, and the operator ensured that the muscle belly and skin maintained its convex shape prior to freezing the image ( Figure S2). Maximal compression was considered to be maximal attainable compression of the underlying tissue with the transducer ( Figure S2). Image acquisition using minimal compression was applied first, in order to reduce potential variability that may be associated with compression altering muscle thickness measures.
Nine‐site protocol
The nine‐site protocol was performed on the right side of the body, and each landmark was imaged a single time, as previously described.13 The upper arm muscle thickness measures were taken on the anterior and posterior surfaces, 60% distal from the acromial process of the scapula to the lateral epicondyle of the humerus. Forearm muscle thickness was taken from the anterior surface 30% distal from the radial head to the styloid process of the radius. Abdominal measures of muscle thickness were taken 3 cm from the right of the umbilicus. Subscapular muscle thickness measures were taken 5 cm directly below the inferior angle of the scapula. Measures of thigh muscle thickness were taken on the anterior and posterior surfaces midway between the lateral condyle of the femur and the greater trochanter. Lastly, the lower leg muscle thickness measures were taken on the anterior and posterior surface, 30% distal from the head of the fibula to the lateral malleolus. Only minimal compression as described above was used for the nine‐site protocol.
Reliability of the four‐site protocol
Inter‐rater reliability was performed for the four‐site protocol by a second rater, experienced with the application of musculoskeletal ultrasound, but who had minimal training applying the four‐site protocol. Reliability was assessed on a single leg for each participant and alternated between dominant and non‐dominant legs, in a sequential order. Inter‐rater reliability assessment occurred according to the following steps: (i) landmarking with ink by rater one; (ii) acquisition of image and placement of calipers for muscle thickness measures for both minimal and maximal compression protocols, with removal and repositioning of the probe between images, by rater one; (iii) removal of ink landmarks by using 70% ethanol wipes by Rater 1; and (iv) Rater 2 performs steps 1–3, blinded to all measures from Rater 1. Therefore, the second rater was conducting the entire four‐site protocol, inclusive of re‐landmarking, on a single leg, alternating between dominant and non‐dominant legs for each participant (approximately 10 min after the initial assessment). Inter‐rater reliability was performed on the last 16 participants (31% female), with a median [interquartile range (IQR)] age, body mass index (BMI), and body fat of 70.5 (67.3–78) years, 26.4 (22.9–29.9) kg/m2, and 31.3 (26.3–36.7)%, respectively. Intra‐rater reliability was assessed for the primary rater by comparing the first measure to the second measure for all four‐site landmarks; therefore, re‐landmarking did not occur.
Echogenicity of the rectus femoris
Ultrasound images of the right and left mid‐points (each landmark imaged twice) of the rectus femoris [acquired at 4.7 cm imaging depth, with the previously described settings (gain, time gain compensation, dynamic range, resolution, and musculoskeletal settings) held constant between participants] were analysed for echogenicity, a measure of muscle quality that is associated with increased fat and fibrotic infiltration.21 Increased echogenicity is indicative of a poorer‐quality muscle. Echogenicity was quantified by computer image gray‐scale analysis by using a 2 × 2 cm square region of interest, as previously described.22 If a 2 × 2 cm square region of interest was larger than the available view of the rectus femoris (due to excessive adiposity, n = 7, or small muscle CSA, n = 61), the largest possible square was applied. Mean echogenicity for the region of interest, expressed as an arbitrary value between 0 (white) and 255 (black), was calculated by using the histogram function of ImageJ software (NIH, Bethesda, MD, version 1.6.0_24). Echogenicity measures were used to further characterize individuals categorized based on lean tissue mass by using ultrasound.
Statistical analysis
Normality was assessed for continuous variables by using the Shapiro–Wilks test. Normality was violated for numerous variables, and therefore, descriptive statistics are reported as median and IQR (Q1–Q3). Differences between men and women or younger and older adults were analysed by using the Mann–Whitney U‐test. Differences in proportion of low lean tissue were assessed by using a χ2 test. A Fisher z transformation was utilized to assess if there was a significant difference between regression coefficients comparing minimal or maximal compression to site‐specific measures of lean tissue mass. A three‐fold cross validation, stratified by appendicular lean tissue index (kg/m2), was used for all linear and logistic regression analyses to improve the generalizability of these models. A three‐fold cross validation divides the participant cohort into three equally distributed folds, where model training occurs with two of the three folds, with subsequent validation in the left out fold; this is performed three times, utilizing all permutations.23 Model parameters were averaged across all cross‐validation folds for an average assessment of linear and logistic model performance. Muscle thicknesses for the four‐site protocol were averaged across all anatomical sites [(right mid‐point + right distal third + left mid‐point + left distal third)/4] and multiplied by limb length. Muscle thicknesses for the nine‐site protocol were summed and multiplied by height.
Utilizing all 96 participants, backwards stepwise regression analysis to predict appendicular lean tissue mass was performed by using the four‐site muscle thicknesses; a‐priori defined accessible muscle thicknesses of the anterior upper arm, anterior forearm, and anterior lower leg from the nine‐site protocol (multiplied by their respective limb lengths); and easily obtained covariate age, sex, and BMI to determine the variables which will be incorporated into the optimized protocol. Multiple linear regression, using variables identified in the backwards stepwise regression, was performed to predict appendicular lean derived from DXA. Bland–Altman analysis was performed by using ultrasound predicted appendicular lean tissue mass from all three cross‐validation folds24; limits of agreement (95% confidence interval for differences) and tolerance limits (upper and lower 95% confidence intervals for the limits of agreement) were used for interpretation. To ensure the validity of the limits of agreement, a regression analysis was performed for the differences against averages to assess for proportional bias and homoscedasticity of the differences was assessed visually by examining a plot of the residuals of the regression analysis against averages.25
For identification of low lean tissue mass, a multiple logistic regression analysis was performed, using variables identified in the backwards stepwise regression analysis. Log odds output from the logistic regression from each cross‐validation fold was used for a receiver operating characteristic analysis, which was averaged and used for cut‐point identification. The first cut‐point, which categorizes individuals as low risk for the presence of low lean tissue mass, was identified by selecting a cut‐point with a high‐sensitivity and negative likelihood ratio of approximately 0.1; the second cut‐point, which categorizes individuals as high risk for the presence of low lean tissue mass, was identified by selecting a cut‐point with a high‐specificity and positive likelihood ratio of approximately 10.26 Differences between risk categorizations for low lean tissue mass were analysed by using a one‐way ANOVA on ranks (Kruskal–Wallis) and Dunn's post‐hoc test. Intra‐rater reliability and inter‐rater reliability were assessed by using coefficient of variation (CV), intra‐class correlation coefficient (ICC), and Bland–Altman plots.24 ICC equation (1,1) was used for intra‐rater reliability, and ICC (3,1) was used for inter‐rater reliability as previously suggested.27 Regression coefficients were interpreted as weak (0.30–0.50), moderate (0.50–0.70), and strong (0.70–1.00).28 All analysis was performed by using Sigma Plot (Systat Software, San Jose, CA, version 13), and the level of significance was set at P ≤ 0.05.
Results
Demographic and physical characteristics
Ninety‐six participants were recruited (86% Caucasian), with a median (IQR) age of 36.5 (24.0–72.0) years, BMI of 24.3 (22.3–27.3) kg/m2, and body fat of 30.2 (24.3–36.8)% (Table 1). Of the 96 participants, 57% were female, and compared with men, women had a significantly greater BMI (P = 0.021) and body fat (P < 0.001), but not age (P = 0.279). Younger adults had significantly lower BMI (P < 0.001) and body fat (P < 0.001) compared with older adults (Table 1).
Table 1.
Physical and demographic descriptions of participant cohort
| Variable median (IQR) | All (n = 96) | Men (n = 41) | Women (n = 55) | P‐value | Younger (<60, n = 55) | Older (≥60, n = 41) | P‐value |
|---|---|---|---|---|---|---|---|
| Age, years | 36.5 (24.0–72.0) | 39.0 (25.0–73.0) | 35.0 (23.0–69.0) | 0.279 | 24.0 (23.0–30.0) | 73.0 (69.0–78.0) | <0.001 |
| Sex, % female | 57% | — | — | — | 60% | 54% | — |
| Height, m | 1.69 (1.62–1.77) | 1.77 (1.71–1.81) | 1.64 (1.58–1.69) | <0.001 | 1.70 (1.64–1.76) | 1.66 (1.59–1.78) | 0.173 |
| Weight, kg | 70.5 (62.8–82.3) | 82.0 (71.9–88.1) | 65.2 (58.5–70.9) | <0.001 | 68.0 (60.3–76.8) | 75.8 (64.7–84.2) | 0.063 |
| BMI, kg/m2 | 24.3 (22.3–27.3) | 25.7 (23.9–27.5) | 23.7 (21.8–26.5) | 0.021 | 23.7 (21.6–25.7) | 26.6 (23.7–29.2) | <0.001 |
| Underweight ≤18.5 kg/m2 | 0 | 0 | 0 | — | 0 | 0 | — |
| Normal 18.6–24.9 kg/m2 | 52 | 16 | 36 | — | 38 | 14 | — |
| Overweight 25.0–29.9 kg/m2 | 30 | 19 | 11 | — | 12 | 18 | — |
| Obese ≥30.0 kg/m2 | 14 | 6 | 8 | — | 5 | 9 | — |
| Body fat, % | 30.2 (24.3–36.8) | 25.0 (20.4–29.8) | 34.9 (29.3–41.0) | <0.001 | 27.3 (21.7–33.8) | 35.1 (29.0–41.5) | <0.001 |
| Ethnicity | — | — | — | — | — | — | — |
| Caucasian, n | 83 | 35 | 48 | — | 42 | 41 | — |
| Asian, n | 12 | 5 | 7 | — | 12 | 0 | — |
| Other, n | 1 | 1 | 0 | — | 1 | 0 | — |
IQR, interquartile range.
Median appendicular lean tissue was significantly lower for women compared with men (P < 0.001) and for older adults compared with younger adults (P = 0.041) (Table 2). In total, 17 of 96 (18%) participants were identified as having lower than normal lean tissue according to DXA (men ≤ 7.26 kg/m2; women ≤ 5.45 kg/m2), despite no participants being classified as underweight based on BMI. No differences were seen in the proportion of low muscle mass between men and women (P = 0.341) or between younger and older adults (P = 0.08) (Table 2).
Table 2.
Descriptive summary of DXA measures of lean tissue
| Variable median (IQR) | All (n = 96) | Men (n = 41) | Women (n = 55) | P‐value | Younger (<60, n = 55) | Older (≥60, n = 41) | P‐value |
|---|---|---|---|---|---|---|---|
| Whole‐body lean tissue, kg | 44.7 (37.6–54.7) | 55.4 (51.3–59.5) | 37.9 (35.9–42.2) | <0.001 | 44.8 (37.9–55.5) | 42.6 (36.1–53.3) | 0.310 |
| Appendicular lean tissue, kg | 19.2 (15.6–24.2) | 24.7 (21.7–27.2) | 15.8 (14.7–17.8) | <0.001 | 19.8 (16.3–25.3) | 17.5 (14.7–23.4) | 0.041 |
| Appendicular lean tissue index, kg/m2 | 6.92 (5.82–7.73) | 7.75 (7.38–8.56) | 6.03 (5.50–6.72) | <0.001 | 7.26 (6.03–8.07) | 6.60 (5.52–7.43) | 0.033 |
| Proportion low lean tissue, n/N | 17/96 (18%) | 5/41 (12%) | 12/55 (22%) | 0.341 | 6/55 (11%) | 11/41 (27%) | 0.08 |
| Site specific lean tissue, kg | 0.40 (0.34–0.47) | 0.45 (0.41–0.54) | 0.36 (0.31–0.40) | <0.001 | 0.45 (0.37–0.51) | 0.38 (0.31–0.41) | <0.001 |
Appendicular lean tissue index = (sum of lean soft tissues in the upper and lower limbs (kg))/(height2 (m)). DXA, dual‐energy X‐ray absorptiometry; IQR, interquartile range.
Muscle thicknesses were significantly greater for men compared with women for both the nine‐site (P < 0.05) (Table 3) and four‐site ultrasound protocols (P < 0.001) (Table 4). Compared with older adults, younger adults had significantly greater muscle thicknesses using the four‐site protocol (P < 0.001) (Table 4), but using the nine‐site protocol, greater thicknesses were only observed for the posterior upper arm, abdominal, anterior forearm, anterior upper leg, posterior upper leg, and combined total (P < 0.05), but not for the subscapular, anterior upper arm, anterior lower leg, and posterior lower leg (P > 0.05) (Table 3).
Table 3.
Descriptive summary of ultrasound‐measured muscle thickness using the nine‐site protocol
| Variable median (IQR) | All (n = 96) | Men (n = 41) | Women (n = 55) | P‐value | Younger (<60, n = 55) | Older (≥60, n = 41) | P‐value |
|---|---|---|---|---|---|---|---|
| Anterior upper arm, cm | 2.76 (2.31–3.50) | 3.55 (3.20–3.86) | 2.37 (2.20–2.70) | <0.001 | 2.99 (2.34–3.45) | 2.67 (2.29–3.53) | 0.364 |
| Posterior upper arm, cm | 2.32 (1.75–3.03) | 3.06 (2.56–3.61) | 1.93 (1.56–2.31) | <0.001 | 2.51 (1.98–3.38) | 1.95 (1.50–2.57) | <0.001 |
| Anterior forearm, cm | 1.58 (1.29–1.84) | 1.80 (1.55–2.06) | 1.36 (1.16–1.61) | <0.001 | 1.69 (1.31–1.94) | 1.47 (1.27–1.70) | 0.046 |
| Abdominal, cm | 1.02 (0.82–1.34) | 1.16 (0.84–1.59) | 0.99 (0.77–1.19) | 0.039 | 1.23 (1.01–1.49) | 0.80 (0.65–0.95) | <0.001 |
| Subscapular, cm | 0.81 (0.63–1.02) | 0.96 (0.76–1.24) | 0.70 (0.55–0.92) | <0.001 | 0.83 (0.64–1.01) | 0.75 (0.61–1.05) | 0.612 |
| Anterior upper leg, cm | 3.34 (2.57–3.89) | 3.77 (3.12–4.39) | 2.96 (2.46–3.52) | <0.001 | 3.77 (3.12–4.38) | 2.65 (2.25–3.23) | <0.001 |
| Posterior upper leg, cm | 5.15 (4.53–5.69) | 5.46 (4.80–5.93) | 4.83 (4.43–5.37) | 0.006 | 5.39 (5.04–5.98) | 4.55 (4.19–5.17) | <0.001 |
| Anterior lower leg, cm | 2.57 (2.33–2.81) | 2.81 (2.61–3.11) | 2.40 (2.27–2.58) | <0.001 | 2.55 (2.33–2.79) | 2.60 (2.40–2.89) | 0.201 |
| Posterior lower leg, cm | 5.68 (5.09–6.22) | 6.19 (5.60–6.89) | 5.14 (4.84–5.55) | <0.001 | 5.81 (5.37–6.26) | 5.48 (4.78–6.19) | 0.060 |
| Nine‐site total, cm | 24.69 (22.12–28.61) | 28.64 (27.08–31.54) | 22.83 (21.28–24.53) | <0.001 | 27.46 (23.53–30.11) | 22.83 (21.06–26.68) | <0.001 |
IQR, interquartile range.
Table 4.
Descriptive summary of ultrasound‐measured muscle thickness using the four‐site protocol
| Variable median (IQR) | All (n = 96) | Men (n = 41) | Female (n = 55) | P‐value | Younger (<60, n = 55) | Older (≥60, n = 41) | P‐value |
|---|---|---|---|---|---|---|---|
| Four‐site protocol–minimal compression | |||||||
| Right mid‐point, cm | 4.07 (3.36–4.80) | 4.59 (3.98–5.32) | 3.51 (2.95–4.26) | <0.001 | 4.43 (4.06–5.12) | 3.37 (2.75–3.89) | <0.001 |
| Right distal third, cm | 3.04 (2.43–3.72) | 3.53 (3.00–4.29) | 2.71 (2.12–3.25) | <0.001 | 3.48 (3.01–4.18) | 2.46 (2.01–2.97) | <0.001 |
| Left mid‐point, cm | 3.97 (3.29–4.70) | 4.67 (3.95–4.99) | 3.67 (2.96–4.05) | <0.001 | 4.30 (3.92–4.97) | 3.26 (2.83–3.95) | <0.001 |
| Left distal third, cm | 3.08 (2.41–3.71) | 3.65 (2.91–4.24) | 2.72 (2.16–3.21) | <0.001 | 3.45 (3.00–4.17) | 2.39 (2.06–2.91) | <0.001 |
| Average, cm | 3.53 (2.82–4.24) | 4.17 (3.44–4.58) | 3.12 (2.59–3.72) | <0.001 | 3.92 (3.45–4.52) | 2.80 (2.42–3.44) | <0.001 |
| Four‐site protocol–maximal compression | |||||||
| Right mid‐point, cm | 1.68 (1.32–2.14) | 1.97 (1.56–2.35) | 1.51 (1.22–1.96) | <0.001 | 2.04 (1.59–2.21) | 1.40 (1.19–1.59) | <0.001 |
| Right distal third, cm | 1.53 (1.20–1.92) | 1.79 (1.37–2.03) | 1.37 (1.07–1.69) | <0.001 | 1.77 (1.32–2.03) | 1.28 (0.97–1.56) | <0.001 |
| Left mid‐point, cm | 1.68 (1.41–2.14) | 1.92 (1.62–2.31) | 1.48 (1.26–1.93) | <0.001 | 1.99 (1.61–2.30) | 1.47 (1.23–1.66) | <0.001 |
| Left distal third, cm | 1.45 (1.19–1.85) | 1.69 (1.42–2.10) | 1.24 (1.11–1.72) | <0.001 | 1.72 (1.37–2.02) | 1.22 (0.98–1.47) | <0.001 |
| Average, cm | 1.56 (1.30–1.98) | 1.93 (1.48–2.18) | 1.37 (1.17–1.85) | <0.001 | 1.86 (1.51–2.18) | 1.32 (1.15–1.53) | <0.001 |
IQR, interquartile range.
Agreement between the four‐site protocol and dual‐energy X‐ray absorptiometry appendicular lean tissue
Both minimal and maximal compression of the four‐site protocol are strongly associated with site‐specific DXA measures of lean tissue mass, but the coefficient of determination for minimal compression, R 2 = 0.82, was significantly greater compared with maximal compression, R 2 = 0.66 (P < 0.001) (Figure 1). Therefore, all further analysis was performed by using minimal compression for the four‐site protocol.
Figure 1.
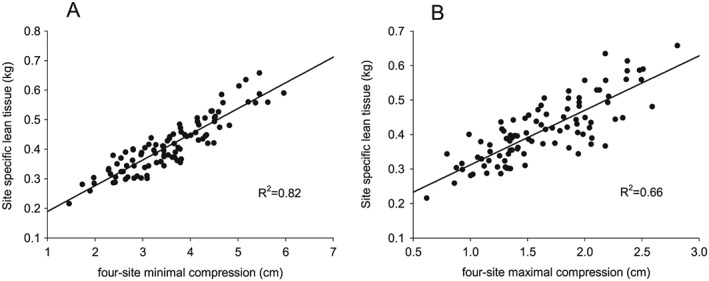
Regression analysis between site‐specific lean tissue mass derived from DXA and the four‐site ultrasound protocol using (A) minimal compression, R 2 = 0.82, and (B) maximal compression, R 2 = 0.66. DXA, dual‐energy X‐ray absorptiometry.
Linear regression analysis, using the four‐site protocol, averaged across three‐fold cross validation to predict appendicular lean tissue mass resulted in an adjusted R 2 of 0.72 and standard error of the estimate (SEE) of 2.88 kg (Table 5). Bland–Altman analysis revealed normally distributed and homoscedastic differences (DXA—four‐site protocol) for appendicular lean tissue. A significant (R 2 = 0.08, P = 0.005) proportional bias was present, with the four‐site protocol overestimating at the lower end and underestimating at the higher end of appendicular lean tissue; therefore, hyperbolic limits of agreement were constructed (Figure 2). The average hyperbolic limits of agreement, on the extreme ends (widest limits) of 10 and 35 kg of appendicular lean tissue, were −5.67 and 5.67 kg.
Table 5.
Linear regression analysis to predict appendicular lean tissue using the four‐site protocol
| Model development | Appendicular lean tissue prediction (kg) | Validation fold | Adjusted R 2 | SEE (kg) | P‐value model |
|---|---|---|---|---|---|
| Folds 1 + 2 | 4.061 + (0.100*X1) | 3 | 0.71 | 2.93 | <0.001 |
| Folds 1 + 3 | 4.037 + (0.099*X1) | 2 | 0.72 | 2.84 | <0.001 |
| Folds 2 + 3 | 3.587 + (0.102*X1) | 1 | 0.74 | 2.86 | <0.001 |
| Average | 3.895 + (0.100*X1) | ‐ | 0.72 | 2.88 | — |
X1 = average four‐site muscle thickness [(right mid‐point + right distal third + left mid‐point + left distal third)/4] × limb length (cm × cm). SEE, standard error of the estimate.
Figure 2.
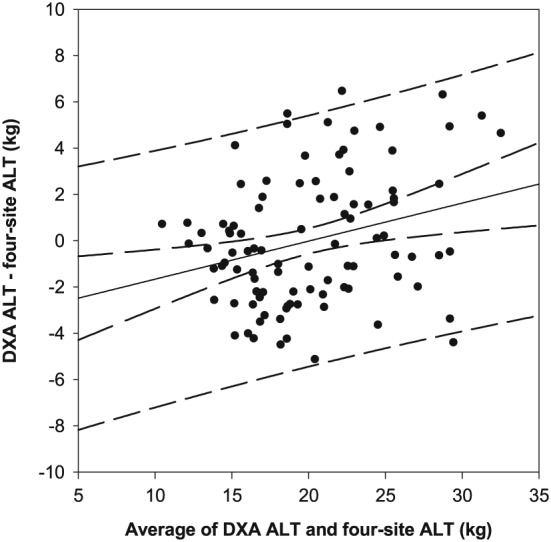
Bland–Altman plot comparing DXA derived and four‐site predicted appendicular lean tissue mass, utilizing participants from all folds. A significant (P < 0.05) proportional bias was present (solid black line, 95% CI—inner curved dashed lines), with 95% prediction intervals (outer curved dashed lines) with an average range on the highest (35 kg) and lowest (10 kg) ends of appendicular lean tissue of −5.67 and 5.67 kg. ALT, appendicular lean tissue mass; CI, confidence interval; DXA, dual‐energy X‐ray absorptiometry.
Agreement between the nine‐site protocol and dual‐energy X‐ray absorptiometry appendicular lean tissue
Linear regression analysis, using the nine‐site protocol, across the three cross‐validation folds to predict appendicular lean tissue resulted in an average adjusted R 2 of 0.90 and SEE of 1.73 kg (Supporting Information, Table S1). Bland–Altman analysis revealed normally distributed and homoscedastic differences (DXA— nine‐site protocol) for appendicular lean tissue, with no proportional bias present (P > 0.05). A non‐significant fixed bias of 0.04 kg [95% CI: −0.34, 0.35 kg] was present with limits of agreement of −3.32 and 3.32 kg and tolerance limits of −3.91 and 3.92 kg ( Figure S3).
Agreement between the optimized protocol and dual‐energy X‐ray absorptiometry appendicular lean tissue
Backwards stepwise regression identified the anterior upper arm * limb length, four‐site * limb length, age, and sex as the covariates that were significantly associated with appendicular lean tissue. The anterior upper arm and four‐site muscle thicknesses were combined as a single variable (anterior upper arm muscle thickness + average four‐site muscle thickness multiplied by height) to simplify use; summed or separate muscle thickness inputs did not alter the results. Hereafter, this protocol is referred to as the optimized five‐site protocol.
Multiple linear regression analysis, using the variables for the optimized five‐site protocol, averaged across three‐fold cross validation to predict appendicular lean tissue mass resulted in an adjusted R 2 of 0.91 and SEE of 1.62 kg (Table 6), identical to results obtained by using the nine‐site protocol. Bland–Altman analysis revealed normally distributed and homoscedastic differences (DXA—optimized five‐site protocol) for appendicular lean tissue, with no proportional bias present (P < 0.05). No fixed bias, 0.00 kg [95% CI: −0.33, 0.33 kg], was present with limits of agreement of −3.18 and 3.18 kg and tolerance limits of −3.75 and 3.75 kg (Figure 3).
Table 6.
Multi‐linear regression analysis to predict appendicular lean tissue using the optimized five‐site protocol
| Model development | Appendicular lean tissue prediction (kg) | Validation fold | Adjusted R 2 | SEE (kg) | P‐value model |
|---|---|---|---|---|---|
| Folds 1 + 2 | 2.801 + (1.564*X2) − (2.011*X3) + (0.0253*X4) | 3 | 0.91 | 1.62 | <0.001 |
| Folds 1 + 3 | 3.509 + (1.507*X2) − (2.105*X3) + (0.0238*X4) | 2 | 0.90 | 1.72 | <0.001 |
| Folds 2 + 3 | 2.477 + (1.594*X2) − (1.838*X3) + (0.0250*X4) | 1 | 0.93 | 1.54 | <0.001 |
| Average | 2.929 + (1.555*X2) − (1.985*X3) + (0.0247*X4) | — | 0.91 | 1.62 | — |
X2 = five‐site muscle thickness (average four‐site muscle thickness + anterior upper arm muscle thickness) × height (cm × m), X3 = sex (male = 0, female = 1), X4 = age (years). SEE, standard error of the estimate.
Figure 3.
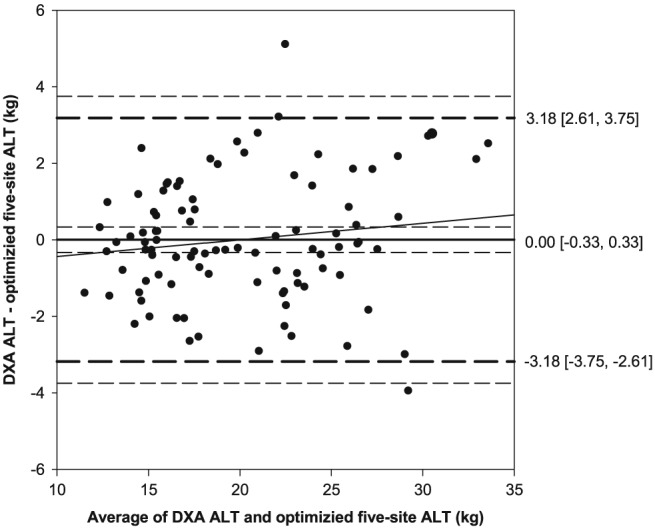
Bland–Altman plot comparing DXA‐derived and the optimized five‐site‐predicted appendicular lean tissue mass, utilizing participants from all folds. No fixed (0.00 [−0.33, 0.33]) or proportional bias was present (solid black line, 95% CI—inner short dashed line), with limits of agreement (1.96 SD) of −3.18 and 3.18 (middle long dashed lines) and tolerance limits of −3.75 and 3.75 (outer short dashed lines). ALT, appendicular lean tissue mass; CI, confidence interval; DXA, dual‐energy X‐ray absorptiometry; SD, standard deviation.
Multiple logistic regression was used to identify individuals with lower than normal lean tissue mass. The optimized five‐site protocol resulted in an average concordance index of 0.89 [0.78, 1.00], indicating a strong ability to discriminate between low and normal lean tissue mass individuals (Table 7). Based on the log odds from the optimized five‐site logistic regression, cut‐points were developed to categorize an individual into low (≤ −2.071), moderate (−2.070 to −0.6040), or high (≥ −0.6039) risk for the presence of low lean tissue mass (Table 8 and Figure 4). The proportion of individuals categorized into the low‐risk, moderate‐risk, and high‐risk categories were 59%, 25%, and 16%, respectively (Table 8). Those individuals categorized in the high‐risk group had significantly greater echogenicity (poorer muscle quality) compared with those in the moderate‐risk and low‐risk groups (P < 0.05) (Table 8).
Table 7.
Logistic regression analysis to predict presence of low appendicular lean tissue using the optimized five‐site protocol
| Model development | Log odds: low lean tissue | Odds ratio [95% CI] | Validation fold | c‐index [95% CI] | ||
|---|---|---|---|---|---|---|
| Five site | Sex (women = 1) | Age | ||||
| Folds 1 + 2 | 13.209 − (1.157*X2) − (3.415*X3) − (0.0217*X4) | 0.31 [0.15, 0.67] | 0.03 [0.00, 0.86] | 0.98 [0.94, 1.02] | 3 | 0.96 [0.89, 1.00] |
| Folds 1 + 3 | 17.914 − (1.554*X2) − (4.380*X3) − (0.0355*X4) | 0.21 [0.08, 0.57] | 0.01 [0.00, 0.50] | 0.97 [0.92, 1.02] | 2 | 0.85 [0.71, 0.99] |
| Folds 2 + 3 | 16.431 − (1.431*X2) − (4.198*X3) − (0.0275*X4) | 0.24 [0.10, 0.60] | 0.02 [0.00, 0.65] | 0.97 [0.93, 1.02] | 1 | 0.87 [0.74, 1.00] |
| Average | 15.851 − (1.381*X2) − (3.998*X3) − (0.0282*X4) | 0.26 [0.11, 0.61] | 0.02 [0.00, 0.67] | 0.97 [0.93, 1.02] | — | 0.89 [0.78, 1.00] |
X2 = five‐site muscle thickness (average four‐site muscle thickness + anterior upper arm muscle thickness) × height (cm × m), X3 = sex (male = 0, female = 1), X4 = age (years). c‐index, concordance index; CI, confidence interval.
Table 8.
Cut‐point analysis using the optimized five‐site protocol to identify low lean tissue mass
| Variable median (IQR) | Low‐risk group (≤ −2.071) | Moderate‐risk group (−2.070 to −0.6040) | High‐risk group (≥ −0.6039) |
|---|---|---|---|
| Proportion of total cohort, n/N | 57/96 (59%) | 24/96 (25%) | 15/96 (16%) |
| Proportion of individuals categorized as low lean tissue by DXA, n/N | 1/57 (2%) | 6/24 (25%) | 10/15 (67%) |
| Age, years | 33.0 (24.0–69.5)c | 28.0 (22.0–69.0)c | 77.0 (63.0–80.0)a , b |
| Echogenicity, A.U. | 33.5 (29.8–36.9)c | 38.8 (31.0–43.6)c | 47.4 (40.4–55.6)a , b |
| Men | |||
| Four‐site thickness, cm | 4.34 (3.57–5.02)c | 4.14 (3.62–4.34) | 2.66 (2.22–2.79)a |
| Anterior upper arm thickness, cm | 3.64 (3.41–3.92)c | 3.21 (3.14–3.50) | 2.68 (2.24–2.80)a |
| Women | |||
| Four‐site thickness, cm | 3.70 (3.27–4.04)b , c | 2.98 (2.55–3.92)a , c | 2.30 (1.91–2.47)a , b |
| Anterior upper arm thickness, cm | 2.70 (2.47–2.93)b , c | 2.28 (2.16–2.36)a | 2.17 (1.94–2.30)a |
Log odds: −2.071, sensitivity = 0.9411; specificity = 0.7011, positive likelihood ratio = 3.23, negative likelihood ratio = 0.083. Log odds: −0.6039, sensitivity = 0.5882; specificity = 0.9367, positive likelihood ratio = 9.30, negative likelihood ratio = 0.44. A.U., arbitrary unit; DXA, dual‐energy X‐ray absorptiometry; IQR, interquartile range.
Significant difference from low‐risk group.
Significant difference from moderate‐risk group.
Significant difference from high‐risk group.
Figure 4.
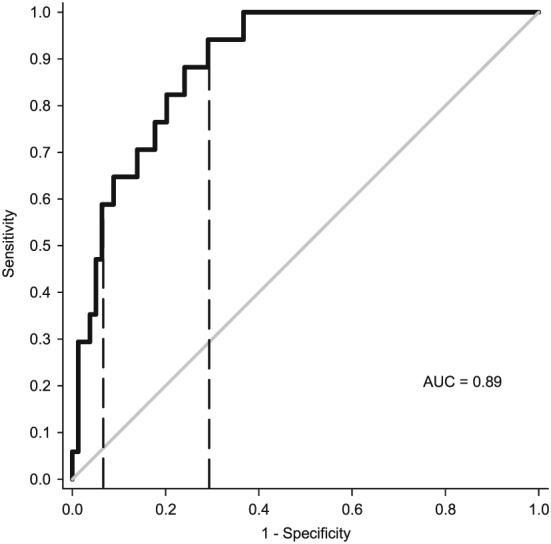
ROC curve averaged across three validation folds, utilizing the optimized five‐site protocol to identify lower than normal lean tissue mass identified by DXA. The dashed lines indicate cut‐points of −0.6039 and −2.071. AUC, area under the curve; DXA, dual‐energy X‐ray absorptiometry, ROC, receiver operating characteristic.
Reliability
Intra‐rater reliability for the four‐site protocol, assessing image acquisition and caliper placement, revealed CV and ICC [95% CI] by using minimal compression of 1.1% and 0.998 [0.996, 0.998], respectively, and for maximal compression, 2.5% and 0.989 [0.983, 0.993], respectively (Table 9). Inter‐rater reliability of the four‐site protocol, assessing the entire ultrasound protocol, revealed CV and ICC by using minimal compression of 3.7% and 0.988 [0.966, 0.996], respectively, and for maximal compression, 9.0% and 0.945 [0.843, 0.981], respectively (Table 9).
Table 9.
Intra‐rater and inter‐rater reliability of the four‐site protocol
| Intra‐rater | Inter‐rater | |||
|---|---|---|---|---|
| Level of Compression | Minimal | Maximal | Minimal | Maximal |
| ICC [95% CI] | 0.998 [0.996, 0.998] | 0.989 [0.983, 0.993] | 0.988 [0.966, 0.996] | 0.945 [0.843, 0.981] |
| CV, % | 1.1 | 2.5 | 3.7 | 9.0 |
ICC (1,1) was used for intra‐rater analysis, and ICC (3,1) was used for inter‐rater analysis. CV, coefficient of variation; CI, confidence interval; ICC, intra‐class correlation coefficient.
Reliability was further assessed by using Bland–Altman plots. Intra‐rater plots, for both minimal and maximal compression, revealed normal and homoscedastic differences (first measure to second measure) for the four‐site protocol, with proportional bias in a single plot (minimal compression, P < 0.05). Minimal compression average bias [95% CI] for all intra‐rater plots (except plot with proportional bias) was −0.04 [−0.03, 0.01 cm] ( Figure S4) and for maximal compression, a significant fixed bias of −0.02 [−0.04, −0.01 cm] ( Figure S5). Minimal compression average limits of agreement and tolerance limits were −0.14 and 0.12 cm and −0.16 and 0.14 cm ( Figure S4) and for maximal compression, −0.16 and 0.11 cm and −0.18 and 0.14 cm ( Figure S5).
Inter‐rater Bland–Altman plot for minimal compression and maximal compression demonstrated normally distributed and homoscedastic differences (Rater 1–Rater 2) for the four‐site protocol, with no proportional bias (P > 0.05). For minimal compression, non‐significant fixed bias [95% CI] of −0.05 cm [−0.15, 0.05 cm], with limits of agreement and tolerance limits of −0.41 and 0.31 cm and −0.58 and 0.49 cm, respectively (Figure 5). For maximal compression, non‐significant fixed bias of −0.01 cm [−0.12, 0.11 cm], with limits of agreement and tolerance limits of −0.43 and 0.41 cm and −0.63 and 0.61 cm, respectively (Figure 5).
Figure 5.
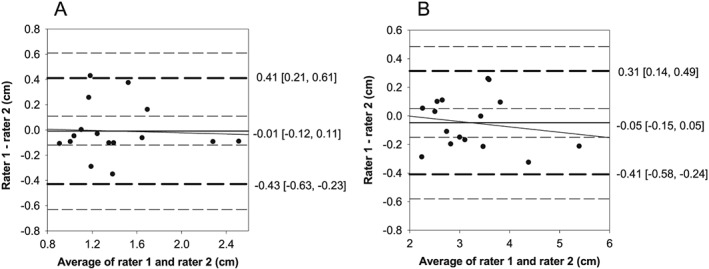
Bland–Altman plots for inter‐rater reliability using the four‐site protocol for (A) minimal and (B) maximal compression. (A) Minimal compression: no fixed (−0.05 [−0.15, 0.05]) or proportional bias was present (solid black line, 95% CI—inner long dashed lines), with limits of agreement (1.96 SD) of −0.41 and 0.31 (middle short dashed lines) and tolerance limits of −0.58 and 0.49 (outer long dashed lines). (B) Maximal compression: no fixed (−0.01 [−0.12, 0.11]) or proportional bias was present (solid black line, 95% CI—inner long dashed lines), with limits of agreement (1.96 SD) of −0.43 and 0.31 (middle short dashed lines) and tolerance limits of −0.63 and 0.61 (outer long dashed lines). CI, confidence interval; SD, standard deviation.
Discussion
This study sought to develop and internally validate a bedside viable ultrasound protocol to predict appendicular lean tissue mass and identify those with lower than normal measures in a heterogeneous cohort of healthy participants. We demonstrated that a previously developed four‐site protocol14 provided stronger correlations with lean tissue mass when using minimal compression (R 2 = 0.82), compared with maximal compression (R 2 = 0.66), at the same site‐specific landmarks using DXA. While the four‐site protocol is strongly associated with appendicular lean tissue mass (R 2 = 0.72), we observed wide limits of agreement (−5.67, 5.67 kg). However, when the anterior upper arm muscle thickness, age, and sex were added to the four‐site protocol, the association with appendicular lean tissue mass improved to R 2 = 0.91 and demonstrated a strong ability [area under the curve (AUC) = 0.89] to identify low lean tissue mass. Within this participant cohort, the optimized five‐site model provided the same level of accuracy as other more comprehensive models (such as the nine‐site protocol), while still being feasible at the bedside.
Low muscularity, as defined by abdominal CT muscle CSA, is exhibited by 40–70% of clinical patients, including critically ill, liver cirrhotic, and various cancers.9 Furthermore, these patients may experience accelerated rates of muscle atrophy during their hospital stay (i.e. acute care and intensive care unit) or throughout treatment of their disease (i.e. chemotherapy), resulting in substantial losses of musculature.1, 2, 29 The presence of lower than normal muscularity, or the muscle atrophy that occurs during hospitalization or treatment, has several deleterious consequences for the patient, including increased length of stay and rates of readmission to the hospital,30, 31 increased rates of mortality,3, 4, 32 and a loss of strength and functional capacity.2 Developing targeted nutritional or rehabilitative therapies to attenuate muscle atrophy during these periods is critical for improving quality of life and independence for these patients. While assessment of musculature is not the only parameter to consider when developing these therapies, it is a central factor involved in recovery of functional capacity and is quantifiable as a specific end point for assessing the success or failure of these interventions. While ultrasound provides an accessible tool to prospectively quantify skeletal muscle, these measures are challenging to interpret due to the lack of data comparing bedside applicable protocols to accurate whole‐body reference measures of muscle or lean tissue mass.
While the quadriceps muscles are a commonly utilized landmark for many ultrasound protocols, here, we demonstrate that although the muscle thicknesses of the quadriceps, using the four‐site protocol, are strongly associated (R 2 = 0.72) with appendicular lean tissue mass, Bland–Altman analysis revealed wide limits of agreement (−5.67, 5.67 kg). Currently, there is no consensus on what is considered an acceptable level of error for body composition analysis; here, we consider 3.2 kg to be acceptable limits of agreement, which is based on the average appendicular lean tissue mass difference in a large cohort of Caucasian older adults (n = 450, 50–79 years old) identified as having low or normal lean tissue by using DXA.33 Utilizing this approach to analyse the accuracy of the four‐site protocol (limits of agreement: −5.67, 5.67 kg) suggests that the four‐site protocol alone may not accurately predict appendicular lean tissue.
We attempted to optimize the predictive accuracy of the ultrasound model by incorporating age, sex, and the anterior upper arm muscle thickness, which improved the associations (R 2 = 0.91) with appendicular lean tissue mass and reduced the limits of agreement (−3.18, 3.18 kg) to below our clinically defined acceptable thresholds of 3.2 kg. Taken together, these results suggest that this optimized five‐site protocol may accurately represent appendicular lean tissue mass, an excellent surrogate of whole‐body muscle mass, and often used to identify low lean tissue mass.7 An advantageous aspect of this model, compared with other bedside applicable protocols,34, 35 is that the optimized five‐site protocol is weight independent, which may be a difficult variable to accurately measure in certain clinical populations.
Of critical importance when assessing these models is to determine their ability to identify individuals who may be at risk of lower than normal muscle or lean tissue mass.36 Few ultrasound investigations have performed these analyses, utilizing various reference measures (CT and bio‐electrical impendence analysis), observing moderate to strong abilities to identify low muscle or fat‐free mass (AUC = 0.77–0.89).34, 35, 37 Here, we used an accurate whole‐body reference method and demonstrated a strong ability to identify individuals with low lean tissue mass by using the optimized five‐site protocol (AUC = 0.89). Rather than develop a single cut‐point to identify individuals as having low or normal lean tissue mass, as is commonly performed when developing cut‐points for body composition analysis,38, 39, 40 we developed two cut‐points, which categorizes individuals into three groups (low, moderate, and high) for risk of low lean tissue mass, enabling a more comprehensive characterization of muscularity. However, these cut‐points require validation to determine the associations with functional capacity, metabolic health, and meaningful clinical outcomes. Alongside this approach, increasing literature is demonstrating that muscle quality (fat and fibrotic infiltration, muscle architecture, and neuromuscular adaptations), more so than muscle quantity, may better identify individuals with poor muscle tissue health.41, 42 Ultrasound has the capacity to investigate muscle quality through the assessment of echogenicity and muscle architecture and may be an important aspect to investigate alongside muscle mass in the future.21 Interestingly, here, individuals in the high‐risk group for low lean tissue also displayed the poorest‐quality muscle; however, this is likely due to the higher prevalence of low lean tissue mass in the older adult cohort.
Since quantifying muscle thickness is dependent on the operator's skill in landmarking, placement of the probe, and correct identification of the fascia borders, we assessed the reliability of the four‐site protocol and demonstrated that minimal compression is more reliable than maximal compression. Furthermore, despite re‐applying the entire ultrasound protocol, minimal compression displayed inter‐rater limits of agreement (−0.41, 0.31 cm) smaller than the average muscle thickness loss of the rectus femoris and vastus intermedialis (0.44 cm) after 3 days in the ICU.2 Overall, these results agree with a recent systematic review suggesting that ultrasound is a reliable modality to measure muscle thickness for the quadriceps muscles.43
With the development of prediction equations for appendicular lean tissue mass and the categorization of low lean tissue mass using the optimized five‐site model, clinicians and researchers would be able to prospectively assess appendicular lean tissue mass or stratify an individual based on their muscularity at the bedside. However, there are limitations to the current study that may alter the application of these results. First, all validation aspects of the models were performed internally, and therefore, the model may be optimized to this participant cohort, which may result in additional variability when applied to other individuals. Second, no participants were categorized as underweight (BMI < 18.5 kg/m2), potentially limiting the applicability of these results to those individuals with the lowest appendicular lean tissue mass; however, often <10% of patients fall below 18.5 kg/m2. 9 Third, the reliability results should be interpreted with caution, due to both a small sample size and having two fixed raters performing all analysis. Lastly, muscle atrophy may not occur uniformly throughout the body,44, 45, 46 and therefore, changes in musculature would only be detected if the atrophy occurs in the anterior upper arm or quadriceps muscles using this protocol.
Conclusions
We demonstrated that the four‐site protocol can be improved with the addition of the anterior upper arm muscle thickness, sex, and age when predicting appendicular lean tissue mass. This optimized five‐site protocol demonstrated a strong ability to identify individuals with low lean tissue mass. Utilizing this protocol, we developed two cut‐points, which categorize individuals into low, moderate, and high risks of low lean tissue mass, but these thresholds require validation against measures of muscle tissue health.
Conflict of interest
Michael T. Paris, Benoit Lafleur, Joel A. Dubin, and Marina Mourtzakis declare that they have no conflict of interest.
Supporting information
Supplemental Table 1. Linear regression analysis to predict appendicular lean tissue using the nine‐site protocol.
Supplemental Figure 1. Participant flow chart.
Supplemental Figure 2. Comparison between minimal (A) and maximal compression (B) protocols within a single participant.
Supplemental Figure 3. Bland‐Altman plot comparing DXA derived and the nine‐site protocol predicted appendicular lean tissue mass, utilizing all participants from all folds.
Supplemental Figure 4. Bland‐Altman plots for intra‐rater reliability using the four‐site protocol for minimal compression.
Supplemental Figure 5. Bland‐Altman plots for intra‐rater reliability using the four‐site protocol for maximal compression.
Acknowledgements
We would like to thank Janice Skafel and Stephanie Auer for providing their services to conduct all DXA scans, Jack Callaghan for providing access to the ultrasound imaging device, Mamiko Noguchi and Kathryn Zuj for their assistance in ultrasound training, and Alyssa Tondat for her assistance with data collection. This study was supported by Canada Graduate Scholarship (Master)–Canadian Institute of Health Research, Province of Ontario Ministry of Research and Innovation Early Researcher Award, Canada Foundation for Innovation, Natural Sciences and Engineering Research Council, and Canadian Institute of Health Research. MTP and MM designed the research; MTP and BL conducted all data collections; MTP and JD performed all statistical analysis; MTP and MM drafted the manuscript; all authors have responsibility for the final content and read and approved the final manuscript. All authors certify that they comply with the ethical guidelines for publishing in the Journal of Cachexia, Sarcopenia and Muscle: update 2015.47
Paris, M. T. , Lafleur, B. , Dubin, J. A. , and Mourtzakis, M. (2017) Development of a bedside viable ultrasound protocol to quantify appendicular lean tissue mass. Journal of Cachexia, Sarcopenia and Muscle, 8: 713–726. doi: 10.1002/jcsm.12213.
References
- 1. Puthucheary Z, Rawal J, McPhail M, Connolly B, Ratnayake G, Chan P, et al. Acute skeletal muscle wasting in critical illness. JAMA 2013;310:1–10. [DOI] [PubMed] [Google Scholar]
- 2. Parry SM, El‐Ansary D, Cartwright MS, Sarwal A, Berney S, Koopman R, et al. Ultrasonography in the intensive care setting can be used to detect changes in the quality and quantity of muscle and is related to muscle strength and function. J Crit Care 2015;30:1151.e9–1151.e14. [DOI] [PubMed] [Google Scholar]
- 3. Moisey LL, Mourtzakis M, Cotton BA, Premji T, Heyland DK, Wade CE, et al. Skeletal muscle predicts ventilator‐free days, ICU‐free days, and mortality in elderly ICU patients. Crit Care 2013;17:R206, https://doi.org/10.1186/cc12901. [DOI] [PMC free article] [PubMed] [Google Scholar]
- 4. Weijs PJM, Looijaard WGPM, Dekker IM, Stapel SN, Girbes AR, Oudemans‐van Straaten HM, et al. Low skeletal muscle area is a risk factor for mortality in mechanically ventilated critically ill patients. Crit Care 2014;18:1–7. [DOI] [PMC free article] [PubMed] [Google Scholar]
- 5. Filippin LI, Teixeira VNDO, da Silva MPM, Miraglia F, da Silva FS. Sarcopenia: a predictor of mortality and the need for early diagnosis and intervention. Aging Clin Exp Res 2015;27:249–254. [DOI] [PubMed] [Google Scholar]
- 6. Prado C, Heymsfield SB. Lean tissue imaging: a new era for nutritional assessment and intervention. JPEN J Parenter Enteral Nutr 2014;38:940–953. [DOI] [PMC free article] [PubMed] [Google Scholar]
- 7. Cruz‐Jentoft AJ, Baeyens JP, Bauer JM, Boirie Y, Cederholm T, Landi F, et al. Sarcopenia: European consensus on definition and diagnosis: report of the European Working Group on Sarcopenia in older people. Age Ageing 2010;39:412–423. [DOI] [PMC free article] [PubMed] [Google Scholar]
- 8. Mourtzakis M, Prado CMM, Lieffers JR, Reiman T, McCargar LJ, Baracos VE. A practical and precise approach to quantification of body composition in cancer patients using computed tomography images acquired during routine care. Appl Physiol Nutr Metab 2008;33:997–1006. [DOI] [PubMed] [Google Scholar]
- 9. Paris M, Mourtzakis M. Assessment of skeletal muscle mass in critically ill patients: considerations for the utility of computed tomography imaging and ultrasonography. Curr Opin Clin Nutr Metab Care 2016;19:125–130. [DOI] [PubMed] [Google Scholar]
- 10. Sanada K, Kearns CF, Midorikawa T, Abe T. Prediction and validation of total and regional skeletal muscle mass by ultrasound in Japanese adults. Eur J Appl Physiol 2006;96:24–31. [DOI] [PubMed] [Google Scholar]
- 11. Abe T, Thiebaud RS, Loenneke JP, Young KC. Prediction and validation of DXA‐derived appendicular lean soft tissue mass by ultrasound in older adults. Age (Omaha) 2015;37:1–10. [DOI] [PMC free article] [PubMed] [Google Scholar]
- 12. Abe T, Kondom M, Kawakami Y, Fukunaga T. Prediction equations for body composition of Japanese adults by B‐mode ultrasound. Am J Hum Biol 1994;170:161–170. [DOI] [PubMed] [Google Scholar]
- 13. Takai Y, Ohta M, Akagi R, Kato E, Wakahara T, Kawakami Y, et al. Applicability of ultrasound muscle thickness measurements for predicting fat‐free mass in elderly population. J Nutr Health Aging 2014;18:579–585. [DOI] [PubMed] [Google Scholar]
- 14. Gruther W, Benesch T, Zorn C, Paternostro‐Sluga T, Quittan M, Fialka‐Moser V, et al. Muscle wasting in intensive care patients: ultrasound observation of the M. quadriceps femoris muscle layer. J Rehabil Med 2008;40:185–189. [DOI] [PubMed] [Google Scholar]
- 15. Nana A, Slater GJ, Hopkins WG, Burke LM. Techniques for undertaking dual‐energy X‐ray absorptiometry whole‐body scans to estimate body composition in tall and/or broad subjects. Int J Sport Nutr Exerc Metab 2012;22:313–322. [DOI] [PubMed] [Google Scholar]
- 16. Heymsfield SB, Smith R, Aulet M, Bensen B, Lichtman S, Wang J, et al. Appendicular skeletal muscle mass: measurement by dual‐photon absorptiometry. Am J Clin Nutr 1990;52:214–218. [DOI] [PubMed] [Google Scholar]
- 17. Kim J, Wang Z, Heymsfield SB, Baumgartner RN, Gallagher D. Total‐body skeletal muscle mass: estimation by a new dual‐energy X‐ray absorptiometry method. Am J Clin Nutr 2002;76:378–383. [DOI] [PubMed] [Google Scholar]
- 18. Baumgartner RN, Koehler KM, Gallagher D, Romero L, Heymsfield SB, Ross RR, et al. Epidemiology of sarcopenia among the elderly in New Mexico. Am J Epidemiol 1998;147:755–763. [DOI] [PubMed] [Google Scholar]
- 19. Fukumoto Y, Ikezoe T, Yamada Y, Tsukagoshi R, Nakamura M, Mori N, et al. Skeletal muscle quality assessed from echo intensity is associated with muscle strength of middle‐aged and elderly persons. Eur J Appl Physiol 2012;112:1519–1525. [DOI] [PubMed] [Google Scholar]
- 20. Tillquist M, Kutsogiannis DJ, Wischmeyer PE, Kummerlen C, Leung R, Stollery D, et al. Bedside ultrasound is a practical and reliable measurement tool for assessing quadriceps muscle layer thickness. JPEN J Parenter Enteral Nutr 2014;38:886–890. [DOI] [PMC free article] [PubMed] [Google Scholar]
- 21. Harris‐Love MO, Monfaredi R, Ismail C, Blackman MR, Cleary K. Quantitative ultrasound: measurement considerations for the assessment of muscular dystrophy and sarcopenia. Front Aging Neurosci 2014;6:172, https://doi.org/10.3389/fnagi.2014.00172. [DOI] [PMC free article] [PubMed] [Google Scholar]
- 22. Sarwal A, Parry SM, Berry MJ, Hsu F‐C, Lewis MT, Justus NW, et al. Interobserver reliability of quantitative muscle sonographic analysis in the critically ill population. J Ultrasound Med 2015;34:1191–1200. [DOI] [PubMed] [Google Scholar]
- 23. Kohavi R. A study of cross‐validation and bootstrap for accuracy estimation and model selection. Int Jt Conf Artif Intell 1995;14:1137–1143. [Google Scholar]
- 24. Bland JM, Altman DG. Measuring agreement in method comparison studies. Stat Methods Med Res 1999;8:135–160. [DOI] [PubMed] [Google Scholar]
- 25. Ludbrook J. Confidence in Altman–Bland plots: a critical review of the method of differences. Clin Exp Pharmacol Physiol 2010;37:143–149. [DOI] [PubMed] [Google Scholar]
- 26. Šimundić A‐M. Measures of diagnostic accuracy: basic definitions. Med Biol Sci 2009;19:203–211. [PMC free article] [PubMed] [Google Scholar]
- 27. Rankin G, Stokes M. Reliability of assessment tools in rehabilitation: an illustration of appropriate statistical analyses. Clin Rehabil 1998;12:187–199. [DOI] [PubMed] [Google Scholar]
- 28. Mukaka MM. Statistics corner: a guide to appropriate use of correlation coefficient in medical research definitions of correlation and clarifications. Malawi Med J 2012;24:69–71. [PMC free article] [PubMed] [Google Scholar]
- 29. Di Sebastiano KM, Yang L, Zbuk K, Wong RK, Chow T, Koff D, et al. Accelerated muscle and adipose tissue loss may predict survival in pancreatic cancer patients: the relationship with diabetes and anaemia. Br J Nutr 2013;109:302–312. [DOI] [PubMed] [Google Scholar]
- 30. Greening N, Harvey‐Dunstan T, Chaplin E, Vincent E, Morgan M, Singh S, et al. Bedside assessment of quadriceps muscle using ultrasound following admission for acute exacerbations of chronic respiratory disease. Am J Respir Crit Care Med 2015;192:810–816. [DOI] [PMC free article] [PubMed] [Google Scholar]
- 31. Montano–Loza AJ, Meza–Junco J, Baracos VE, Prado CMM, Ma M, Meeberg G, et al. Severe muscle depletion predicts postoperative length of stay but is not associated with survival after liver transplantation. Liver Transpl 2014;20:640–648. [DOI] [PubMed] [Google Scholar]
- 32. Montano–Loza AJ, Meza–Junco J, Prado CMM, Lieffers JR, Baracos VE, Bain VG, et al. Muscle wasting is associated with mortality in patients with cirrhosis. Clin Gastroenterol Hepatol 2012;10:166–173.e1. [DOI] [PubMed] [Google Scholar]
- 33. Scott D, Sanders KM, Aitken D, Hayes A, Ebeling PR, Jones G. Sarcopenic obesity and dynapenic obesity: 5‐year associations with falls risk in middle‐aged and older adults. Obesity 2014;22:1568–1574. [DOI] [PubMed] [Google Scholar]
- 34. Paris M, Mourtzakis M, Day A, Leung R, Watharkar S, Kozar R, et al. VALIDation of bedside Ultrasound of Muscle layer thickness of the quadriceps in the critically ill patient (VALIDUM study): a prospective multicenter study. J Parenter Enteral Nutr 2016; 1000460758). https://doi.org/10.1177/0148607116637852. [DOI] [PubMed] [Google Scholar]
- 35. Tandon P, Low G, Mourtzakis M, Zenith L, Myers R, Abraldes J, et al. A model to identify sarcopenia in patients with cirrhosis. Clin Gastroenterol Hepatol 2016; https://doi.org/10.1016/j.toxicon.2008.05.012. [DOI] [PubMed] [Google Scholar]
- 36. Earthman CP. Body composition tools for assessment of adult malnutrition at the bedside: a tutorial on research considerations and clinical applications. 2015. https://doi.org/10.1177/0148607115595227. [DOI] [PubMed]
- 37. Kuyumcu ME, Halil M, Kara Ö, Çuni B, Çağlayan G, Güven S, et al. Ultrasonographic evaluation of the calf muscle mass and architecture in elderly patients with and without sarcopenia. Arch Gerontol Geriatr 2016;65:218–224. [DOI] [PubMed] [Google Scholar]
- 38. Baumgartner RN, Waters DL, Gallagher D, Morley JE, Garry PJ. Predictors of skeletal muscle mass in elderly men and women. Mech Ageing Dev 1999;107:123–136. [DOI] [PubMed] [Google Scholar]
- 39. Delmonico MJ, Harris TB, Lee JS, Visser M, Nevitt M, Kritchevsky SB, et al. Alternative definitions of sarcopenia, lower extremity performance, and functional impairment with aging in older men and women. J Am Geriatr Soc 2007;55:769–774. [DOI] [PubMed] [Google Scholar]
- 40. Newman AB, Kupelian V, Visser M, Simonsick E, Goodpaster B, Nevitt M, et al. Sarcopenia: alternative definitions and associations with lower extremity function. J Am Geriatr Soc 2003;51:1602–1609. [DOI] [PubMed] [Google Scholar]
- 41. McGregor RA, Cameron‐Smith D, Poppitt SD. It is not just muscle mass: a review of muscle quality, composition and metabolism during ageing as determinants of muscle function and mobility in later life. Longev Healthspan 2014;3:9, https://doi.org/10.1186/2046‐2395‐3‐9. [DOI] [PMC free article] [PubMed] [Google Scholar]
- 42. Goodpaster BH, Park SW, Harris TB, Kritchevsky SB, Nevitt M, Schwartz AV, et al. The loss of skeletal muscle strength, mass, and quality in older adults: the health, aging and body composition study. J Gerontol A Biol Sci Med Sci 2006;61:1059–1064. [DOI] [PubMed] [Google Scholar]
- 43. English C, Fisher L, Thoirs K. Reliability of real‐time ultrasound for measuring skeletal muscle size in human limbs in vivo: a systematic review. Clin Rehabil 2012;26:934–944. [DOI] [PubMed] [Google Scholar]
- 44. Abe T, Loenneke JP, Thiebaud RS, Fukunaga T. Age‐related site‐specific muscle wasting of upper and lower extremities and trunk in Japanese men and women. Age (Dordr) 2014;36:813–821. [DOI] [PMC free article] [PubMed] [Google Scholar]
- 45. Abe T, Kawakami Y, Suzuki Y, Gunji A, Fukunaga T. Effects of 20 days bed rest on muscle morphology. J Gravit Physiol 1997;4:S10–S14. [PubMed] [Google Scholar]
- 46. Turton P, Hay R, Taylor J, McPhee J, Welters I, Kress J, et al. Human limb skeletal muscle wasting and architectural remodeling during five to ten days intubation and ventilation in critical care—an observational study using ultrasound. BMC Anesthesiol 2016;16:119. [DOI] [PMC free article] [PubMed] [Google Scholar]
- 47. von Haehling S, Morley JE, Coats AJS, Anker SD. Ethical guidelines for publishing in the Journal of Cachexia, Sarcopenia and Muscle: update 2015. J Cachexia Sarcopenia Muscle 2015;6:315–316. [DOI] [PMC free article] [PubMed] [Google Scholar]
Associated Data
This section collects any data citations, data availability statements, or supplementary materials included in this article.
Supplementary Materials
Supplemental Table 1. Linear regression analysis to predict appendicular lean tissue using the nine‐site protocol.
Supplemental Figure 1. Participant flow chart.
Supplemental Figure 2. Comparison between minimal (A) and maximal compression (B) protocols within a single participant.
Supplemental Figure 3. Bland‐Altman plot comparing DXA derived and the nine‐site protocol predicted appendicular lean tissue mass, utilizing all participants from all folds.
Supplemental Figure 4. Bland‐Altman plots for intra‐rater reliability using the four‐site protocol for minimal compression.
Supplemental Figure 5. Bland‐Altman plots for intra‐rater reliability using the four‐site protocol for maximal compression.