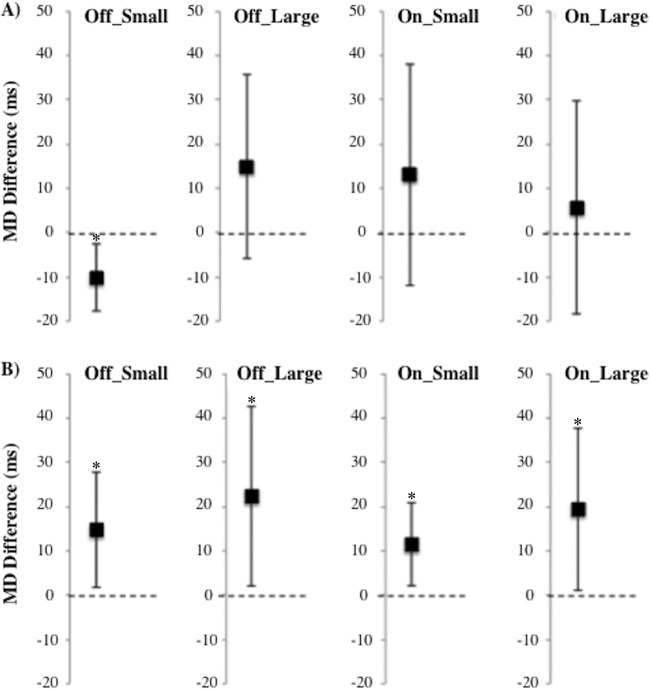
Figure 5.
Movement duration (MD) difference scores compared to zero. (A) PD patients (n = 14). (B) Controls (n = 14). MD differences are displayed for each medication status and target jump size. Participants performed the task in either the ON-OFF or OFF-ON medication orders. The error bars reflect a 95% confidence interval. MD difference scores are significantly above 0 for healthy controls but not PD patients. *p < 0.05.

