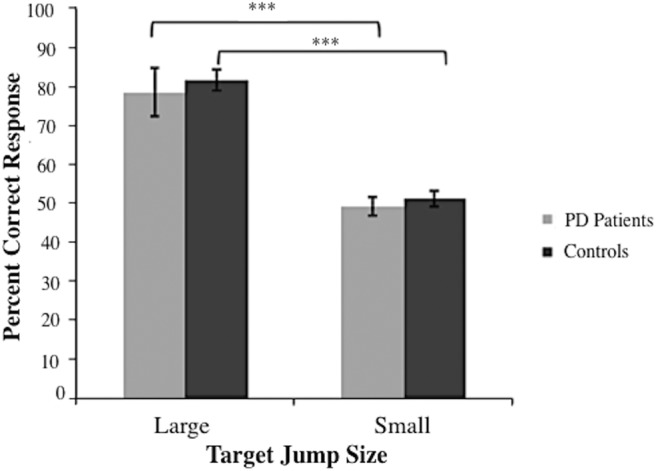
Figure 8.

Percentage of correct responses in target jump judgment two-alternative forced choice task. Correct responses are shown as a function of target jump size. Means of the percentage of correct responses are collapsed across medication status for both groups (nPD = 14, ncontrol = 14). The error bars reflect standard error about the mean. ***p < 0.001.
