

Summary
Tissue-resident macrophages play critical roles in sentinel and homeostatic functions as well as promoting inflammation and immunity. It has become clear that the generation of these cells is highly dependent upon tissue-specific cues derived from the microenvironment that in turn regulate unique differentiation programs. Recently, a role for GATA6 has emerged in the differentiation programming of resident peritoneal macrophages. We identify a critical role for mTOR in integrating cues from the tissue microenvironment in regulating differentiation and metabolic reprogramming. Specifically, inhibition of mTORC2 leads to enhanced GATA6 expression in a FOXO1 dependent fashion. Functionally, inhibition of mTORC2 promotes peritoneal resident macrophage generation in the resolution phase during zymosan-induced peritonitis. Also, mTORC2 deficient peritoneal resident macrophages displayed increased functionality and metabolic reprogramming. Notably, mTORC2 activation distinguishes tissue-resident macrophage proliferation and differentiation from that of M2 macrophages. Overall, our data implicate a selective role for mTORC2 in the differentiation of tissue-resident macrophages.
eTOC Blurb
Min-Hee et al. identify the mTORC2-FOXO1 axis as playing a critical role in integrating cues from the microenvironment to regulate metabolic reprogramming, differentiation, and function of peritoneal tissue-resident macrophages.
Introduction
Initially described over a century ago based on their ability to phagocytize foreign material, macrophages play an essential role in linking innate and adaptive immunity (Gordon, 2008). More recently, akin to T-helper cell differentiation, macrophage activation has been classified into discrete subsets. In this paradigm, M1 or classically activated macrophages are induced by LPS and Th1 cytokines (IFN3) and characterized by secretion of large amounts of pro-inflammatory cytokines such as TNF-α, IL-6, IL-1 and IL-12 (Taylor et al., 2005). On the other hand, M2 or alternatively activated macrophages are typically induced by Th2 cytokines (IL-4/IL-13) and express arginase 1 (Arg1) , chitinase 3-like 3 (Chil3), resistin-like molecule alpha1 (Relmα), and the mannose receptor (Mrc1, CD206) (Martinez et al., 2009). In such a model, M1 macrophages are believed to play an important role in bacterial or viral infections (Pluddemann et al., 2011), whereas M2 macrophages have been implicated in allergy, parasite infection, wound healing and tissue remodeling (Murray and Wynn, 2011). While this model has provided a useful framework for the study of macrophage differentiation and function, it is clear that it does not reflect the heterogeneity and plasticity that characterizes macrophages in different tissues and diseases (Gentek et al., 2014; Martinez and Gordon, 2014).
Macrophages are frequently thought to differentiate solely from peripheral circulating blood mononuclear precursors that originate from bone marrow. As a result, three types of macrophages, bone-marrow derived macrophages (BMDM), monocytes-derived macrophages, and thioglycollate-elicited macrophages have been widely used for macrophage studies for various in vitro studies. While these methods are efficient ways to enrich macrophages for study, they are all derived from bone marrow precursors, and therefore do not recapitulate the behaviors and functions of tissue-resident macrophages in their particular tissue niche (Davies et al., 2013; Dey et al., 2014; Epelman et al., 2014).
Recently, several papers have described a unique subset of macrophages called tissue-resident macrophages (ResMφ). ResMφoriginate not only from blood but also from the yolk sac or fetal liver, even before bone marrow hematopoiesis begins (Ginhoux and Jung, 2014). Unlike monocyte-derived macrophages, ResMφmaintain their numbers by self-renewal and have unique functions in their respective tissues (Hashimoto et al., 2013; Jenkins et al., 2011).
A thorough characterization of ResMφ is relatively lacking; however, transcriptional profiling suggests that ResMφ have a unique gene expression signature (Gautier et al., 2012; Gosselin et al., 2014; Lavin et al., 2014). Based on these findings, three insightful studies have demonstrated that GATA6 is a transcription factor expressed specifically in peritoneal ResMφ, thus defining this population of cells (Gautier et al., 2014; Okabe and Medzhitov, 2014; Rosas et al., 2014).
The mechanistic target of rapamycin (mTOR) is an evolutionarily conserved serine/threonine kinase which plays an important role in integrating environmental cues to regulate cellular activation, differentiation, proliferation and function (Powell et al., 2012). mTOR signals via two complexes: mTORC1 which is characterized by the adaptor protein RAPTOR and its activity is typically measured by the phosphorylation of S6K and 4E-BP1, and mTORC2, characterized by the adaptor protein RICTOR and its activity is typically measured by the phosphorylation of AKT at Serine 473 (Laplante and Sabatini, 2009). mTORC1 and mTORC2 signaling play different and selective roles in guiding T cell differentiation (Delgoffe et al., 2011; Heikamp et al., 2014; Pollizzi et al., 2015). Likewise, recent work has demonstrated the importance of mTOR in activation and polarization in monocyte-derived macrophages (Ai et al., 2014; Byles et al., 2013; Festuccia et al., 2014; Hallowell et al., 2017; Huang et al., 2016; Jiang et al., 2014; Linke et al., 2017; Pan et al., 2012; Weichhart et al., 2008; Zhu et al., 2014). In this report, we demonstrate a critical role for mTORC2 in regulating peritoneal ResMφ differentiation, metabolic reprogramming and function.
Results
Tissue-resident peritoneal macrophages have lower mTORC2 activity compared to monocyte-derived peritoneal macrophages
We hypothesized that mTOR signaling might play a critical role in integrating signals from the immune microenvironment to regulate the generation of tissue-resident macrophages (ResMφ). First, we sought to assess mTOR activity of peritoneal ResMφ and monocyte-derived macrophages (MoMφ). To this end, we sorted CD11b+F4/80hi ResMφ and CD11b+F4/80lo MoMφ (Jenkins et al., 2011) from the peritoneal cavity of unmanipulated C57BL/6 mice (Figure 1A). mTOR activity from isolated cells was determined by immunoblot. Interestingly, CD11b+F4/80hi ResMφ demonstrated lower mTORC2 activity, as assessed by p-AKT at Ser473 than did CD11b+F4/80lo MoMφ (Figure 1B). To confirm this finding, we utilized two mouse models to enrich for MoMφ and ResMφ in the peritoneal cavity. We employed intraperitoneal injection of thioglycollate (Thio) or IL-4 complex (IL-4c: a mixture of recombinant IL-4 and anti-IL-4 antibody) to induce MoMφ and ResMφ, respectively (Jenkins et al., 2011) (Figure 1C). Consistent with our initial findings, IL-4c induced peritoneal macrophages demonstrated lower mTORC2 activity when compared to thioglycollate-elicited macrophages (Figure 1D). In contrast, mTORC1 activity, as indicated by phosphorylation of S6 was similar between these two subsets (Figure S1A). This decrease in mTORC2 activity in the setting of normal mTORC1 activity led us to posit that mTORC2 might play a role in regulating the generation of ResMφ.
Figure 1. Tissue-resident peritoneal macrophages have lower mTORC2 activity compared with monocyte-derived peritoneal macrophages.

(A) Peritoneal exudates were collected from unmanipulated C57BL/6 mice (pool of 10 mice) and stained with F4/80 and CD11b. Two subsequent populations were sorted: FACS sorted CD11b+F4/80hi (ResMφ) and CD11b+F4/80lo (MoMφ). (B) FACS sorted cells from (A) were subjected to immunoblot. mTORC2 activity was assessed by p-AKT S473 and was normalized to AKT1. (C) Mice were treated with thioglycollate on day 0 (Left) and IL-4c on days 0 and 2 (Right). Phenotype of cells from peritoneal cavity was analyzed by flow cytometry on day 4. (D) After 3 hrs incubation on plastic plate, attached cells were harvested and mTORC2 activity was analyzed by immunoblot (N=3/group). (E) mTORC1 activity (p-S6 S240/244 and p-4E-BP1 T37/46) and mTORC2 activity (p-AKT S473) on F4/80+ isolated peritoneal macrophages from RICTOR-WT and RICTOR-KOMac was measured by immunoblot. (F) Representative flow plot of macrophages from RICTOR-WT and RICTOR-KOMac stained with F4/80 and CD11b. ResMφ were defined as CD11b+F4/80hi. Data are compilation of three independent experiments (A–B) or representative of at least three independent experiments (C–F) *P < 0.05, **P < 0.01, t tests.
To examine the role of mTORC2 in peritoneal ResMφ, we generated mice specifically deficient for Rictor, a critical component of mTORC2, in myeloid cell lineages (RICTOR-KOMac) by breeding Rictorfl/fl mice with Lysozyme M (LysM2) Cre-recombinase mice. RICTOR deletion was confirmed in ResMφ from peritoneal cavity, liver, lung, spleen, and brain. (Figure 1E and S1B). Peritoneal macrophages from RICTOR-KOMac mice demonstrated reduced AKT phosphorylation (Ser473), indicative of decreased mTORC2 activity. In contrast, phosphorylation of S6 (Ser240/244) and 4E-BP1 (Thr37/46) (which is downstream of mTORC1) remained intact (Figure 1E). Flow cytometric analysis of peritoneal exudate cells from RICTOR-KOMac mice compared with wild type littermate controls (RICTOR-WT) revealed significantly increased percentages of CD11b+F4/80hi ResMφ (WT: 75.4 ± 2.6 % vs. KO: 84.4 ± 3.8 %, Mean±SD, *p=0.0159) (Figure 1F). These data suggest that while mTORC2 activity is decreased in ResMφ from WT mice, the absence of mTORC2 activity promotes the generation of ResMφ.
mTORC2 deficiency promotes IL-4c-driven tissue-resident peritoneal macrophage generation
To determine whether mTORC2 selectively regulates peritoneal ResMφ, we used the IL-4c model to enrich for ResMφ in vivo. WT and RICTOR-KOMac mice were injected with a mixture of IL-4c on days 0 and 2 and analyzed on day 4. As expected, flow cytometry analysis of elicited macrophages from peritoneal cavity showed that IL-4c induced an accumulation of macrophages expressing CD11b and a high level of F4/80, indicative of ResMφ (Figure 2A). Notably, increased percentages and absolute numbers of CD11b+F4/80hi cells were observed in IL-4c treated RICTOR-KOMac mice compared to WT mice (Figure 2B and C). A similar observation was noted when we analyzed the expression of other peritoneal ResMφ markers such as TIM4 (T cell immunoglobulin mucin proteins 4) (Rosas et al., 2014) and ICAM2 (Intercellular adhesion molecule 2) (Gautier et al., 2014) (Figure 2D and E). Notably, RICTOR-KOMac mice were capable of inducing similar numbers of thioglycollate-induced macrophages (Figure S2).
Figure 2. mTORC2 deficiency increases IL-4c tissue-resident peritoneal macrophages via proliferation and cell survival.

RICTOR-WT and RICTOR-KOMac were treated with IL-4c on days 0 and 2. The phenotype of cells from the peritoneal cavity was analyzed by flow cytometry on day 4. (A) Representative flow plot of CD11b and F4/80 and (B) percentages and (C) numbers of CD11b+F4/80hi (N=11/group). (D and E) Representative flow histogram plot and percentages of ResMφ markers (TIM4 and ICAM2) expression gated from CD11b+ population (N=11–12/group). (F) Percentages of proliferation marker Ki-67 gated from CD11b+ population. (G) Percentages of cell death by Annexin V staining on CD11b+TIM4−F4/80lo (MoMφ) and CD11b+TIM4+F4/80hi (ResMφ) Data are compilation of two independent experiments (A–E) or representative of at least three independent experiments (F–G). *P < 0.05, **P < 0.01, Mann-Whitney t tests.
One of the distinct characteristics of ResMφ is self-renewal via proliferation. Thus, we questioned whether an increase in ResMφ is the result of expansion by proliferation or enhanced survival. Indeed, we observed an increase in the Ki-67+ ResMφ in the RICTOR-KOMac mice compared to WT mice (Figure 2F). In addition, RICTOR-KOMac had fewer apoptotic ResMφ as determined by staining with annexin V (Figure 2G). There was no significant difference in Ki-67+ and annexinV+ MoMφ between WT and RICTOR-KOMac mice. Collectively, these results suggest that mTORC2 deficiency enhances the generation of tissue-resident peritoneal cells through increased proliferation and cell survival.
IL-4c induced peritoneal resident macrophages in RICTOR deficient mice are distinct from traditional alternatively activated macrophages
As IL-4 induces both ResMφ and M2 macrophages, we next explored whether the increased ResMφ in IL-4c injected mTORC2 deficient mice were in fact M2 macrophages. This is an important question, as early studies by the Allen group (Jenkins et al., 2011) showed that IL-4 triggers not only proliferation of macrophages but also M2 activation. It has since been suggested that even though these cells expressed Arg1, Chi13 and Relmα, they were not traditional M2 but resident macrophages (Gundra et al., 2014).
Recently published papers (Hallowell et al., 2017; Huang et al., 2016) show a role for mTORC2 signaling in promoting M2 generation. Consistent with these findings, reduced CD206 expression was observed in BMDM from RICTOR-KOMac under M2 polarizing conditions as compared to WT (Figure 3A). That is, consistent with published findings, deletion of mTORC2 inhibits M2 macrophage differentiation.
Figure 3. mTORC2 activity differentially regulate IL-4c driven alternatively activated macrophages and tissue-resident macrophages.

(A) BMDM from RICTOR-WT and RICTOR-KOMac mice and were cultured with 10ng/mL IL-4 for 18hrs. CD206 was measured by flow cytometry. (B–D) Peritoneal exudate cells were collected from IL-4c treated RICTOR-WT and RICTOR-KOMac mice. (B) Percentages of CD206+ cells from CD11b+ population (N=5/group). (C) Representative flow analysis of TIM4 and CD206 expression on CD11b+ population. Percentages are shown in upper right corner. (D) Flow analysis of CD206+ cells among ResMφ (CD11b+TIM4+F4/80hi). (E) Gene-set enrichment analysis from RNA sequencing on RICTOR-WT and RICTOR-KOMac peritoneal ResMφ (CD11b+TIM4+ F4/80hi) (2–3 mice pooled N=3). Presented as enrichment for selected pathways among genes previously upregulated (top) or downregulated (bottom) from BMDM control vs. IL-4 gene set (GSE25088). Data are representative of at least three independent experiments. *P < 0.05, Mann-Whitney t tests.
Next, we examined the M2 marker CD206 in IL-4c driven peritoneal macrophages. Flow analysis showed decreased CD206 expression in CD11b+ cells from IL-4c-RICTOR-KOMac mice (Figure 3B). However, when we analyzed CD206 expression from two subpopulations defined by their expression of the tissue-resident marker TIM4, the majority of TIM4− cells (which represent MoMφ) expressed CD206 whereas TIM4+ cells (which represent ResMφ) did not (Figure 3C). That is, while Rictor deficiency inhibits M2 macrophage differentiation, it did not lead to a decrease in this “traditional” M2 marker on ResMφ (Figure 3D).
To comprehensively investigate the mechanisms of M2 vs. ResMφ programming, we performed RNA sequencing on ResMφ from IL-4c treated WT and RICTOR-KOMac mice. Gene-set enrichment analysis revealed that there are no distinct distributions of genes, up or down regulated in M2 activation from BMDM, between WT and RICTOR-KOMac ResMφ (Figure 3E, Genes from GSE25088, (Szanto et al., 2010)). Thus, although ResMφ share some of the same markers with M2 macrophages, Rictor deficiency leads to decreased M2 macrophage generation and increased ResMφ generation. Thus, our findings demonstrate the distinct and differential ability of mTORC2 to enhance M2 differentiation and inhibit ResMφ generation.
mTORC2 deficiency enhances the phagocytic ability of peritoneal tissue-resident macrophages and increases peritoneal resident macrophage proliferation during the resolution phase of zymosan induced peritonitis
Next, we sought to determine whether decreased mTORC2 activity was important for increasing the function of ResMφ. Previously it had been shown that TIM4+ ResMφ have enhanced phagocytic ability when compared to thioglycollate-elicited MoMφ (Uderhardt et al., 2012). Thus, we sought to interrogate phagocytosis in ResMφ derived from WT and RICTOR-KOMac mice. To this end, peritoneal macrophages from exudates of untreated WT and RICTOR- KOMac mice were treated with the fungal product zymosan labeled with a pH-sensitive dye (pHrodo-fluorescence). With increasing time of incubation with the zymosan, ResMφ from the RICTOR-KOMac mice displayed markedly enhanced phagocytosis (Figure 4A). However, there was no difference in phagocytosis between WT and RICTOR-KOMac peritoneal MoMφ (Figure 4A). Thus, not only does the deletion of mTORC2 activity increase the generation of resident tissue macrophages but it also enhances their functionality.
Figure 4. mTORC2 deficiency enhances phagocytosis and promotes tissue-resident macrophages during resolution phase in zymosan induced peritonitis.

(A) Peritoneal exudate cells (1 × 10⁵) from naïve RICTOR-WT and RICTOR-KOMac were incubated with pH sensitive dye (pHrodo fluorescence) labeled zymosan bioparticles for indicated time. At each time point, cells were fixed and stained, then analyzed by flow cytometry. MFI of pHrodo+ ResMφ (CD11b+TIM4+F4/80hi) (Left) and MoMφ (CD11b+TIM4−F4/80lo) data (Right) (N=5/group). (B–G) RICTOR-WT and RICTOR-KOMac were injected IP with Zymosan A (0.1mg/mouse). After indicated time, peritoneal exudate cells were harvested and phenotypes were analyzed via flow cytometry. (B) Numbers of ResMφ (CD11b+TIM4+F4/80hi) and MoMφ (CD11b+TIM4−F4/80lo) after zymosan injection. (C) Percentage of TIM4+ cells and (D) ICAM2+ cells from CD11b+ population at 48hrs. (E) Representative flow plot of TIM4 and F4/80 expression from CD11b+ population at 20 and 144hrs. (F) Representative flow plot of Ki67 and TIM4 expression from CD11b+ population after 144hrs, and statistical analysis of Ki67+ cells from ResMφ (CD11b+TIM4+F4/80hi) and MoMφ (CD11b+TIM4−F4/80lo) (G) Representative histogram plot of active caspase 3 after 144hrs and analysis of active caspase 3 based on MFI from ResMφ (CD11b+TIM4+F4/80hi) and MoMφ (CD11b+TIM4−F4/80lo). Data are representative of at least three independent experiments. Mean±SD, N=3–5, Statistical significance were determined by two-way ANOVA with Bonferroni post-test, **p< 0.01, ****P < 0.0001
We next sought to determine if deletion of mTORC2 also promoted an increase in peritoneal ResMφ in response to zymosan in vivo (Rosas et al., 2014; Stables et al., 2011). WT and RICTOR-KOMac mice received an intraperitoneal (IP) injection of zymosan particles. After 6, 20, 48 and 144 hours, peritoneal cells were harvested and analyzed by flow cytometry. At 6 hours, CD11b+Tim4+F4/80hi (ResMφ) were remarkably reduced in both WT and RICTOR-KOMac (Figure 4B). After 48 and 144 hours, zymosan induced peritonitis led to significant increase of ResMφ percentages and numbers in RICTOR-KOMac mice compared with WT Consistent with our previous findings in the IL-4c model (Figure 4B–E). However, MoMφ numbers were not significantly different between WT and RICTOR-KOMac mice during the course of peritonitis (Figure 4B).
Similar to the IL-4c model shown in Figure 2F, ResMφ derived from the RICTOR-KOMac mice demonstrated increased proliferation 144 hours after zymosan injection (Figure 4F). Also they demonstrated reduced apoptosis after 6, 20, and 144 hours when compared to the macrophages derived from the WT mice (Figure 4G). Overall, these findings demonstrate a role for mTORC2 in regulating the generation of ResMφ during the resolution phase of the response to a pathogen.
mTORC2 signaling is a negative regulator of GATA6 expression in tissue-resident peritoneal macrophages
GATA6 acts as an essential transcription factor promoting the generation of ResMφ (Gautier et al., 2014; Okabe and Medzhitov, 2014; Rosas et al., 2014). Notably, mice in which GATA6 has been selectively deleted in macrophages demonstrate impaired ResMφ proliferation, cell survival and localization, resulting in a decreased ResMφ. In as much as RICTOR-KOMac mice demonstrate increased generation of ResMφ, we hypothesized that mTORC2 signaling was playing an important role in regulating GATA6 expression. To this end, FACS analysis of freshly isolated peritoneal CD11b+ cells from naïve RICTOR-KOMac mice demonstrated higher frequencies of GATA6+ cells compared to littermate controls (Figure 5A). In addition to homeostatic conditions, we also observed an up-regulation of GATA6 on CD11b+ cells from IL-4c treated RICTOR-KOMac mice (Figure 5B). To confirm these findings, we also examined the peritoneal exudate cells from naïve WT and KO mice by microscopy. Consistent with the FACS data, we observed increased GATA6 expression in peritoneal macrophages isolated from the KO mice when compared with the WT mice (Figure 5C). Accordingly, increased GATA6+ ResMφ in RICTOR-KOMac mice were observed during the resolution phase of zymosan induced peritonitis (Figure 5D and E).
Figure 5. mTORC2 is a negative regulator of GATA6.

Representative flow histogram plot of GATA6 expression of CD11b+ cells (A) from peritoneal cells of naïve RICTOR-WT and RICTOR-KOMac and (B) from IL-4c injected WT and RICTOR-KOMac mice. (C) Peritoneal exudate cells from naïve RICTOR-WT and RICTOR-KOMac were stained with GATA6 (green). Nucleus was stained with DAPI (blue). Representative images are shown (Left) and GATA6 positive cells per high power field (HPF) were determined by counting (Right) (100x magnification, scale bar=10μm). (D–E) Same as figure 4B–E (in vivo Zymosan A) (D) Percentages of GATA6+ cells from CD11b+ population after 48hrs zymosan induced peritonitis. (E) Representative flow plot of TIM4 and GATA6 expression from CD11b+ population after 144hrs zymosan induced peritonitis. Percentages of GATA6+ ResMφ (CD11b+TIM4+F4/80hi) at each time point are shown (N=3–4/group). (F) After 3hr incubation, attached cells from naïve WT and RICTOR-KOMac mice were incubated with recombinant IL-4 (10ng/ml) and collected at indicated time points. Total RNA was extracted and relative expression of GATA6 was determined by q-PCR. Data are representative of at least three independent experiments. Statistical significance of (C–D) were determined by Mann-Whitney t tests and (E–F) were determined by two-way ANOVA with Bonferroni post-test (Mean±SD, N=3). *P < 0.05, **P < 0.01, ***P < 0.001, ****P < 0.0001
It has previously been shown that IL-4 can enhance GATA6 expression at the level of transcription in human umbilical vein endothelial cells (Sharma et al., 2015). Therefore, we hypothesized that mTORC2 signaling was also regulating the expression of GATA6 at the level of mRNA. Consistent with this hypothesis we observed increased levels of GATA6 mRNA expression in RICTOR-KOMac ResMφ (Figure 5F). Furthermore, the addition of IL-4 in vitro increased GATA6 expression at the level of mRNA in the Rictor null macrophages when compared to the WT macrophages (Figure 5F). Overall these data highlight the importance of mTORC2 in regulating the generation of GATA6+ ResMφ.
mTORC2 regulates GATA6 expression by controlling FOXO1 activation
Next, we wanted to determine the mechanism by which mTORC2 signaling might regulate GATA6 expression and subsequent generation of ResMφ. It has been shown that mTORC2 signaling can regulate the generation of memory T cells in part by its ability to regulate FOXO1-mediated transcription (Pollizzi et al., 2015; Zhang et al., 2016). When FOXO1 is phosphorylated it is excluded from the nucleus and thus is inactive. FOXO1 phosphorylation is mTORC2 dependent and consequently inhibition of mTORC2 activity leads to enhanced FOXO1-mediated transcription. Therefore, we hypothesized that GATA6-mediated ResMφ differentiation might be controlled in part by FOXO1.
To test this hypothesis, p-FOXO1 was assessed in MoMφ and ResMφ. First, consistent with our previous findings, GATA6 expression was increased in the IL-4c elicited macrophages when compared to the thioglycollate elicited macrophages (Figure 6A). Second, consistent with the data in Figure 1A for MoMφ, thioglycollate-elicited macrophages have increased mTORC2 activity (as measured by p-AKT Ser 473) when compared to the IL-4c-elicited cells (Figure 6B). However, we found that there was a markedly diminished level of FOXO1 in these cells as well. This pattern was also noted in sorted CD11b+F4/80lo MoMφ and CD11b+F4/80hi ResMφ from unmanipulated mice (Figure S3A). Thus, the inhibition of FOXO1 mediated transcription in thioglycollate-elicited macrophages is not only enforced by FOXO1 phosphorylation but also by diminished levels of FOXO1 protein expression.
Figure 6. Enhanced FOXO1 activation by mTORC2 deficiency promotes the generation of peritoneal tissue-resident macrophages by regulating GATA6 expression.

(A) Representative flow histogram plot of GATA6 expression from thiglycollate-elicited macrophages and IL-4c-driven macrophages from WT mice. (B) Expression of p-AKT (S473), AKT1 and FOXO1 from thiglycollate-elicited and IL-4c-driven macrophages from WT mice and (C) RICTOR, p-AKT(S473), AKT1, p-FOXO1(Thr24)/FoxO3a(Thr32) and FOXO1 from IL-4c treated RICTOR-WT and RICTOR-KOMac were assessed by immunoblot. (D) After 3hrs incubation, immunofluorescence staining was performed on attached cell from (C) using anti-CD11b (red) and anti-FOXO1 (green) antibodies. Nucleus was stained with DAPI (blue) (400x magnification, scale bar=5μm). (E) Three predicted FOXO1 binding sites on GATA6. ChIP assay was performed using peritoneal exudate cells of thioglycollate or IL-4c treated WT mice (on day 3). Enrichment of FOXO1 at the promoter region of GATA6 was shown using real-time PCR. 2% input was used to calculate immunoprecipitation. (F) Thioglycollate or IL-4c elicited macrophages were treated with 1μM AS1842856 (FOXO inhibitor) or with IL-4 for 6hrs, and GATA6 was assessed using qPCR. (G) IL-4c elicited macrophages were treated with 1μM AS1842856 (FOXO inhibitor) or 1μM AKT inhibitor VIII for 18hrs, and GATA6 expression assessed using flow cytometry and GATA6 and mTORC2 activity were assessed using immunoblot. (H) IL-4c treated mice were injected IP with 10mg/kg LPS 4 hrs before harvest, and peritoneal exudate cells were assessed by flow cytometry. Sorted ResMφ were assessed via immunoblot. (I–J) IL-4c elicited macrophages from RICTOR-WT and RICTOR-KOMac mice were treated in vitro with 100ng/mL LPS or 10ng/mL IL-4, (I) FOXO1 nuclear localization was assessed after 2hrs by immunofluorescence staining. (J) GATA6 expression assessed using flow cytometry after 18hrs. Data are representative of at least three independent experiments. **P < 0.01, ****P < 0.0001 Mann-Whitney t tests.
Having demonstrated increased GATA6 and FOXO1 expression and decreased mTORC2 activity (assessed by p-AKT at Ser 473, Figure 1B and 6B) in IL-4c elicited macrophages, next we examined mTORC2 dependent FOXO1 phosphorylation (Tzivion et al., 2011) from IL-4c treated WT and RICTOR-KOMac mice. Consistent with reduced mTORC2 activity, decreased p-FOXO1 at Thr 24 was observed in peritoneal macrophages from IL-4c treated RICTOR-KOMac mice when compared to the IL-4c treated WT mice (Figure 6C). These observations suggest that mTORC2 regulates FOXO1 phosphorylation in ResMφ. Along these lines, we wanted to know whether this decreased p-FOXO1 would consequently result in the retention of FOXO1 in the nucleus of RICTOR-KOMac ResMφ. By microscopy, we confirmed increased localization of FOXO1 in the nucleus in IL-4c treated RICTOR-KOMac mice compared to the WT mice (Figure 6D).
Based on these findings we next sought to determine whether GATA6 might be a FOXO1 target gene. In silico analysis (SABiosciences database) revealed 3 putative FOXO1 binding sites of the GATA6 promoter. Using this analysis, we designed PCR primers adjacent to this region (Chr18: 11057768) in order to perform ChIP analysis on extracts derived from thioglycollate elicited and IL-4c-elicited macrophages. We observed enhanced enrichment of FOXO1 at the promoter region of GATA6 in extracts from IL-4c elicited peritoneal macrophages compared to thioglycollate-elicted macrophages (Figure 6E). Additionally, inhibition of the transcriptional activity of FOXO1 by AS1842856 diminished both GATA6 transcription and protein expression, and inhibited further enhancement of GATA6 transcripts by in vitro IL-4 (Figure 6F and G). In contrast, inhibition of AKT by AKT inhibitor VIII in vitro reduced p-FOXO1 (Figure 6G), increased nuclear localization of FOXO1 (Figure S3B), and sequentially enhanced GATA6 expression in IL-4c-elicited macrophages (Figure 6G). Thus, mTORC2 controlled FOXO1 activity is important in the generation and maintenance of GATA6.
As genomic signatures of ResMφ are related to the tissue environment, we hypothesized that inflammatory stimuli can affect mTORC2 activity and result in GATA6 expression change. To mimic an inflammatory microenvironment in the peritoneal cavity, WT mice treated with IL-4c were injected IP with LPS 4 hours before harvest. Immunoblotting on sorted ResMφ showed that LPS triggers increased phosphorylation of FOXO1/3 by enhanced mTORC2 activity, and reduced total FOXO1 expression (Figure 6H). As a result, decreased ResMφ was observed in LPS injected IL-4c treated mice when compared to IL-4c treated mice. Accordingly, reduced GATA6 expression was observed in LPS treated ResMφ (Figure 6H). Similarly, IL-4c elicited macrophages exposed in vitro to LPS or zymosan had increased mTORC2 activity which led to decreased FOXO1 nuclear localization and GATA6 expression (Figure 6I, S3B-D). LPS stimulation of IL-4c treated RICTOR deficient macrophages abrogates this decrease in GATA6 expression, thus illustrating that mTORC2 activity is critical for the modulation of GATA6 expression (Figure 6I and 6J).
Taken together these data support the model whereby mTORC2 signaling regulates the generation of ResMφ differentiation and function in part by regulating the ability of FOXO1 to enhance GATA6 expression.
mTORC2 regulates metabolism in tissue-resident macrophages
Thus far, we observed mTORC2 signaling regulates the generation of ResMφ differentiation through GATA6 transcriptional programming. To further understand the role of mTORC2 signaling in ResMφ, we performed RNA sequencing in IL-4c treated WT and RICTOR deficient macrophages. Not surprisingly when comparing WT and RICTOR deficient ResMφ, many of the genes were similarly regulated (Figure S4A). This tells us that blocking mTORC2 activity leads to the increased generation of ResMφ that share the expression signature of bona fide ResMφ. Pathway analysis revealed enrichment of genes associated with the cell cycle in the RICTOR deficient ResMφ (Figure S4B), consistent with the findings demonstrating increased proliferation of the ResMφ in the RICTOR-KOMac mice (Figure 2F and 4F).
Interestingly, by analyzing the RNA sequencing data using pathway analysis for biological processes, we found that metabolism associated genes are significantly different between IL-4c elicited WT and RICTOR deficient ResMφ (Figure 7A). Specifically, we found enrichment of genes associated with the TCA cycle in RICTOR deficient ResMφ compared to WT ResMφ (Figure S4B). When we applied this analysis to the WT cells, we also saw the same trend showing increased TCA cycle (and cell cycle) associated genes in WT ResMφ when compared to WT MoMφ (Figure S4B).
Figure 7. mTORC2 regulates metabolic reprogramming in tissue-resident macrophages.

(A) RNA sequencing on RICTOR-WT and RICTOR-KOMac ResMφ (CD11b+TIM4+F4/80hi) (2–3 mice pooled N=3). Presented as enrichment for selected pathways among significant changes of particular group of genes, in context of Gene Ontology (GO) biological process. The enrichment was performed with a cut off FDR (false discovery rate) <0.05, and pathway with more than 50 gene counts were presented. (B–D) Sorted peritoneal MoMφ (CD11b+TIM4−F4/80lo) and ResMφ (CD11b+TIM4+F4/80hi) were subjected to extracellular metabolic analyzer and staining with mitotracker. (B) Plots of the extracellular oxygen consumption rate (OCR). Rot/AA: rotenone and antimycin A. (C) Summary of basal OCR, extracellular acidification rate (ECAR), OCR/ECAR ratio, and spare respiratory capacity (SRC). (D) Representative IF for mitotracker deep red dye staining with statistical analysis. (E) Mitotracker dye staining with statistical analysis from sorted peritoneal ResMφ (CD11b+TIM4+F4/80hi) from naive RICTOR-WT and RICTOR-KOMac (F) and on sorted (left) or gated (right) alveolar macrophages (CD11c+CD11b−SiglecF+) and monocyte-derived cells (CD11b+SiglecF−CD11c−) from naïve WT mice. (G) Flow plot of CD11b and F4/80 for gating strategy of ResMφ and monocyte-derived cells from liver, spleen, skin, peritoneal macrophage (PMAC), and lung. Alveolar macrophages were gated from CD11c+siglecF+ plot. Representative plot of FOXO1 staining from ResMφ and monocyte-derived cells with statistical analysis. MFI is shown in the upper right corner. (n=3) Data are representative of at least three independent experiments. *P < 0.05, ***P < 0.001, ****P < 0.0001 Mann-Whitney t tests.
Based on these expression data, we performed functional metabolic analysis on sorted ResMφ vs. MoMφ in naïve WT mice. ResMφω displayed increased oxidative phosphorylation (assessed with oxygen consumption rate (OCR) and spare respiratory capacity (SRC)) and decreased glycolysis (assessed by extracellular acidification rate (ECAR), and OCR/ECAR ratio) using extracellular flux analysis as compared to MoMφ in agreement with RNA sequencing data (Figure 7B and C). Likewise, increased mitochondrial mass was observed in peritoneal ResMφ when compared to MoMφ (Figure 7D). Similarly, sorted RICTOR deficient ResMφ showed higher mitochondria dye staining compared to WT ResMφ (Figure 7E). Thus, these data suggest that mTORC2 is important in the metabolic reprogramming of ResMφ.
Analysis of data from The Immunological Genome Project revealed that alveolar macrophages (ResMφ in lung CD11c+SiglecF+CD11b-) have increased expression of TCA cycle related genes compared to monocyte-derived cells (CD11bhiCD11c+/−) (Figure S4C). Accordingly, CD11bloSiglecF+CD11c+ alveolar macrophages displayed higher mitochondrial mass compared to CD11b+SiglecF-CD11c- monocyte-derived cells. (Figure 7F). Next, we interrogated FOXO1 levels in other tissue ResMφ to determine whether we can exploit our observations regarding mTORC2 activity in other tissues as well. As was the case for peritoneal ResMφ, we observed higher FOXO1 expression in other ResMφ (spleen, lung, skin and liver) by flow cytometry when compared to monocyte-derived cells within the same organ (Figure 7G). These findings suggest that mTORC2-FOXO1 may play a role in the generation of other tissue ResMφ as well.
Discussion
Recently, a series of papers has demonstrated the central role of GATA6 as a transcription factor that uniquely controls differentiation of peritoneal ResMφ by employing GATA6 knock-out mice (Gautier et al., 2014; Okabe and Medzhitov, 2014; Rosas et al., 2014). Based on this work, GATA6 helps to define peritoneal ResMφ in this compartment that differentiate in response to environmental cues (Wang and Kubes, 2016). Despite this important finding, it remains unclear how GATA6 is selectively regulated. In this study, we examined the role of mTOR activity in peritoneal ResMφ. Notably, we observed lower mTORC2 activity in ResMφ compared to MoMφ in the peritoneal cavity (Figure 1A and B). Using macrophage specific mTORC2 deficient mice, an IL-4 complex model and zymosan induced peritonitis model, we demonstrate that mTORC2 is a selective negative regulator of peritoneal ResMφ. That is, by inhibiting mTORC2 activity we observed an increase in the peritoneal ResMφ, defined by TIM4, ICAM2, and GATA6, as well as an increase in mitochondrial mass and function (Figure 2 and 7).
Our studies examine the role of mTORC2 activity in phagocytosis, one of the main functions of macrophages. Previously, several studies have reported that rapamycin or mTORC1 deficiency inhibits phagocytosis (Fox et al., 2007; Thomson et al., 2009). The TIM4+ population has been shown to play an important role in both ResMφ (Rosas et al., 2014) and “resolution promoting” macrophages in zymosan induced peritonitis (Davies et al., 2011; Stables et al., 2011). To this end, we observed that mTORC2 activity inhibited these functions. That is, not only did blocking mTORC2 activity promote the generation of ResMφ, but the mTORC2 deficient cells demonstrated increased functionality in terms of enhanced phagocytosis and increased resolution of peritonitis (Figure 4 and 5).
Mechanistically, our data support the ability of mTORC2 activity to regulate GATA6 expression via controlling FOXO1. FOXO1 is a transcription factor involved in the regulation of metabolism, the cell cycle, and apoptosis in order to maintain homeostasis in response to metabolic or oxidative stress (Eijkelenboom and Burgering, 2013). mTORC2 activity leads to the phosphorylation and nuclear exclusion of FOXO1. Thus our data are consistent with a mechanism whereby decreased mTORC2 signaling promotes FOXO1 activation and subsequent GATA6 transcription. A recent study have reported on population of TIM4- long-lived self-renewing bone marrow-derived macrophages that can replace embryo-derived cells (Bain et al., 2016). Interestingly, we also found increased GATA6 expression (MFI) on TIM4- MoMφ from RICTOR deficient mice compared to WT mice (Figure 5E).
However, somewhat unexpectedly, we also observed that total FOXO1 protein expression was markedly diminished in thioglycollate-elicited macrophages and resting MoMφ. To this end, the decreased binding of FOXO1 at the GATA6 promoter in these cells is due to not only increased cytoplasmic retention but also simply the fact that the overall expression of FOXO1 levels in these cells is markedly diminished (Figure 6E). While the precise mechanism accounting for diminished FOXO1 in MoMφ is unclear, it has been previously shown that phosphorylation, acetylation and ubiquitination of FOXO1 can lead to its degradation (Eijkelenboom and Burgering, 2013; Tzivion et al., 2011). Interestingly, this phenomenon was not unique to peritoneal macrophages. Other tissue ResMφ (liver, alveolar macrophages, spleen and skin) showed higher FOXO1 expression as well (Figure 7G). This suggests that the mTORC2-FOXO1 axis may play a role in the generation and function of other tissue ResMφ as well. A caveat of this finding, however, lies in determining the most appropriate cells with which to make this comparison. In our paper, we defined ResMφ and monocyte-derived cells based on CD11b and F4/80 expression. For alveolar macrophages, we also included additional markers, CD11c and Siglec F. Thus, some other monocyte-derived cells may be contained within our gate including undifferentiated monocytes, dendritic cells, and interstitial macrophages. However, unlike in peritoneal macrophages, there are no precise markers to delineate monocytic macrophages in diverse tissues. Notably, while the literature agrees that alveolar macrophages are ResMφ, the origin of interstitial macrophages is still unlcear (Hoffmann et al., 2016). Nonethless, importantly all these migrated cells indeed have lower FOXO1 compared to ResMφ. Thus, our data suggest that the role of this mTORC2-FOXO1 pathway warrant further exploration. Specifically, when we treated mice with IL-4c we not only found an increase in peritoneal ResMφ but also increased ResMφ in the spleen; this was further increased in the RICTOR deficient mice (data not shown).
Macrophages exposed in vitro to LPS/IFN3 or IL-4 readily differentiate to M1 or M2 macrophages, respectively. However, precise differentiation and plasticity in vivo to multiple stimuli is unknown (Glass and Natoli, 2015). Peritoneal ResMφ are characterized by their ability to proliferate in response to IL-4c (Jenkins et al., 2011; Jenkins et al., 2013; Ruckerl et al., 2012). As a result, initial studies examining the role of IL-4c-induced proliferation in vivo defined these cells as being M2 macrophages (Byles et al., 2013; Huang et al., 2014). By examining the role of mTORC2 activity on peritoneal ResMφ, we have been able to clearly distinguish between M2 and ResMφ, which are both induced by IL-4. We observed that CD206 was selectively expressed in Il-4c driven MoMφ (TIM4−) but not on Il-4c driven ResMφ (TIM4+). While both subsets showed high levels of Arg1, Chitinase 3-like 3, and Relmα compared to thioglycollate induced macrophages (data not shown), IL-4c driven TIM4+ ResMφ were generally CD206 negative (Figure 3C). These observations are consistent with previous transcriptional profiling data that distinguished alternatively activated monocyte-derived cells and IL-4c driven tissue-resident macrophages (Gundra et al., 2014). Thus, the ability of mTORC2 signaling to help define the distinction between these two macrophage cell types is highlighted by the observation that while mTORC2 inhibition promotes tissue-resident peritoneal macrophage proliferation, differentiation and function, mTORC2 deficiency actually leads to a decrease in M2 differentiation (Figure 2 and 3) (Hallowell et al., 2017; Huang et al., 2016). Mechanistically, these differences may relate to the proposed role of IRF4 (Huang et al., 2016) and SOCS1/5 (Hallowell et al., 2017) in the regulation of M2 macrophages.
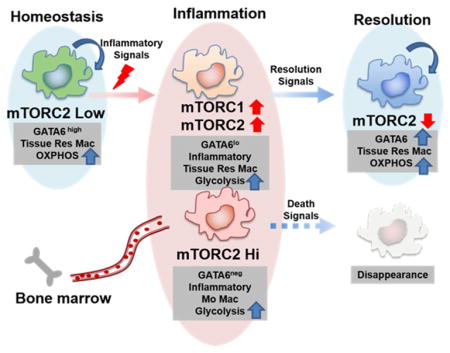
In summary, we demonstrate a critical role for mTORC2 signaling in regulating the proliferation, differentiation, metabolic reprogramming and function of peritoneal ResMφ. Our data provides a link between signaling induced by environmental cues and GATA6-mediated differentiation programs. Furthermore, our studies provide a signaling signature that helps to distinguish ResMφ from alternatively activated macrophages. Finally, our data implicate a potential role for mTORC2 in broadly regulating resident macrophages in diverse tissues.
Experimental Procedures
Animal
C57BL/6, LysM2 (expressing Cre recombinase from the LysM promoter) and RICTOR fl/fl mice (loxP-flanked Rictor alleles) were purchased from Jackson Laboratories. To obtain myeloid cell lineages specific Rictor deficient mice, LysM2 Cre recombinase mice were bred to Rictorfl/fl mice. Age (6–8wks old) and gender (male or female) matched LysM Cre+ mice were used as a WT control. All animal protocols were approved by the Institutional Animal Care and Use Committee of Johns Hopkins University (Baltimore, MD).
Thioglycollate and IL-4c mouse model
Mice were injected intraperitoneally (IP) with 2mL of 3% thioglycollate broth (Sigma-Aldrich) or injected IP with recombinant IL-4 (5μg, Peprotech) and anti-IL-4 ab (12.5μg, Clone 11B11, BioXcell) in a total volume of 100μl PBS on days 0 and 2. Then 3 or 4 days later, peritoneal exudates cells were obtained from peritoneal lavage and analyzed. To create an inflammatory microenvironment, mice were injected IP with 10mg/kg LPS (Sigma-Aldrich).
Flow cytometry and sorting
Peritoneal exudate cells (0.5 × 10⁶) were stained with antibodies after Fc blocking (BD bioscience). Antibodies were purchased from Biolegend: anti-CD206 (C068C2) anti-CD45(30-F11) eBioscience: anti-ICAM2 (3C4 (mIC2/4)), anti-TIM4 (54 (RMT4–54)), anti-F4/80 (BM8), anti-Ki-67 (SolA15), anti-CD11b (M1/70) Cell Signaling: anti-GATA6 (D61E4), anti- FOXO1(C29H4) Thermo Fisher Scientific: LIVE/DEAD® Fixable Near-IR Dead Cell Stain Kit. Anti-SiglecF (E50-2440), anti-CD11c (HL3), active caspase 3 and annexin V were also purchased from BD Biosciences, and staining were followed manufacturer’s protocol. Intracellular staining was performed after using Fixation and Permeabilization Buffer Set (eBioscience). For GATA6 and FOXO1 staining, after using fixation/permeabilization, cells were incubated with unconjugated antibody at RT for 30min and Alexa Fluor®488 or 647 conjugated anti-rabbit secondary antibodies were used at RT for 20min. After washing, cells were acquired using BD FACSCalibur or BD FACSCelesta, and data were analyzed using FlowJo (Tree Star). Resident macrophages (Tim4+CD11b+F4/80hi) and monocyte-derived macrophages (Tim4-CD11b+F4/80lo) were stained and obtained after sorting using FACSAria II. IL-4c elicited macrophages were treated in vitro with 1μM AKT inhibitor VIII (Calbiochem), 1μM AS184285 (Calbiochem), 100ng/mL LPS or 50μg/mL Zymosan for 18hrs. The attached cells were collected with cell dissociation reagent (Corning) and accessed by flow cytometry.
Immunoblotting
After 3hr incubation on plate, or isolation of F4/80+ cells using biotinylated anti-F4/80 (ebioscience) antibody with MojoSort™ Streptavidin Nanobeads (Biolegend), or after sorting, cells were washed twice with PBS, then peritoneal exudate cells (3 × 10⁶) were lysed in RIPA buffer with NaF, protease inhibitor cocktail (Roche), PMSF, sodium pyrophosphate, beta glycerophosphate and sodium orthovanadate (Sigma Aldrich). Immunoblot was performed using a standard protocol (Life Technologies). The following antibodies were used from Cell Signaling: anti-p-AKT (S473, D9E or D7F10), anti-AKT1 (C73H10), anti-p-S6(Ser240/244, D68F8), anti-S6(5G10), anti-p-4E-BP1(T37/46, 236B4), anti-4E-BP1(53H11), anti-p-FOXO1(Thr24)/FOXO3a(Thr32), FOXO1(C29H4) and anti-β-actin (D6A8), Sigma-Aldrich: anti-actin. All images were captured and analyzed using UVP BioSpectrum 500 Imaging System.
Real-time PCR
Attached peritoneal exudate cells (0.5 × 10⁶) were incubated with/without recombinant IL-4 (10ng/mL) or with/without 1μM FOXO inhibitor AS184285 (Calbiochem) and collected at indicated time points. Total RNA was extracted with Trizol (Life Technologies) and was converted to cDNA using the ProtoScript II RT (New England BioLabs). Predesigned TaqMan® Assays were purchased from Applied Biosystems: Gata6 (Mm00802636_m1). qPCR was performed using Eagle Taq Universal Master Mix (Roche) and Applied Biosystems StepOnePlus 96-well Real-Time PCR. Ct values were normalized to 18S ribosomal RNA (Life Technologies) and relative quantification of gene expression ratio was shown in comparison to control.
Immunofluorescence/mitochondrial staining
Attached and 1% PFA fixed peritoneal exudate cells on slides were blocked with 10% donkey serum for 1hr at RT and incubated with primary antibodies at 4°C overnight. After washing, Alexa Fluor®488 conjugated donkey anti-rabbit secondary antibody was applied to slide at RT for 1hr. To mount cells and stain nucleus, SlowFade Gold Antifade Mountant with DAPI (Life Technologies) was applied to slide. For mitochondrial staining, after sorting, 50nM MitoTracker DeepRed (ThermoFisher) was applied and incubated for 30min at 37°C. Then, cells were fixed with 1% PFA and mounted with SlowFade Gold Antifade Mountant with DAPI. Images were captured with an Olympus BX60 with a 10x objective, or a confocal microscope Zeiss LSM 710NLO-Meta (AxioExaminer; Zeiss), or an inverted 780-Quasar confocal module (AxioObserver; Zeiss) with a 40x objective and analyzed using Image Pro Plus 7.0 or ZEN (Zeiss). For quantification of colocalization, the global Pearson's coefficient (r) was calculated using Volocity (PerkinElmer).
Phagocytosis assay
pHrodo Red conjugated Zymosan Bioparticles (Life technologies) 1mg were suspended in 2ml HBSS and sonicated for 5min. Peritoneal exudate cells (1 × 10⁵) from peritoneal lavage were seeded in 100μl of 5% BSA buffer in 5ml FACS tubes and incubated with homogeneously dispersed 100μl pHrodo Red labeled Zymosan Bioparticles for indicated time at 37°C. At each time point, tubes were placed on ice and were immediately fixed with methanol free 1% PFA (ThermoFisher). After surface staining, cells were analyzed by flow cytometry.
Zymosan induced peritonitis
Mice were injected IP with homogeneously dispersed Zymosan A (Sigma Aldrich) 0.1mg in 1ml PBS. After 6, 20, 48 and 144hrs, peritoneal exudate cells were collected from peritoneal lavage and their phenotypes were analyzed via flow cytometry.
Metabolic assays
To measure the extracellular acidification rate and the oxygen consumption rate, cells were sorted using a FACSAria II, and then plated (5 × 10⁵ per well) on a XF96 cell-culture microplate coated with poly-D lysine (50μg/ml). Experiments were done in XF Assay Medium that contained 25mM glucose, 2mM L-glutamine, 1mM Na pyruvate and analyzed using a Seahorse XF96 extracellular flux analyzer (Agilent Technologies). When indicated, the following were injected: oligomycin (1.5μM), FCCP (1.5μM), Rotenone (100nM) and antimycin A (1μM) (Sigma). Basal ECAR, OCR, and SRC reports were generated by Wave Desktop software (Agilent Technologies).
RNA sequencing and analysis
Macrophages from IL-4c treated WT and RICTOR KO mice were sorted on FACSAria II. Total RNA was extracted using RNeasy Mini Kit (QIAGEN) according to the manufacturer’s instructions. mRNA were isolated by a NEBNext® Poly(A) mRNA Magnetic Isolation Module. Samples were randomly primed and prepared based on manufacturer’s recommendation (NEBNext® Ultra™ RNA Library Prep Kit for Illumina®). Samples were pooled and sequenced on a HiSeq with a read length configuration of 150 PE. Samples were sequenced and analyzed by Admera Health.
The quality was checked by FastQC v0.10.1. The reads were mapped to the GRCM38, and reported as Fragments Per Kilobase of transcript per Million mapped reads units. We employed Gene Set Enrichment Analysis (GSEA) in context of Gene Ontology. We utilized specific genes sets (GSE25088) to perform GSEA. TCA cycle related Genes (KEGG_Citrate_Cycle_TCA_Cycle pathway) were reanalyzed from Immunological Genome Project two data sets (GSE37448): MF_CD11c-CD11b+Lu and MF_Alv_Lu (Lung Alveolar mac CD11b−CD11c+SiglecF+), and heat map was generated using http://rstats.immgen.org/MyGeneSet/.
Generation of BMDMs
For preparation of bone marrow cell suspensions, bone marrow was flushed with DMEM supplemented with 10% FBS, 1% penicillin/streptomycin and 23mM L-glutamine plus 20% L929-conditioned media. The cells were incubated at 37°C, and on day 4, non-adherent cells were removed and media was replenished. On day 7, BMDMs were lifted using Cellstripper (Mediatech, Manassas, VA), and 2 x 10⁶ cells were skewed to M2 with IL-4 (10ng/mL) for 18hrs.
Tissue-resident macrophage isolation
Organs were collected, cut into small pieces, and incubated with collagenase IV (Gibco) and DNaseI (Roche) in 2% FBS RPMI for 30min then the digest was passed through a 70μm strainer (BD bioscience). Red blood cells were lysed with 1mL ACK lysis buffer (Quality biological). After centrifugation, cells were incubated with Fc block (BD bioscience), and diluted in Hank’s balanced salt solution (GE Healthcare), and sorted using FACSAria II.
Chromatin immunoprecipitation (ChIP)
Peritoneal exudate cells were fixed with 1% PFA for 10min at RT and quenched with 1.25mM glycine. A modified Abcam protocol for ChIP was used for the following procedures. Snap frozen samples were lysed in 1% SDS lysis buffer and chromatin was sheared using Sonic
Dismembrator (Fisher Scientific) for 20 seconds at 7 cycles. After removing debris, chromatin samples were diluted and incubated with 3μg ChIP grade anti-FOXO1A (Abcam) or control ChIP grade rabbit-anti-IgG (Abcam) overnight at 4°C with rotation. Aliquots of each sample without antibody incubation were used to calculate immunoprecipitation as percentage of input. Next, chromatin samples were precipitated using Dynabeads Protein G (Life Technologies). After washing with low/high salt washing buffer and reverse crosslinking, DNA was purified using UltraPure Buffer-Saturated Phenol:Chloroform (Invitrogen). Purified DNA was analyzed by qPCR using power SYBR Green PCR Master Mix (Applied Biosystems), respectively. FOXO1 binding sites on GATA6 were predicted based on SABiosciences' proprietary database (http://www.sabiosciences.com/chipqpcrsearch.php?app=TFBS) and primer pairs were designed near predicted binding site: FOXO1 forward: GTTCCTATGGCCAGGGCTTC and reverse: CCTGGGGACACTGGAACTTAC. ChIP results were calculated as percentage of input DNA and relative expression was shown in comparison to WT.
Statistics
Graphs were generated and statistical analysis performed with Prism7 (GraphPad). Comparison between two means was done by t-test or non-parametric 2-tailed Mann-Whitney t-test. Comparison between three or more means was done by Two-Way ANOVA with Bonferroni post-test.
Supplementary Material
Highlights.
mTORC2 activity is lower in tissue-resident peritoneal macrophages
mTORC2 inhibits the generation and activity of tissue-resident peritoneal macrophages
mTORC2 signaling negatively regulates GATA6 expression by controlling FOXO1 activity
mTORC2 is important for the metabolic reprogramming of tissue-resident macrophages
Acknowledgments
We thank the members of the Horton and Powell labs for review of this manuscript. We thank Lee Blosser for assistance with flow cytometry sorting. This work was supported by NIH grants (PO1HL010342 and R21HL111783 to M.R.H., R01AI077610 to J.D.P., 5P30CA006973 to the JHU Oncology Research Center, and S10 RR024550 and S10 OD016374 to the JHU Microscopy Facility), FAMRI and The Osborne Family Research Fund to M.R.H., and support from the Bloomberg~Kimmel Institute for Cancer Immunothreapy to J.D.P.
Footnotes
Accession Numbers
GEO: GSE94965
Author Contributions
M.O., S.L.C., I.S., A.J.T., C.H.P., M.L.A., and Y.C. performed and analyzed experiments. M.O., J.D.P and M.R.H. wrote the manuscript. J.D.P and M.R.H. supervised the project.
The authors have no conflicting financial interests.
Publisher's Disclaimer: This is a PDF file of an unedited manuscript that has been accepted for publication. As a service to our customers we are providing this early version of the manuscript. The manuscript will undergo copyediting, typesetting, and review of the resulting proof before it is published in its final citable form. Please note that during the production process errors may be discovered which could affect the content, and all legal disclaimers that apply to the journal pertain.
References
- Ai D, Jiang H, Westerterp M, Murphy AJ, Wang M, Ganda A, Abramowicz S, Welch C, Almazan F, Zhu Y, et al. Disruption of mammalian target of rapamycin complex 1 in macrophages decreases chemokine gene expression and atherosclerosis. Circ Res. 2014;114:1576–1584. doi: 10.1161/CIRCRESAHA.114.302313. [DOI] [PMC free article] [PubMed] [Google Scholar]
- Bain CC, Hawley CA, Garner H, Scott CL, Schridde A, Steers NJ, Mack M, Joshi A, Guilliams M, Mowat AM, et al. Long-lived self-renewing bone marrow-derived macrophages displace embryo-derived cells to inhabit adult serous cavities. Nat Commun. 2016;7 doi: 10.1038/ncomms11852. ncomms11852. [DOI] [PMC free article] [PubMed] [Google Scholar]
- Byles V, Covarrubias AJ, Ben-Sahra I, Lamming DW, Sabatini DM, Manning BD, Horng T. The TSC-mTOR pathway regulates macrophage polarization. Nat Commun. 2013;4:2834. doi: 10.1038/ncomms3834. [DOI] [PMC free article] [PubMed] [Google Scholar]
- Davies LC, Jenkins SJ, Allen JE, Taylor PR. Tissue-resident macrophages. Nat Immunol. 2013;14:986–995. doi: 10.1038/ni.2705. [DOI] [PMC free article] [PubMed] [Google Scholar]
- Davies LC, Rosas M, Smith PJ, Fraser DJ, Jones SA, Taylor PR. A quantifiable proliferative burst of tissue macrophages restores homeostatic macrophage populations after acute inflammation. Eur J Immunol. 2011;41:2155–2164. doi: 10.1002/eji.201141817. [DOI] [PubMed] [Google Scholar]
- Delgoffe GM, Pollizzi KN, Waickman AT, Heikamp E, Meyers DJ, Horton MR, Xiao B, Worley PF, Powell JD. The kinase mTOR regulates the differentiation of helper T cells through the selective activation of signaling by mTORC1 and mTORC2. Nat Immunol. 2011;12:295–303. doi: 10.1038/ni.2005. [DOI] [PMC free article] [PubMed] [Google Scholar]
- Dey A, Allen J, Hankey-Giblin PA. Ontogeny and polarization of macrophages in inflammation: blood monocytes versus tissue macrophages. Front Immunol. 2014;5:683. doi: 10.3389/fimmu.2014.00683. [DOI] [PMC free article] [PubMed] [Google Scholar]
- Eijkelenboom A, Burgering BM. FOXOs: signalling integrators for homeostasis maintenance. Nat Rev Mol Cell Biol. 2013;14:83–97. doi: 10.1038/nrm3507. [DOI] [PubMed] [Google Scholar]
- Epelman S, Lavine KJ, Randolph GJ. Origin and functions of tissue macrophages. Immunity. 2014;41:21–35. doi: 10.1016/j.immuni.2014.06.013. [DOI] [PMC free article] [PubMed] [Google Scholar]
- Festuccia WT, Pouliot P, Bakan I, Sabatini DM, Laplante M. Myeloid-specific Rictor deletion induces M1 macrophage polarization and potentiates in vivo pro-inflammatory response to lipopolysaccharide. PLoS One. 2014;9:e95432. doi: 10.1371/journal.pone.0095432. [DOI] [PMC free article] [PubMed] [Google Scholar]
- Fox R, Nhan TQ, Law GL, Morris DR, Liles WC, Schwartz SM. PSGL-1 and mTOR regulate translation of ROCK-1 and physiological functions of macrophages. EMBO J. 2007;26:505–515. doi: 10.1038/sj.emboj.7601522. [DOI] [PMC free article] [PubMed] [Google Scholar]
- Gautier EL, Ivanov S, Williams JW, Huang SC, Marcelin G, Fairfax K, Wang PL, Francis JS, Leone P, Wilson DB, et al. Gata6 regulates aspartoacylase expression in resident peritoneal macrophages and controls their survival. J Exp Med. 2014;211:1525–1531. doi: 10.1084/jem.20140570. [DOI] [PMC free article] [PubMed] [Google Scholar]
- Gautier EL, Shay T, Miller J, Greter M, Jakubzick C, Ivanov S, Helft J, Chow A, Elpek KG, Gordonov S, et al. Gene-expression profiles and transcriptional regulatory pathways that underlie the identity and diversity of mouse tissue macrophages. Nat Immunol. 2012;13:1118–1128. doi: 10.1038/ni.2419. [DOI] [PMC free article] [PubMed] [Google Scholar]
- Gentek R, Molawi K, Sieweke MH. Tissue macrophage identity and self-renewal. Immunol Rev. 2014;262:56–73. doi: 10.1111/imr.12224. [DOI] [PubMed] [Google Scholar]
- Ginhoux F, Jung S. Monocytes and macrophages: developmental pathways and tissue homeostasis. Nat Rev Immunol. 2014;14:392–404. doi: 10.1038/nri3671. [DOI] [PubMed] [Google Scholar]
- Glass CK, Natoli G. Molecular control of activation and priming in macrophages. Nat Immunol. 2015;17:26–33. doi: 10.1038/ni.3306. [DOI] [PMC free article] [PubMed] [Google Scholar]
- Gordon S. Elie Metchnikoff: father of natural immunity. Eur J Immunol. 2008;38:3257–3264. doi: 10.1002/eji.200838855. [DOI] [PubMed] [Google Scholar]
- Gosselin D, Link VM, Romanoski CE, Fonseca GJ, Eichenfield DZ, Spann NJ, Stender JD, Chun HB, Garner H, Geissmann F, et al. Environment drives selection and function of enhancers controlling tissue-specific macrophage identities. Cell. 2014;159:1327–1340. doi: 10.1016/j.cell.2014.11.023. [DOI] [PMC free article] [PubMed] [Google Scholar]
- Gundra UM, Girgis NM, Ruckerl D, Jenkins S, Ward LN, Kurtz ZD, Wiens KE, Tang MS, Basu-Roy U, Mansukhani A, et al. Alternatively activated macrophages derived from monocytes and tissue macrophages are phenotypically and functionally distinct. Blood. 2014;123:e110–122. doi: 10.1182/blood-2013-08-520619. [DOI] [PMC free article] [PubMed] [Google Scholar]
- Hallowell RW, Collins SL, Craig JM, Zhang Y, Oh M, Illei PB, Chan-Li Y, Vigeland CL, Mitzner W, Scott AL, et al. mTORC2 signalling regulates M2 macrophage differentiation in response to helminth infection and adaptive thermogenesis. Nat Commun. 2017;8:14208. doi: 10.1038/ncomms14208. [DOI] [PMC free article] [PubMed] [Google Scholar]
- Hashimoto D, Chow A, Noizat C, Teo P, Beasley MB, Leboeuf M, Becker CD, See P, Price J, Lucas D, et al. Tissue-resident macrophages self-maintain locally throughout adult life with minimal contribution from circulating monocytes. Immunity. 2013;38:792–804. doi: 10.1016/j.immuni.2013.04.004. [DOI] [PMC free article] [PubMed] [Google Scholar]
- Heikamp EB, Patel CH, Collins S, Waickman A, Oh MH, Sun IH, Illei P, Sharma A, Naray-Fejes-Toth A, Fejes-Toth G, et al. The AGC kinase SGK1 regulates TH1 and TH2 differentiation downstream of the mTORC2 complex. Nat Immunol. 2014;15:457–464. doi: 10.1038/ni.2867. [DOI] [PMC free article] [PubMed] [Google Scholar]
- Hoffmann F, Ender F, Schmudde I, Lewkowich IP, Kohl J, Konig P, Laumonnier Y. Origin, Localization, and Immunoregulatory Properties of Pulmonary Phagocytes in Allergic Asthma. Front Immunol. 2016;7:107. doi: 10.3389/fimmu.2016.00107. [DOI] [PMC free article] [PubMed] [Google Scholar]
- Huang SC, Everts B, Ivanova Y, O'Sullivan D, Nascimento M, Smith AM, Beatty W, Love-Gregory L, Lam WY, O'Neill CM, et al. Cell-intrinsic lysosomal lipolysis is essential for alternative activation of macrophages. Nat Immunol. 2014;15:846–855. doi: 10.1038/ni.2956. [DOI] [PMC free article] [PubMed] [Google Scholar]
- Huang SC, Smith AM, Everts B, Colonna M, Pearce EL, Schilling JD, Pearce EJ. Metabolic Reprogramming Mediated by the mTORC2-IRF4 Signaling Axis Is Essential for Macrophage Alternative Activation. Immunity. 2016;45:817–830. doi: 10.1016/j.immuni.2016.09.016. [DOI] [PMC free article] [PubMed] [Google Scholar]
- Jenkins SJ, Ruckerl D, Cook PC, Jones LH, Finkelman FD, van Rooijen N, MacDonald AS, Allen JE. Local macrophage proliferation, rather than recruitment from the blood, is a signature of TH2 inflammation. Science. 2011;332:1284–1288. doi: 10.1126/science.1204351. [DOI] [PMC free article] [PubMed] [Google Scholar]
- Jenkins SJ, Ruckerl D, Thomas GD, Hewitson JP, Duncan S, Brombacher F, Maizels RM, Hume DA, Allen JE. IL-4 directly signals tissue-resident macrophages to proliferate beyond homeostatic levels controlled by CSF-1. J Exp Med. 2013;210:2477–2491. doi: 10.1084/jem.20121999. [DOI] [PMC free article] [PubMed] [Google Scholar]
- Jiang H, Westerterp M, Wang C, Zhu Y, Ai D. Macrophage mTORC1 disruption reduces inflammation and insulin resistance in obese mice. Diabetologia. 2014;57:2393–2404. doi: 10.1007/s00125-014-3350-5. [DOI] [PubMed] [Google Scholar]
- Laplante M, Sabatini DM. mTOR signaling at a glance. J Cell Sci. 2009;122:3589–3594. doi: 10.1242/jcs.051011. [DOI] [PMC free article] [PubMed] [Google Scholar]
- Lavin Y, Winter D, Blecher-Gonen R, David E, Keren-Shaul H, Merad M, Jung S, Amit I. Tissue-resident macrophage enhancer landscapes are shaped by the local microenvironment. Cell. 2014;159:1312–1326. doi: 10.1016/j.cell.2014.11.018. [DOI] [PMC free article] [PubMed] [Google Scholar]
- Linke M, Pham HT, Katholnig K, Schnoller T, Miller A, Demel F, Schutz B, Rosner M, Kovacic B, Sukhbaatar N, et al. Chronic signaling via the metabolic checkpoint kinase mTORC1 induces macrophage granuloma formation and marks sarcoidosis progression. Nat Immunol. 2017 doi: 10.1038/ni.3655. [DOI] [PMC free article] [PubMed] [Google Scholar]
- Martinez FO, Gordon S. The M1 and M2 paradigm of macrophage activation: time for reassessment. F1000Prime Rep. 2014;6:13. doi: 10.12703/P6-13. [DOI] [PMC free article] [PubMed] [Google Scholar]
- Martinez FO, Helming L, Gordon S. Alternative activation of macrophages: an immunologic functional perspective. Annu Rev Immunol. 2009;27:451–483. doi: 10.1146/annurev.immunol.021908.132532. [DOI] [PubMed] [Google Scholar]
- Murray PJ, Wynn TA. Protective and pathogenic functions of macrophage subsets. Nat Rev Immunol. 2011;11:723–737. doi: 10.1038/nri3073. [DOI] [PMC free article] [PubMed] [Google Scholar]
- Okabe Y, Medzhitov R. Tissue-specific signals control reversible program of localization and functional polarization of macrophages. Cell. 2014;157:832–844. doi: 10.1016/j.cell.2014.04.016. [DOI] [PMC free article] [PubMed] [Google Scholar]
- Pan H, O'Brien TF, Zhang P, Zhong XP. The role of tuberous sclerosis complex 1 in regulating innate immunity. J Immunol. 2012;188:3658–3666. doi: 10.4049/jimmunol.1102187. [DOI] [PMC free article] [PubMed] [Google Scholar]
- Pluddemann A, Mukhopadhyay S, Gordon S. Innate immunity to intracellular pathogens: macrophage receptors and responses to microbial entry. Immunol Rev. 2011;240:11–24. doi: 10.1111/j.1600-065X.2010.00989.x. [DOI] [PubMed] [Google Scholar]
- Pollizzi KN, Patel CH, Sun IH, Oh MH, Waickman AT, Wen J, Delgoffe GM, Powell JD. mTORC1 and mTORC2 selectively regulate CD8+ T cell differentiation. J Clin Invest. 2015;125:2090–2108. doi: 10.1172/JCI77746. [DOI] [PMC free article] [PubMed] [Google Scholar]
- Powell JD, Pollizzi KN, Heikamp EB, Horton MR. Regulation of immune responses by mTOR. Annu Rev Immunol. 2012;30:39–68. doi: 10.1146/annurev-immunol-020711-075024. [DOI] [PMC free article] [PubMed] [Google Scholar]
- Rosas M, Davies LC, Giles PJ, Liao CT, Kharfan B, Stone TC, O'Donnell VB, Fraser DJ, Jones SA, Taylor PR. The transcription factor Gata6 links tissue macrophage phenotype and proliferative renewal. Science. 2014;344:645–648. doi: 10.1126/science.1251414. [DOI] [PMC free article] [PubMed] [Google Scholar]
- Ruckerl D, Jenkins SJ, Laqtom NN, Gallagher IJ, Sutherland TE, Duncan S, Buck AH, Allen JE. Induction of IL-4Ralpha-dependent microRNAs identifies PI3K/Akt signaling as essential for IL-4-driven murine macrophage proliferation in vivo. Blood. 2012;120:2307–2316. doi: 10.1182/blood-2012-02-408252. [DOI] [PMC free article] [PubMed] [Google Scholar]
- Sharma R, Colarusso P, Zhang H, Stevens KM, Patel KD. FRNK negatively regulates IL-4-mediated inflammation. J Cell Sci. 2015;128:695–705. doi: 10.1242/jcs.156588. [DOI] [PubMed] [Google Scholar]
- Stables MJ, Shah S, Camon EB, Lovering RC, Newson J, Bystrom J, Farrow S, Gilroy DW. Transcriptomic analyses of murine resolution-phase macrophages. Blood. 2011;118:e192–208. doi: 10.1182/blood-2011-04-345330. [DOI] [PMC free article] [PubMed] [Google Scholar]
- Szanto A, Balint BL, Nagy ZS, Barta E, Dezso B, Pap A, Szeles L, Poliska S, Oros M, Evans RM, et al. STAT6 transcription factor is a facilitator of the nuclear receptor PPARgamma-regulated gene expression in macrophages and dendritic cells. Immunity. 2010;33:699–712. doi: 10.1016/j.immuni.2010.11.009. [DOI] [PMC free article] [PubMed] [Google Scholar]
- Taylor PR, Martinez-Pomares L, Stacey M, Lin HH, Brown GD, Gordon S. Macrophage receptors and immune recognition. Annu Rev Immunol. 2005;23:901–944. doi: 10.1146/annurev.immunol.23.021704.115816. [DOI] [PubMed] [Google Scholar]
- Thomson AW, Turnquist HR, Raimondi G. Immunoregulatory functions of mTOR inhibition. Nat Rev Immunol. 2009;9:324–337. doi: 10.1038/nri2546. [DOI] [PMC free article] [PubMed] [Google Scholar]
- Tzivion G, Dobson M, Ramakrishnan G. FoxO transcription factors; Regulation by AKT and 14-3-3 proteins. Biochim Biophys Acta. 2011;1813:1938–1945. doi: 10.1016/j.bbamcr.2011.06.002. [DOI] [PubMed] [Google Scholar]
- Uderhardt S, Herrmann M, Oskolkova OV, Aschermann S, Bicker W, Ipseiz N, Sarter K, Frey B, Rothe T, Voll R, et al. 12/15-lipoxygenase orchestrates the clearance of apoptotic cells and maintains immunologic tolerance. Immunity. 2012;36:834–846. doi: 10.1016/j.immuni.2012.03.010. [DOI] [PubMed] [Google Scholar]
- Wang J, Kubes P. A Reservoir of Mature Cavity Macrophages that Can Rapidly Invade Visceral Organs to Affect Tissue Repair. Cell. 2016;165:668–678. doi: 10.1016/j.cell.2016.03.009. [DOI] [PubMed] [Google Scholar]
- Weichhart T, Costantino G, Poglitsch M, Rosner M, Zeyda M, Stuhlmeier KM, Kolbe T, Stulnig TM, Horl WH, Hengstschlager M, et al. The TSC-mTOR signaling pathway regulates the innate inflammatory response. Immunity. 2008;29:565–577. doi: 10.1016/j.immuni.2008.08.012. [DOI] [PubMed] [Google Scholar]
- Zhang L, Tschumi BO, Lopez-Mejia IC, Oberle SG, Meyer M, Samson G, Ruegg MA, Hall MN, Fajas L, Zehn D, et al. Mammalian Target of Rapamycin Complex 2 Controls CD8 T Cell Memory Differentiation in a Foxo1-Dependent Manner. Cell Rep. 2016;14:1206–1217. doi: 10.1016/j.celrep.2015.12.095. [DOI] [PubMed] [Google Scholar]
- Zhu L, Yang T, Li L, Sun L, Hou Y, Hu X, Zhang L, Tian H, Zhao Q, Peng J, et al. TSC1 controls macrophage polarization to prevent inflammatory disease. Nat Commun. 2014;5:4696. doi: 10.1038/ncomms5696. [DOI] [PubMed] [Google Scholar]
Associated Data
This section collects any data citations, data availability statements, or supplementary materials included in this article.