Abstract
Background
The presence and extent of coronary artery calcium (CAC) are associated with increased risk for cardiovascular events. We determined whether information on the distribution of CAC and coronary dominance as detected by cardiac computed tomography (CT) were incremental to traditional Agatston score (AS) in predicting incident major coronary heart disease (CHD).
Methods and Results
We assessed total AS and the presence of CAC per coronary artery, per segment and coronary dominance by CT in participants from the Offspring and Third generation cohorts of the Framingham Heart Study. The primary outcome was major CHD (myocardial infarction or coronary heart disease death). We performed multivariable Cox proportional hazards analysis and calculated relative integrated discrimination improvement (rIDI). In 1268 subjects (mean age 56.2±10.3 years, 63.2% men) with AS >0 and no prior history of major CHD, a total of 42 major CHD events occurred during median follow of 7.4 years. The number of coronary arteries with CAC (hazard ratio: 1.68 per artery, 95% CI 1.10–2.57, p=0.02) and the presence of CAC in the proximal dominant coronary artery (HR 2.59, 95% CI 1.15–5.83, p=0.02) were associated with major CHD events after multivariable adjustment for Framingham risk score and categories of AS. In addition, measures of CAC distribution improved discriminatory capacity for major CHD events (rIDI 0.14).
Conclusions
Distribution of coronary atherosclerosis, especially CAC in the proximal dominant coronary artery and an increased number of coronary arteries with CAC, predict major CHD events independently of the traditional AS in community-dwelling men and women.
Keywords: coronary calcium, computed tomography, coronary disease, epidemiology, coronary calcium distribution, coronary dominance
Introduction
Coronary artery calcium (CAC) is a hallmark of atherosclerosis and plays an important role in progression, destabilization and stabilization of coronary plaques.1 The presence and amount of CAC are strong predictors of cardiovascular events.2–4 CAC scoring provides significant improvement over traditional cardiovascular risk scores in risk discrimination and reclassification.3,4 The amount of CAC is associated with the overall burden of coronary atherosclerosis, including both calcified and non-calcified plaque.5
The extent of CAC is traditionally assessed by total Agatston score.6 Agatston’s method uses multiplication of calcified plaque density and area, and results are a strong indicator of extensive disease as well as significant involvement of vessels with calcification. However, the detailed information on regional CAC distribution is not included in Agatston score. Diffuse coronary artery disease including both calcified and non-calcified plaque as detected by coronary computed tomography (CT) angiography was associated with worse cardiovascular outcomes independently of the presence of significant stenosis.7 Similarly, anatomic coronary plaque burden determined on invasive coronary angiography was a predictor of death, myocardial infarction or non-ST segment elevation acute coronary syndrome.8
These findings underscore the importance of studying CAC distribution and diffuse pattern of coronary atherosclerosis. An early fluoroscopy and electron beam CT studies demonstrated association of diffuse pattern of CAC (measured as number of coronary arteries with CAC) with the presence and extent of obstructive coronary disease.9,10 However, there are limited data on the predictive value of CAC distribution beyond total CAC score. Williams et al. showed that the number of CAC lesions and the high amount of CAC in the left main coronary artery were predictive of subsequent mortality, but these measures were not incremental to total Agatston score.11 In contrast, in a subanalysis of the Multi-Ethnic Study of Atherosclerosis (MESA), calcium coverage score was a significant predictor of coronary heart disease (CHD) events after including Agatston score in the model.12 Recently, Blaha et al. reported results from the MESA study, in which number of coronary arteries with CAC improved the prediction of coronary heart disease (CHD) and total cardiovascular events when added to Agatston score.13
We studied whether the distribution of CAC in individual coronary arteries and segments as well as CAC in the proximal dominant coronary artery as detected by cardiac CT predicts incident major CHD events independent of traditional CAC score expressed as Agatston score in asymptomatic community-dwelling men and women without prevalent major CHD.
Methods
Study population
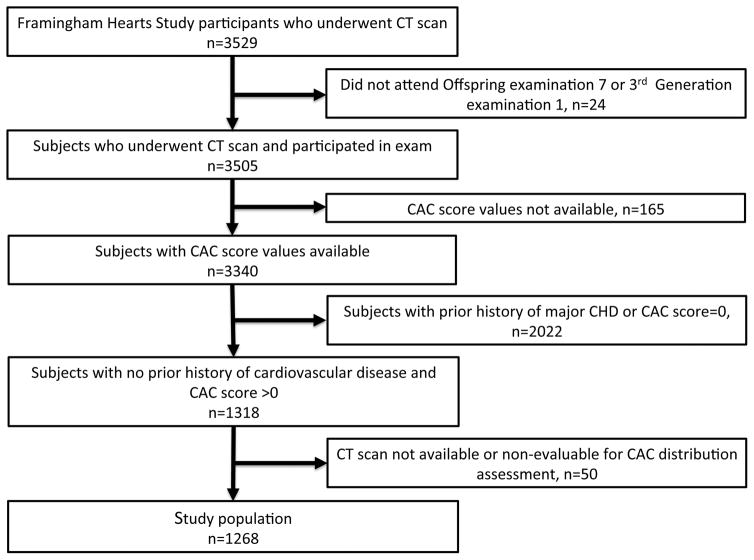
The selection criteria and design of the Framingham multidetector CT study and the method of CAC quantification have been described previously.14 Participants for this study were drawn from the Offspring and the Third generation cohorts of the community-based Framingham Heart Study. Participants in the analysis attended the Offspring seventh examination cycle (1998–2001) and Third generation first exam cycle (2002–2005) and have complete risk factor information. Participating men were at least 33 years of age and women at least 36 years of age. In our analysis, we excluded patients with prevalent major CHD at the time of CT scan (Figure 1). We included all subjects with CAC detected on the scan (CAC score >0). The Institutional Review Boards of the Boston University Medical Center and Massachusetts General Hospital approved the study. All participants provided written informed content.
Figure 1.
Study population, exclusions and inclusions.
CT Imaging
Participants were imaged on an eight-slice multi detector-row CT scanner (LightSpeed Ultra, General Electric, Milwaukee, WI). A non-contrast prospectively ECG-triggered CT scan for the assessment of CAC was performed during breath hold (tube potential 120 kVp, tube current of 320 mA [weight <220 pounds)] or 400 mA [weight >220 pounds], 2.5 mm-thick slices). The estimated effective radiation dose was 1.0–1.25 mSv.
CAC analysis
All CT scans were evaluated by an experienced reader for the presence and amount of CAC using a workstation (Aquarius, TeraRecon, San Mateo, CA). A calcified lesion was defined as an area >3 connected pixels with a CT number >130 Hounsfield units using 3-dimmensional connectivity criteria (6 points). CAC score was calculated using the method described by Agatston et al.6 CAC score was categorized as low (1–100), intermediate (101–300) and high (>300).2,3 We also performed a sensitivity analysis and categorized CAC score as low (1–100), intermediate (101–400) and high (>400).
Two independent readers evaluated CT scans with CAC >0 and determined the presence of CAC in each coronary segment. The discrepant results were resolved by a consensus. We used the coronary segment model of the Society of Cardiovascular Computed Tomography.15 CAC was present in the coronary segment if at least one calcified lesion was present. We recorded the number of coronary segments and number of coronary arteries with CAC. We determined coronary dominance. The coronary system was considered right dominant if both posterior descending artery and posterolateral branch originated from the right coronary artery. The coronary system was considered left dominant if both posterior descending artery and posterolateral branch originated from the left circumflex coronary artery. The coronary system was considered co-dominant if posterior descending artery originated from the right coronary artery and posterolateral branch originated from the left circumflex coronary artery. The proximal coronary segments for the purpose of this analysis were defined as segment 1 (proximal right coronary artery), segment 2 (mid right coronary artery), segment 5 (left main coronary artery), segment 6 (proximal left anterior descending coronary artery), and segment 11 (proximal left circumflex coronary artery). The presence of proximal CAC was considered positive if CAC was present in segments 1 or 2 (right dominant), segments 5, 6, or 11 (left dominant) and segments 1, 2, 5, 6, or 11 (co-dominant).
Cardiovascular risk factors and cardiovascular disease outcomes
A standard clinic examination at the Offspring seventh cycle or the Third Generation first examination cycle was conducted and included an interview with and physical examination by a physician, and conduct of laboratory tests.16,17 Standardized measurements of traditional risk factors were conducted. The cardiovascular outcomes were defined in the Framingham Heart Study previously.4,18 For the purpose of this study, major CHD events included recognized myocardial infarction and death from coronary heart disease. In the Framingham Heart Study, all study participants were under continuous surveillance for the development of outcomes. Information about outcomes on follow-up was obtained with the aid of medical histories, physical examinations at the study clinic, hospitalization records, and communication with personal physicians. A panel of 3 experienced investigators who evaluated all pertinent medical records reviewed all suspected new events.
Statistical analysis
Continuous data are presented as mean ± standard deviation or median (25th–75th percentile). Comparisons between groups were performed with an independent Student t-test or the Wilcoxon rank-sum test for continuous variables and Fisher’s exact test for categorical variables. To evaluate the predictive value of CAC distribution measures and CAC score on subsequent major CHD, we calculated numbers of participants with major CHD per 1000 person years after stratification by number of coronary arteries with CAC, number of coronary segments with CAC, presence of CAC in the proximal dominant coronary artery, and CAC score categories. Kaplan-Meier estimates of major CHD-free survival according to number of coronary arteries and segments with CAC, presence of CAC in the proximal dominant coronary artery and CAC score categories were calculated. After checking the assumption of proportional hazards between categories of CAC distribution metrics (all p>0.10), we used Cox proportional hazards regression models to relate each CAC distribution measures to time-to-event and calculated hazard ratios (HR) with 95% confidence intervals (CI). Multivariable models were adjusted for 10-year Framingham risk score18, ASCVD score19, and total CAC score categories or log-transformed CAC scores. To assess the ability of the model to discriminate major CHD events after the addition of CAC distribution measures, we calculated area under the receiver operating characteristics curve (AUC) and relative integrated discrimination improvement (rIDI).20 Analyses were performed with the use of SAS software, version 9.2 (SAS Institute). All hypotheses were tested with two-sided 0.05 alpha level.
Results
Baseline characteristics
We studied 1268 out of 3529 subjects who underwent a CAC scan in the Framingham Heart Study and had a CAC >0 (Figure 1). We excluded subjects with prevalent major CHD. The median follow-up was 7.4 (6.3–8.3) years. There were 42 major CHD events, 38 myocardial infarctions, and 4 CHD deaths during follow-up (event rate: major CHD 3.3%, myocardial infarction 3.0%, CHD death 0.3%). The baseline characteristics of subjects are summarized in Table 1. Subjects with subsequent major CHD events were older and had higher prevalence of current or former smoking. The mean Framingham Heart Study risk score was higher in subjects with major CHD events.
Table 1.
Baseline demographic and cardiovascular risk factors of study subject stratified by major CHD events
| All n=1268 | No major CHD n=1226 | Major CHD n=42 | P value | |
|---|---|---|---|---|
| Age (years) | 56.2±10.3 | 56.0±10.3 | 60.4±9.3 | 0.01 |
| Men (%) | 801 (63.2) | 771 (62.9) | 30 (71.4) | 0.33 |
| Cardiovascular risk factors (%) | ||||
| Hypertension | 530 (41.8) | 510 (41.6) | 20 (47.6) | 0.43 |
| Dyslipidemia | 387 (30.5) | 378 (30.8) | 9 (21.4) | 0.23 |
| Diabetes mellitus | 124 (9.8) | 116 (9.5) | 8 (19.0) | 0.06 |
| Current or former smoking | 725 (57.8) | 694 (57.3) | 31 (73.8) | 0.04 |
| Obesity (body mass index >30 kg/m2) | 419 (33.0) | 403 (32.9) | 16 (38.1) | 0.51 |
| Framingham risk score (%) | 14.0±11.4 | 13.8±11.3 | 21.5±12.7 | <0.001 |
CAC and major CHD events
Cardiac CT characteristics are summarized in Table 2. Subjects with major CHD events had higher CAC score, were classified more often in higher CAC score category, had more coronary arteries and coronary artery segments with CAC and had more often CAC in the proximal dominant, proximal right and proximal left coronary segments. There was no difference in coronary artery dominance between those with and without major CHD events. The results categorized with the highest CAC score category of Agatston score >400 are summarized in Supplemental Table 1. The prevalence of CAC in the proximal dominant coronary artery increased with across CAC categories and also with increasing number of coronary arteries with CAC (Supplemental Table 2).
Table 2.
Coronary artery calcium characteristics as detected by cardiac CT and stratified by major coronary heart disease events
| All n=1268 | No major CHD n=1226 | Major CHD n=42 | P value | |
|---|---|---|---|---|
| Total CAC score (median, 25th–75th percentile) | 71 (15, 256) | 68 (14, 233) | 484 (158, 730) | <0.001 |
| CAC score categories (%) | <0.001 | |||
| 1–100 | 721 (56.9) | 713 (58.2) | 8 (19.1) | |
| 101–300 | 269 (21.2) | 260 (21.2) | 9 (21.4) | |
| >300 | 278 (21.9) | 253 (20.6) | 25 (59.5) | |
| Number of segments with CAC (median, 25th–75th percentile) | 2 (1, 5) | 2 (1, 5) | 4 (6, 8) | <0.001 |
| Number of coronary segments with CAC (%) | <0.001 | |||
| 1–2 segments | 650 (51.3) | 647 (52.8) | 3 (7.1) | |
| 3–4 segments | 279 (22.0) | 269 (21.9) | 10 (23.8) | |
| 5–8 segments | 264 (20.8) | 242 (19.7) | 22 (52.4) | |
| >8 segments | 75 (5.9) | 68 (5.5) | 7 (16.7) | |
| Number of coronary arteries with CAC (%) | <0.001 | |||
| 1 vessel | 546 (43.1) | 545 (44.5) | 1 (2.4) | |
| 2 vessel | 294 (23.2) | 284 (23.2) | 10 (23.8) | |
| 3 vessel | 239 (18.9) | 225 (18.4) | 14 (33.3) | |
| 4 vessel | 189 (14.9) | 172 (14.0) | 17 (40.5) | |
| Coronary dominance (%) | ||||
| Right | 1177 (92.8) | 1136 (92.7) | 41 (97.6) | 0.71 |
| Left | 49 (3.9) | 48 (3.9) | 1 (2.4) | |
| Co-dominant | 42 (3.3) | 42 (3.4) | 0 (0) | |
| Proximal dominant coronary artery CAC (%) | <0.001 | |||
| Yes | 442 (34.9) | 411 (33.5) | 31 (73.8) | |
| No | 826 (65.1) | 815 (66.5) | 11 (26.2) | |
| Right proximal segments CAC (%) | ||||
| Yes | 620 (48.9) | 585 (47.7) | 35 (83.3) | <0.001 |
| No | 648 (51.1) | 641 (52.3) | 7 (16.7) | |
| Left proximal segments CAC (%) | ||||
| Yes | 1079 (85.1) | 1038 (84.7) | 41 (97.6) | 0.02 |
| No | 189 (14.9) | 188 (15.3) | 1 (2.4) | |
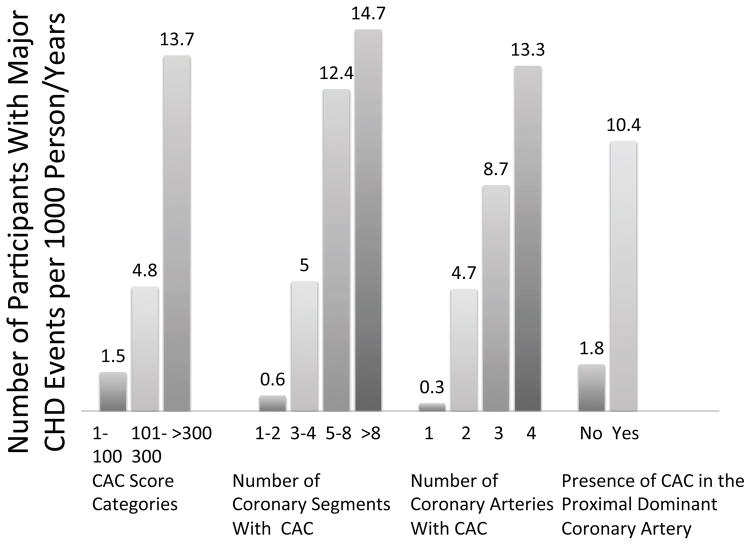
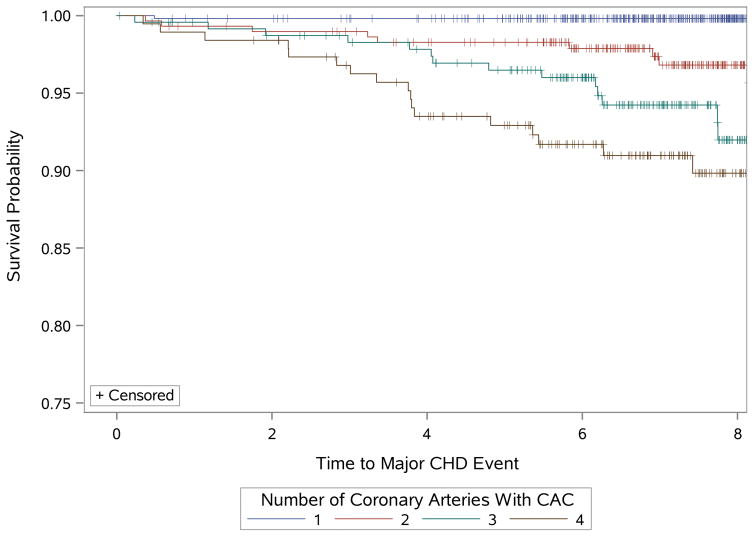
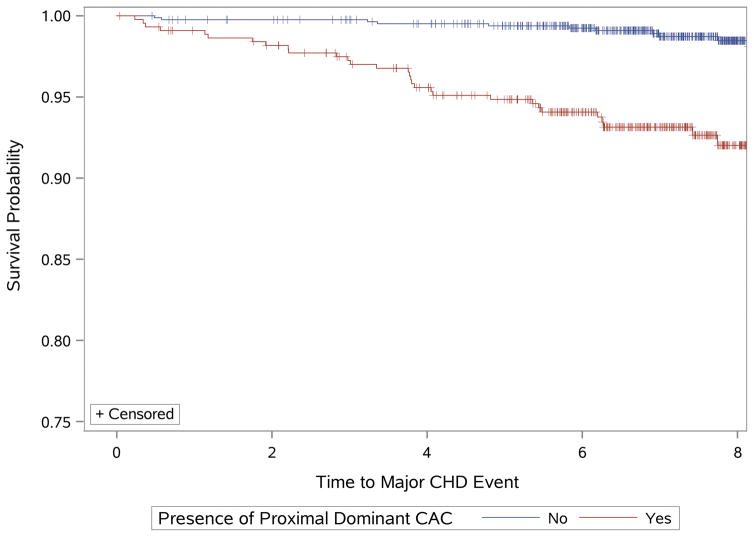
Major CHD event rates increased with increasing CAC score categories (Agatston score 1–100: 1.1%, 8/721; Agatston score 101–300: 3.3%, 9/269; Agatston score >300: 9.0%, 25/278). Similar results were observed with the highest CAC score category of Agatston score >400 (Agatston score 1–100: 1.1%, 8/721; Agatston score 101–400: 3.1%, 10/319; Agatston score >400: 10.5%, 24/228). Major CHD event rates also increased with increasing number of coronary segments with CAC (1–2 segments: 0.5%, 3/650; 3–4 segments: 3.6%, 10/279; 5–8 segments: 8.3%, 22/264; >8 segments: 9.3%, 7/75), number of coronary arteries with CAC involvement (1 vessel: 0.2%, 1/546; 2 vessels: 3.4%, 10/294; 3 vessels: 5.9%, 14/239; 4 vessels: 9.0%, 17/189), and the presence of CAC in the proximal dominant coronary artery (no: 2.4%, 20/846; yes: 5.2%, 22/422).
Numbers of participants with major CHD events per 1000 person/years are summarized in Figure 2. There was gradual increase of the number of participants with major CHD per 1000 person/years among categories of CAC score and measures of CAC distribution (p<0.001 for all). Number of participants with major CHD events per 1000 person/years in those with CAC in the proximal coronary artery increased across categories of CAC score (1–100, 101–300, >300), but not in those without CAC in the proximal coronary artery (Supplemental Figure 1).
Figure 2.
Numbers of participants with major CHD per 1000 person years stratified by CAC score categories, number of coronary segments with CAC, number of coronary arteries with CAC and the presence of CAC in the proximal dominant coronary artery.
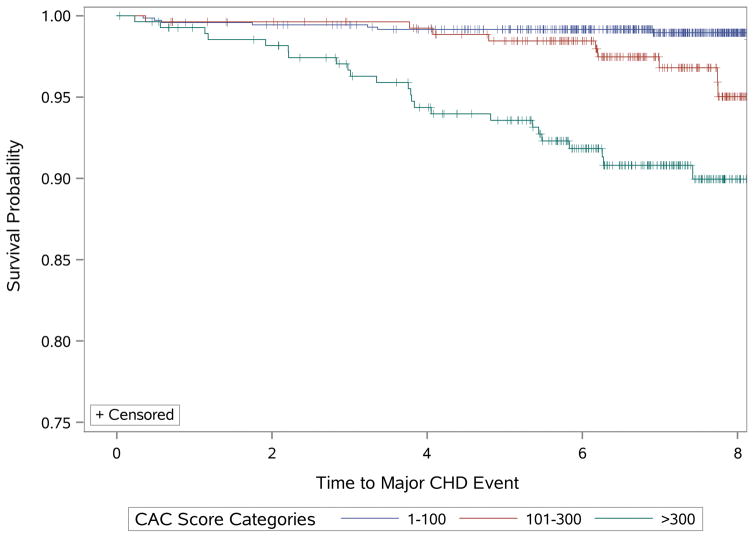
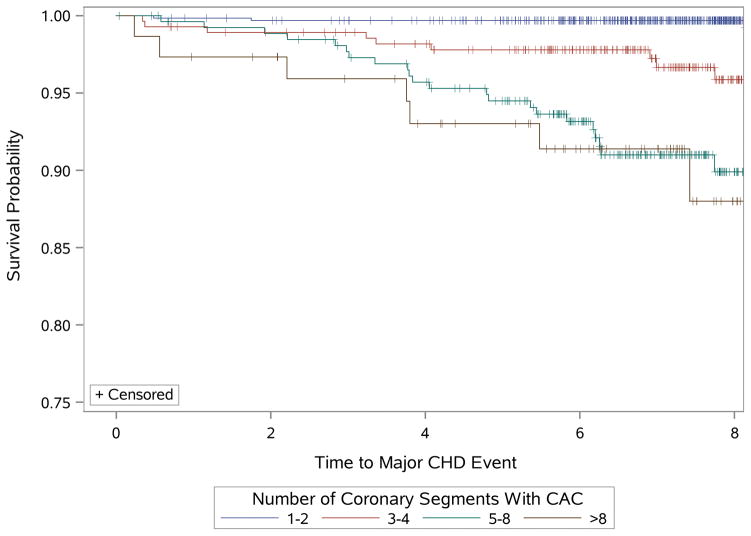
Kaplan-Meier estimates of major CHD-free survival according to CAC score categories, number of coronary segments and arteries with CAC, and the presence of CAC in the proximal dominant coronary artery are shown in Figure 3 (highest CAC score category of Agatston score >400 Supplemental Figure 2).
Figure 3.
Kaplan–Meier estimates of major CHD events by (3A) CAC score categories (Agatston score 1–100, 101–300, >300), (3B) number of coronary segments with CAC (1–2, 3–4, 5–8, >8), (3C) numbers of coronary arteries with CAC (1, 2, 3, 4), and (3D) the presence of CAC in the proximal dominant coronary artery (yes, no) in the Framingham Heart Study population.
Incremental Value of CAC distribution for prediction of major CHD events
In the multivariable Cox proportional hazard analysis, number of coronary segments with CAC, number of coronary arteries with CAC and the presence of CAC in the proximal dominant coronary artery were associated with increased risk of major CHD after adjustment for age and sex as well as after adjustment for Framingham risk score (Table 3). The results were similar when individual risk factors were used instead of Framingham risk score (data not shown). After adjustment for both Framingham risk score and CAC score categories, number of coronary arteries was independently associated with major CHD events. The risk of major CHD events increased by approximately 70% with each additional coronary artery with CAC. Similarly, the presence of CAC in the proximal dominant coronary artery was independently associated with approximately 2.6-fold increase in the risk of major CHD events. Finally, the number of coronary segments was not significantly associated with major CHD events after adjustment for Framingham risk score and CAC score categories. The results were similar when log-transformed CAC scores were used instead of CAC score categories. The risk of major CHD events increased by approximately 50% with each additional coronary artery with CAC. The presence of CAC in the proximal dominant coronary artery increased the risk of major CHD events approximately 2.4-times. The number of coronary segments was not significantly associated with major CHD events after adjustment. The results were similar when the highest CAC score category of Agatston score >400 and ASCVD score was used (Supplemental Table 3).
Table 3.
The results of multivariable Cox proportional hazards regression analysis for the prediction of major coronary heart disease events during follow-up
| Hazard Ratio (95% CI) | P value | |
|---|---|---|
| Model adjusted for age and gender | ||
| Number of coronary segments with CAC | 1.31 (1.18–1.45) | <0.001 |
| Number of coronary arteries with CAC | 2.29 (1.66–3.18) | <0.001 |
| Proximal dominant coronary artery CAC | 4.83 (2.35–9.91) | <0.001 |
| Model adjusted for Framingham risk score | ||
| Number of coronary segments with CAC | 1.28 (1.16–1.42) | <0.001 |
| Number of coronary arteries with CAC | 2.20 (1.61–3.02) | <0.001 |
| Proximal dominant coronary artery CAC | 4.68 (2.28–9.61) | <0.001 |
| Model adjusted for Framingham risk score and CAC score categories (1–100, 101–300, >300) | ||
| Number of coronary segments with CAC | 1.14 (0.99–1.32) | 0.07 |
| Number of coronary arteries with CAC | 1.68 (1.10–2.57) | 0.02 |
| Proximal dominant coronary artery CAC | 2.59 (1.15–5.83) | 0.02 |
| Model adjusted for Framingham risk score and log-transformed CAC score | ||
| Number of coronary segments with CAC | 1.09 (0.93–1.28) | 0.31 |
| Number of coronary arteries with CAC | 1.53 (1.00–2.36) | 0.05 |
| Proximal dominant coronary artery CAC | 2.35 (1.05–5.29) | 0.04 |
There was good discriminatory capacity of multivariable model including CAC score categories for major CHD events, with AUC of 0.77 (95% CI 0.69–0.85). The addition of CAC distribution measures improved the discriminatory capacity of the models for major CHD events (AUC between 0.79 and 0.80) with rIDI of 0.14 to 0.20, indicating good improvement of model performance (Table 4). These results suggest independent and incremental value of novel CAC distribution measures for major CHD events when added to traditional cardiovascular risk factors (expressed as Framingham risk score) and CAC score. The results were similar when the highest CAC score category of Agatston score >400 or ASCVD score was used (Supplemental Table 4 and 5). The presence of CAC in the proximal right and left coronary segments was not an independent and incremental predictor of major CHD events (Supplemental Table 6 and 7).
Table 4.
Measures of performance improvement with 95% confidence intervals adding novel CAC distribution measures to Framingham risk score and CAC score categories for the prediction of major coronary heart disease events
| Marker | AUC (C-statistic) | Relative IDI |
|---|---|---|
| Number of coronary segments with CAC | 0.79 (0.72, 0.86) | 0.20 (0.06, 0.38) |
| Number of coronary arteries with CAC | 0.80 (0.73, 0.87) | 0.14 (0.06, 0.23) |
| Proximal dominant coronary artery CAC | 0.79 (0.71, 0.87) | 0.14 (0.09, 0.20) |
AUC (C-statistic) for Framingham risk score 0.72 (0.64,0.80) and for multivariable model with CAC categories and Framingham risk score 0.77 (0.69, 0.85)
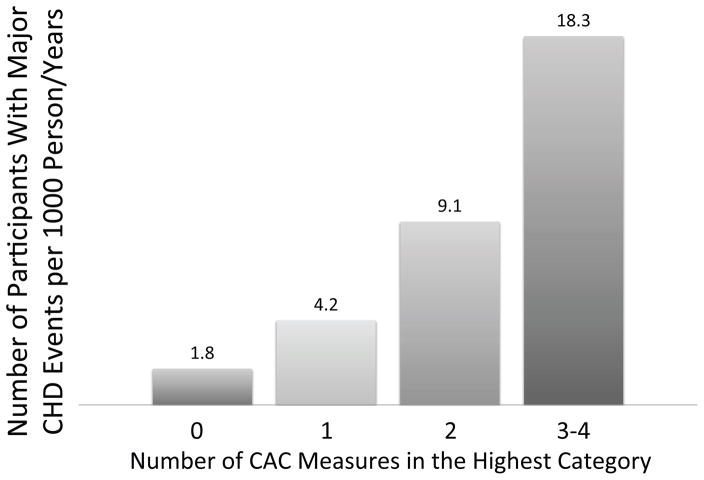
The risk of major CHD events increased with the increasing number of CAC measures in the highest category (CAC score >300, number of arteries with CAC =4, number of coronary segments >8, presence of CAC in the proximal dominant coronary artery) (Figure 4).
Figure 4.
Numbers of participants with major CHD per 1000 person years stratified by the number of CAC measures in the highest category (CAC score >300, number of coronary segments with CAC >8, number of coronary arteries with CAC = 4 and the presence of CAC in the proximal dominant coronary artery).
Discussion
In a well-characterized population of asymptomatic community dwelling men and women with no prior history of CHD, measures of CAC distribution (number of coronary arteries with CAC, the presence of CAC in the proximal dominant coronary artery) were associated with major CHD events. The association persisted after adjustment for traditional measure of CAC extent by Agatston score and cardiovascular risk factors. Our results suggest that a simple measure of CAC distribution – number of coronary arteries with CAC – may serve as an incremental marker of risk for CHD events in persons with CAC. Further, we showed that the presence of CAC in the proximal dominant coronary artery also increases the risk of major CHD events incrementally to CAC score.
Traditional CAC score assessment using Agatston’s method
The quantification of CAC using Agatston’s method has been the cornerstone of cardiovascular risk assessment for more than two decades.6 Epidemiologic studies demonstrated a graded increase in the risk of cardiovascular events across strata of CAC scores.2–4 However, Agatston score does not account for CAC distribution and does not include information on the involvement of individual coronary arteries and on the involvement of proximal and distal segments. The results of studies using coronary CT angiography showed a strong association of coronary atherosclerosis burden, typically expressed as number of coronary arteries or segments with plaque, with adverse outcomes.7 Similar association between coronary atherosclerotic burden and cardiovascular events was observed in Clinical Outcomes Utilizing Revascularization and Aggressive Drug Evaluation (COURAGE) trial using invasive coronary angiography.8
Distribution of CAC as a predictor of cardiovascular events
Previous studies showed the relationship of CAC distribution and segmental extent of coronary atherosclerosis to the presence of obstructive CAD and ischemia and their additive value to total CAC score.21,22 Total CAC score was also correlated with total plaque burden as assessed by coronary CT angiography and expressed as segment involvement score.23 Number of coronary arteries with CAC improved correlation to plaque burden in categories of mild (CAC score 1–100) and moderate (101–400) CAC. Further, higher segment involvement score was associated with more diffuse distribution of CAC. The authors concluded that addition of measures of CAC distribution improved the association of CAC scores with overall coronary plaque burden. However, these studies did not evaluate the relation to cardiovascular outcomes.
In the first outcome study, Williams et al. analyzed CAC scores obtained by electron beam computed tomography in 14,759 asymptomatic subjects and found the total number of CAC lesions as well as number of calcified lesions in the left main and left anterior descending coronary arteries were associated with increased all-cause mortality.11 However, number of CAC lesions was closely correlated to total CAC score and was not incremental to CAC score in prediction of mortality.11 Silverman et al. studied 6540 subjects from the MESA study.24 They found that CAC in 3 or 4 vessels, higher CAC burden, and involvement of the left main coronary artery were independent predictors of coronary-artery bypass surgery versus percutaneous coronary intervention in multivariate models adjusting for CAC score. Regional distribution of CAC predicted need for revascularization and mode of revascularization, which was indicative of meaningful communication of clinically important distribution of plaque. In another analysis from the MESA study, Brown et al. developed “calcium coverage score”, which quantified the percentage of the entire length of major epicardial coronary arteries with CAC plaque.12 Calcium coverage score was an independent, but not an incremental predictor of CHD events after controlling for total CAC score.12 In the recently published comprehensive analysis of CAC distribution in 3262 participants from the MESA study, Blaha et al. observed that number of vessels with CAC significantly improved capacity to predict CHD and cardiovascular events.13 Addition of number of vessels with CAC to total CAC score improved discriminatory capacity for CHD and cardiovascular events, especially in intermediate CAC score (1–400) category.
Our study confirms the observations from the MESA study in an independent cohort. The number of coronary arteries with CAC was an independent and incremental predictor of major CHD events after controlling for traditional cardiovascular risk assessment using Framingham risk score and total CAC score. The number of coronary segments was predictive of major CHD events in univariate analysis, but lost its significance after adjustment for CAC score. Our results add to the MESA study results by highlighting the importance of proximal CAC, especially when present in multiple coronary arteries and in the proximal dominant coronary artery, and add to the previous observations by Blaha et al.13, which showed that CAC diffusivity index was not an independent predictor of events. This is in contrast with the observation that increasing number of vessels with plaque and higher CAC scores were associated with higher odds of distal plaque and distal plaques were associated with significant stenosis.25,26 Indeed, prior invasive coronary angiographic study found that the majority of culprit lesions of myocardial infarctions are located in the proximal coronary arteries and our study confirms the importance of proximal coronary atherosclerosis in dominant vessels for major CHD events.27
Coronary dominance as predictor of adverse events
The novel finding of the association of the CAC presence in the proximal dominant coronary artery expands on previous studies exploring the relationship of coronary dominance and cardiovascular events. Parikh et al. found higher in-hospital mortality in patients with left dominant and co-dominant circulation undergoing percutaneous coronary intervention for acute coronary syndrome.28 In patients with ST segment elevation myocardial infarction, left dominant system was associated with increased risk of 30-day mortality and early re-infarction, but did not influence long-term outcomes.29 In a study using coronary CT angiography in 1425 patients, the presence of left coronary dominance was an independent predictor of myocardial infarction and all-cause mortality, especially in patients with obstructive CAD.30 In contrast, the results from the CONFIRM registry did not show difference in all-cause mortality between patients with right and left coronary dominance in both patients with and without 50% stenosis.31 Our results emphasize the importance of the presence of atherosclerosis in proximal dominant coronary artery as a predictor of major CHD events.
Study limitations
The exact determination of coronary segments and thus assignment to appropriate segment may be difficult in non-contrast scans. However, our results for the number of coronary arteries with CAC and proximal dominant coronary artery CAC were not affected by this problem. The number of major CHD events was relatively low. The low number of major CHD events limited our ability to perform multivariable analyses of predictive value of CAC distribution measures in each of the CAC score categories separately.
Conclusions
A greater distribution of coronary atherosclerosis with the presence of CAC in the proximal dominant coronary artery and increased number of coronary arteries with CAC predicts major CHD events and provides improved discrimination and reclassification, independent of total amount of CAC and cardiovascular risk factors in asymptomatic community-dwelling men and women free of major CHD. Our findings support future studies to evaluate these simple measures of regional CAC distribution. The measures of CAC distribution should be considered for the inclusion in standardized reports in addition to the traditional Agatston score.
Supplementary Material
Clinical Perspective.
The presence and extent of coronary artery calcium (CAC) are associated with increased risk for cardiovascular events. The extent of CAC is traditionally assessed by calculating total Agatston score (multiplication of calcium density and calcium area). However, the detailed information on regional CAC distribution is not included in Agatston score. We determined whether information on the distribution of CAC and coronary dominance as detected by cardiac computed tomography were incremental to traditional Agatston score in predicting incident major coronary heart disease. In a well-characterized population of asymptomatic community dwelling men and women with no prior history of coronary heart disease from Framingham Heart Study, measures of CAC distribution (number of coronary arteries with CAC, the presence of CAC in the proximal dominant coronary artery) were associated with major coronary heart disease events. The association persisted after adjustment for traditional measure of CAC extent by Agatston score and cardiovascular risk factors. Our results suggest that simple measures of CAC distribution – number of coronary arteries with CAC and the presence of CAC in the proximal dominant coronary artery – may serve as an incremental marker of risk for coronary heart disease events in persons with CAC. Our findings support future studies to evaluate these simple measures of regional CAC distribution. The measures of CAC distribution should be considered for the inclusion in standardized reports in addition to the traditional Agatston score.
Acknowledgments
Sources of Funding
This work was supported by the NIH Heart, Lung, and Blood Institute’s Framingham Heart Study (contract no. N01-HC-25195, HL076784, AG028321, HL070100, HL060040, HL080124, HL071039, HL077447, and HL107385). The study sponsors had no role in the design and conduct of the study; collection, management, analysis, and interpretation of the data; and preparation, review, or approval of the manuscript.
Footnotes
Disclosures
Dr. Ferencik received support from the American Heart Association (13FTF16450001). Dr. Hoffmann received Research Grants from NIH (U01HL092040, U01HL092022), Siemens Medical Solutions, Heart Flow Inc., and served as a consultant for Heart Flow. The remaining authors have no relevant disclosures.
References
- 1.Nakahara T, Dweck MR, Narula N, Pisapia D, Narula J, Strauss HW. Coronary Artery Calcification: From Mechanism to Molecular Imaging. JACC Cardiovasc Imaging. 2017;10:582–593. doi: 10.1016/j.jcmg.2017.03.005. [DOI] [PubMed] [Google Scholar]
- 2.Detrano R, Guerci AD, Carr JJ, Bild DE, Burke G, Folsom AR, Liu K, Shea S, Szklo M, Bluemke DA, O’Leary DH, Tracy R, Watson K, Wong ND, Kronmal RA. Coronary calcium as a predictor of coronary events in four racial or ethnic groups. N Engl J Med. 2008;358:1336–1345. doi: 10.1056/NEJMoa072100. [DOI] [PubMed] [Google Scholar]
- 3.Greenland P, LaBree L, Azen SP, Doherty TM, Detrano RC. Coronary artery calcium score combined with Framingham score for risk prediction in asymptomatic individuals. JAMA. 2004;291:210–215. doi: 10.1001/jama.291.2.210. [DOI] [PubMed] [Google Scholar]
- 4.Hoffmann U, Massaro JM, D’Agostino RB, Kathiresan S, Fox CS, O’Donnell CJ. Cardiovascular event prediction and risk reclassification by coronary, aortic, and valvular calcification in the Framingham Heart Study. J Am Heart Assoc. 2016;5:e003144. doi: 10.1161/JAHA.115.003144. [DOI] [PMC free article] [PubMed] [Google Scholar]
- 5.Sangiorgi G, Rumberger JA, Severson A, Edwards WD, Gregoire J, Fitzpatrick LA, Schwartz RS. Arterial calcification and not lumen stenosis is highly correlated with atherosclerotic plaque burden in humans: a histologic study of 723 coronary artery segments using nondecalcifying methodology. J Am Coll Cardiol. 1998;31:126–133. doi: 10.1016/s0735-1097(97)00443-9. [DOI] [PubMed] [Google Scholar]
- 6.Agatston AS, Janowitz WR, Hildner FJ, Zusmer NR, Viamonte M, Detrano R. Quantification of coronary artery calcium using ultrafast computed tomography. J Am Coll Cardiol. 1990;15:827–832. doi: 10.1016/0735-1097(90)90282-t. [DOI] [PubMed] [Google Scholar]
- 7.Bittencourt MS, Hulten E, Ghoshhajra B, O’Leary D, Christman MP, Montana P, Truong QA, Steigner M, Murthy VL, Rybicki FJ, Nasir K, Gowdak LHW, Hainer J, Brady TJ, Di Carli MF, Hoffmann U, Abbara S, Blankstein R. Prognostic value of nonobstructive and obstructive coronary artery disease detected by coronary computed tomography angiography to identify cardiovascular events. Circ Cardiovasc Imaging. 2014;7:282–291. doi: 10.1161/CIRCIMAGING.113.001047. [DOI] [PubMed] [Google Scholar]
- 8.Mancini GBJ, Hartigan PM, Shaw LJ, Berman DS, Hayes SW, Bates ER, Maron DJ, Teo K, Sedlis SP, Chaitman BR, Weintraub WS, Spertus JA, Kostuk WJ, Dada M, Booth DC, Boden WE. Predicting outcome in the COURAGE trial (Clinical Outcomes Utilizing Revascularization and Aggressive Drug Evaluation): coronary anatomy versus ischemia. JACC Cardiovasc Interv. 2014;7:195–201. doi: 10.1016/j.jcin.2013.10.017. [DOI] [PubMed] [Google Scholar]
- 9.Bartel AG, Chen JT, Peter RH, Behar VS, Kong Y, Lester RG. The significance of coronary calcification detected by fluoroscopy. A report of 360 patients. Circulation. 1974;49:1247–1253. doi: 10.1161/01.cir.49.6.1247. [DOI] [PubMed] [Google Scholar]
- 10.Budoff MJ, Georgiou D, Brody A, Agatston AS, Kennedy J, Wolfkiel C, Stanford W, Shields P, Lewis RJ, Janowitz WR, Rich S, Brundage BH. Ultrafast Computed Tomography as a Diagnostic Modality in the Detection of Coronary Artery Disease : A Multicenter Study. Circulation. 1996;93:898–904. doi: 10.1161/01.cir.93.5.898. [DOI] [PubMed] [Google Scholar]
- 11.Williams M, Shaw LJ, Raggi P, Morris D, Vaccarino V, Liu ST, Weinstein SR, Mosler TP, Tseng PH, Flores FR, Nasir K, Budoff M. Prognostic value of number and site of calcified coronary lesions compared with the total score. JACC Cardiovasc Imaging. 2008;1:61–69. doi: 10.1016/j.jcmg.2007.09.001. [DOI] [PubMed] [Google Scholar]
- 12.Brown ER, Kronmal RA, Bluemke DA, Guerci AD, Carr JJ, Goldin J, Detrano R. Coronary calcium coverage score: determination, correlates, and predictive accuracy in the Multi-Ethnic Study of Atherosclerosis. Radiology. 2008;247:669–675. doi: 10.1148/radiol.2473071469. [DOI] [PMC free article] [PubMed] [Google Scholar]
- 13.Blaha MJ, Budoff MJ, Tota-Maharaj R, Dardari ZA, Wong ND, Kronmal RA, Eng J, Post WS, Blumenthal RS, Nasir K. Improving the CAC score by addition of regional measures of calcium distribution: Multi-Ethnic Study of Atherosclerosis. JACC Cardiovasc Imaging. 2016;9:1407–1416. doi: 10.1016/j.jcmg.2016.03.001. [DOI] [PMC free article] [PubMed] [Google Scholar]
- 14.Hoffmann U, Massaro JM, Fox CS, Manders E, O’Donnell CJ. Defining normal distributions of coronary artery calcium in women and men (from the Framingham Heart Study) Am J Cardiol. 2008;102:1136-41–1141.e1. doi: 10.1016/j.amjcard.2008.06.038. [DOI] [PMC free article] [PubMed] [Google Scholar]
- 15.Leipsic J, Abbara S, Achenbach S, Cury R, Earls JP, Mancini GJ, Nieman K, Pontone G, Raff GL. SCCT guidelines for the interpretation and reporting of coronary CT angiography: a report of the Society of Cardiovascular Computed Tomography Guidelines Committee. J Cardiovasc Comput Tomogr. 2014;8:342–358. doi: 10.1016/j.jcct.2014.07.003. [DOI] [PubMed] [Google Scholar]
- 16.Kannel WB, Feinleib M, McNamara PM, Garrison RJ, Castelli WP. An investigation of coronary heart disease in families. The Framingham offspring study. Am J Epidemiol. 1979;110:281–290. doi: 10.1093/oxfordjournals.aje.a112813. [DOI] [PubMed] [Google Scholar]
- 17.Splansky GL, Corey D, Yang Q, Atwood LD, Cupples LA, Benjamin EJ, D’Agostino RB, Fox CS, Larson MG, Murabito JM, O’Donnell CJ, Vasan RS, Wolf PA, Levy D. The Third Generation Cohort of the National Heart, Lung, and Blood Institute’s Framingham Heart Study: design, recruitment, and initial examination. Am J Epidemiol. 2007;165:1328–1335. doi: 10.1093/aje/kwm021. [DOI] [PubMed] [Google Scholar]
- 18.D’Agostino RB, Vasan RS, Pencina MJ, Wolf PA, Cobain M, Massaro JM, Kannel WB. General cardiovascular risk profile for use in primary care: the Framingham Heart Study. Circulation. 2008;117:743–753. doi: 10.1161/CIRCULATIONAHA.107.699579. [DOI] [PubMed] [Google Scholar]
- 19.Goff DC, Lloyd-Jones DM, Bennett G, Coady S, D’Agostino RB, Gibbons R, Greenland P, Lackland DT, Levy D, O’Donnell CJ, Robinson JG, Schwartz JS, Shero ST, Sorlie P, Stone NJ, Wilson PWF, Jordan HS, Nevo L, Wnek J, Anderson JL, Halperin JL, Albert NM, Bozkurt B, Brindis RG, Curtis LH, DeMets D, Hochman JS, Kovacs RJ, Ohman EM, Pressler SJ, Sellke FW, Shen W-K, Smith SC, Tomaselli GF. 2013 ACC/AHA guideline on the assessment of cardiovascular risk: a report of the American College of Cardiology/American Heart Association Task Force on Practice Guidelines. Circulation. 2014;129:S49–S73. doi: 10.1161/01.cir.0000437741.48606.98. [DOI] [PubMed] [Google Scholar]
- 20.Pencina MJ, D’Agostino RB, Pencina KM, Janssens ACJW, Greenland P. Interpreting incremental value of markers added to risk prediction models. Am J Epidemiol. 2012;176:473–481. doi: 10.1093/aje/kws207. [DOI] [PMC free article] [PubMed] [Google Scholar]
- 21.Schuijf JD, Wijns W, Jukema JW, Decramer I, Atsma DE, de Roos A, Stokkel MPM, Dibbets-Schneider P, van der Wall EE, Bax JJ. A comparative regional analysis of coronary atherosclerosis and calcium score on multislice CT versus myocardial perfusion on SPECT. J Nucl Med. 2006;47:1749–1755. [PubMed] [Google Scholar]
- 22.Qian Z, Anderson H, Marvasty I, Akram K, Vazquez G, Rinehart S, Voros S. Lesion- and vessel-specific coronary artery calcium scores are superior to whole-heart Agatston and volume scores in the diagnosis of obstructive coronary artery disease. J Cardiovasc Comput Tomogr. 2010;4:391–399. doi: 10.1016/j.jcct.2010.09.001. [DOI] [PubMed] [Google Scholar]
- 23.Tota-Maharaj R, Al-Mallah MH, Nasir K, Qureshi WT, Blumenthal RS, Blaha MJ. Improving the relationship between coronary artery calcium score and coronary plaque burden: Addition of regional measures of coronary artery calcium distribution. Atherosclerosis. 2015;238:126–131. doi: 10.1016/j.atherosclerosis.2014.11.008. [DOI] [PubMed] [Google Scholar]
- 24.Silverman MG, Harkness JR, Blankstein R, Budoff MJ, Agatston AS, Carr JJ, Lima JA, Blumenthal RS, Nasir K, Blaha MJ. Baseline subclinical atherosclerosis burden and distribution are associated with frequency and mode of future coronary revascularization: multi-ethnic study of atherosclerosis. JACC Cardiovasc Imaging. 2014;7:476–486. doi: 10.1016/j.jcmg.2014.03.005. [DOI] [PMC free article] [PubMed] [Google Scholar]
- 25.Grunfeld C, Scherzer R, Varosy PD, Ambarish G, Nasir K, Budoff M. Relation of coronary artery plaque location to extent of coronary artery disease studied by computed tomographic angiography. J Cardiovasc Comput Tomogr. 2010;4:19–26. doi: 10.1016/j.jcct.2010.01.009. [DOI] [PubMed] [Google Scholar]
- 26.Schmermund A, Möhlenkamp S, Baumgart D, Kriener P, Pump H, Grönemeyer D, Seibel R, Erbel R. Usefulness of topography of coronary calcium by electron-beam computed tomography in predicting the natural history of coronary atherosclerosis. Am J Cardiol. 2000;86:127–132. doi: 10.1016/s0002-9149(00)00847-x. [DOI] [PubMed] [Google Scholar]
- 27.Wang JC, Normand S-LT, Mauri L, Kuntz RE. Coronary artery spatial distribution of acute myocardial infarction occlusions. Circulation. 2004;110:278–284. doi: 10.1161/01.CIR.0000135468.67850.F4. [DOI] [PubMed] [Google Scholar]
- 28.Parikh NI, Honeycutt EF, Roe MT, Neely M, Rosenthal EJ, Mittleman MA, Carrozza JP, Ho KKL. Left and codominant coronary artery circulations are associated with higher in-hospital mortality among patients undergoing percutaneous coronary intervention for acute coronary syndromes: report From the National Cardiovascular Database Cath Percutaneous Coronary Intervention (CathPCI) Registry. Circ Cardiovasc Qual Outcomes. 2012;5:775–782. doi: 10.1161/CIRCOUTCOMES.111.964593. [DOI] [PubMed] [Google Scholar]
- 29.Veltman CE, van der Hoeven BL, Hoogslag GE, Boden H, Kharbanda RK, de Graaf MA, Delgado V, van Zwet EW, Schalij MJ, Bax JJ, Scholte AJHA. Influence of coronary vessel dominance on short-and long-term outcome in patients after ST-segment elevation myocardial infarction. Eur Heart J. 2015;36:1023–1030. doi: 10.1093/eurheartj/ehu236. [DOI] [PubMed] [Google Scholar]
- 30.Veltman CE, de Graaf FR, Schuijf JD, van Werkhoven JM, Jukema JW, Kaufmann PA, Pazhenkottil AP, Kroft LJ, Boersma E, Bax JJ, Schalij MJ, van der Wall EE. Prognostic value of coronary vessel dominance in relation to significant coronary artery disease determined with non-invasive computed tomography coronary angiography. Eur Heart J. 2012;33:1367–1377. doi: 10.1093/eurheartj/ehs034. [DOI] [PubMed] [Google Scholar]
- 31.Gebhard C, Fuchs TA, Stehli J, Gransar H, Berman DS, Budoff MJ, Achenbach S, Al-Mallah M, Andreini D, Cademartiri F, Callister TQ, Chang H-J, Chinnaiyan KM, Chow BJW, Cury RC, Delago A, Gomez MJ, Hadamitzky M, Hausleiter J, Hindoyan N, Feuchtner G, Kim Y-J, Leipsic J, Lin FY, Maffei E, Pontone G, Raff G, Shaw LJ, Villines TC, Dunning AM, Min JK, Kaufmann PA. Coronary dominance and prognosis in patients undergoing coronary computed tomographic angiography: results from the CONFIRM (COronary CT Angiography EvaluatioN For Clinical Outcomes: An InteRnational Multicenter) registry. Eur Heart J Cardiovasc Imaging. 2015;16:853–862. doi: 10.1093/ehjci/jeu314. [DOI] [PMC free article] [PubMed] [Google Scholar]
Associated Data
This section collects any data citations, data availability statements, or supplementary materials included in this article.


