Abstract
This paper presents a 6-DOF pose estimation (PE) method and an indoor wayfinding system based on the method for the visually impaired. The PE method involves two graph SLAM processes to reduce the accumulative pose error of the device. In the first step, the floor plane is extracted from the 3D camera’s point cloud and added as a landmark node into the graph for 6-DOF SLAM to reduce roll, pitch and Z errors. In the second step, the wall lines are extracted and incorporated into the graph for 3-DOF SLAM to reduce X, Y and yaw errors. The method reduces the 6-DOF pose error and results in more accurate pose with less computational time than the state-of-the-art planar SLAM methods. Based on the PE method, a wayfinding system is developed for navigating a visually impaired person in an indoor environment. The system uses the estimated pose and floorplan to locate the device user in a building and guides the user by announcing the points of interest and navigational commands through a speech interface. Experimental results validate the effectiveness of the PE method and demonstrate that the system may substantially ease an indoor navigation task.
I. Introduction
Visual impairment reduces a person’s independent mobility and severely deteriorates quality of life. According to the World Health Organization, there are ~285 million people with visual impairment, of which 39 million are blind. Because age-related diseases (such as glaucoma, macular degeneration, and diabetes) are the leading cause of vision loss and the world population is rapidly aging, more people will go blind in the coming decades. Therefore, there is a dire need in developing navigation aids to help the visually impaired move around and live independent lives. The issue of independent mobility of a visually impaired individual includes object/obstacle detection and wayfinding. Obstacle detection helps the traveler avoid bumping into anything, tripping, or falling, while wayfinding is to plan and follow a path towards the destination. Object detection may enhance wayfinding by providing waypoints for path planning and points of interest for situation awareness. In spite of substantial advancements in robotics and computer vision in the past decades, a navigation aid that can effectively address both object/obstacle detection and wayfinding is still beyond our reach. As a result, white cane remains the most popular mobility tool due to its powerful haptic feedback and low cost. However, a white cane cannot provide a “full picture” of its surroundings for object/obstacle detection and location information for wayfinding. Guide dog has also been used to guide a visually impaired person from one place to another. Unfortunately, a guide dog needs costly training and may be unaffordable to the blind. To address these limitations, a number of Robotic Navigation Aids (RNAs) have been introduced as alternative mobility tools. Most of the existing RNAs are intended for obstacle detection [1]–[5] only. These devices send out a beam of ultrasonic wave [1]–[3] or laser [4], [5] and determine the range and other object information based on the reflection of the beam. The object information is then conveyed to the user for obstacle avoidance. Due to the use of simple range sensors, these devices are incapable of object detection. RNAs with wayfinding function have been introduced in [6], [7]. They use GPS to guide a blind traveler and therefore only function well in an outdoor environment. The literature of RNA with indoor wayfinding capability is scarce and only limited success has been made. Moreover, none of the existing RNAs has successfully addressed both object detection and wayfinding problems at the same time. The main technical challenge is that both problems must be solved in a small platform with limited resources. In [6], a portable RNA is introduced. It is a computer-vision-enhanced white cane that uses a cane-fitted 3D time-of-flight camera for both object/obstacle [9] detection and wayfinding [12] in indoor environments.
This paper is concerned with independent mobility for the visually impaired in indoor environments. An indoor environment usually has a higher obstacle density than an open outdoor space and often contains overhanging objects. Therefore, 3D perception is needed for obstacle/object detection. Also, an indoor environment is GPS-denied. The existing GPS-based blind navigation technology [6] cannot be used. However, an indoor environment may offer off-board computing support for real-time computation. To address the challenges and take the advantage of indoor navigation, we introduce an RNA with a client-server architecture (described in III) for real-time wayfinding in this paper. The RNA is a computer vision enhanced white cane that uses a 3D camera— SwissRanger SR4000—for perception. It provides two navigational functions—wayfinding and 3D object detection—to its user. This paper will focus itself on the wayfinding function that uses a new Pose Estimation (PE) method to locate the user in a floorplan and guides the user to the destination. The PE problem is also known as Simultaneous Localization and Mapping (SLAM). An overview on the related work in RNAs and SLAM is given in this Section.
A. Related Wayfinding Methods for RNAs
In the literature, researchers have attempted to address wayfinding problem in GPS-denied environments. But no substantial successes have been made up to date. Kulyukin et al. [13] introduce a Robotic Guide Dog (RGD) to lead the way for a blind traveler. They use a number of RFID tags, deployed at some waypoints, to navigate the RGD from one point to another. Each RFID tag stores the information about its location and the directions to the neighboring tags. The RGD uses an RFID reader to detect a tag and retrieve the stored information, based on which it determines its location and the desired movement towards the next tag until arriving at the destination. The RGD lacks portability and the wayfinding method requires reengineering the environment. Hesch et al. [14] propose a portable indoor localization aid for 6-DOF PE. An Extended Kalman Filter (EKF) is employed to estimate the device pose by fusing the data of three disparate sensors: a 3-axis gyro, a 2D LIDAR and a pedometer. The gyro and LIDAR are installed on the device while the pedometer is user-worn. The EKF predicts the next device pose based on the gyro and pedometer data and computes the prediction (the laser scan for the predicted pose). The actual laser scan is then acquired and the innovation is used to update the device pose. This method requires corner features for laser scan matching. It may fail in a geometrically featureless environment (e.g., flat floor). Also, it assumes that a map of the environment is available and the environment is vertical in order to compute the prediction.
B. Related Work in SLAM
Existing SLAM methods in the robotics literature can be used for wayfinding. These methods can be broadly classified into two categories: state filter based SLAM [15] and pose- graph SLAM [17], [18], [19], [20], [21]. The latter is preferred in this work, because it can effectively reduce the pose error at a loop-closing point. A number of SLAM algorithms have been used by wearable RNAs [28]–[30]. Saez et al. [28] propose a Visual-SLAM (VSLAM) algorithm for 6-DOF PE of a wearable RNA with a stereo camera. In the front-end, the camera’s egomotion (pose change between two camera views) is estimated by a Visual Odometry (VO) algorithm [31] and in the back-end, the camera’s pose is determined by minimizing an entropy-based cost function. In [29], a metric- topological SLAM method is proposed to estimate the pose of a stereovision-based wearable RNA. The method extracts and tracks features in the stereo camera’s images step by step and uses a FastSLAM [16] algorithm to update the local metric maps and the global topological relations between the maps. As a stereo camera cannot provide complete depth data of the scene, these RNAs are not suitable for object detection. To address this problem, an RGB-D camera is used in a wearable RNA in [30] due to its capability in providing more reliable depth data in a feature-sparse environment. Similar to [28], visual features are extracted and associated across images for egomotion estimation and a bundle-adjustment [32] algorithm is employed to estimate the camera’s pose. In [19], real-time camera pose estimation is made possible by splitting tracking and mapping into two separate tasks and processing them in two parallel threads on a dual-core computer. Most recently, SLAM methods based on whole image alignment, instead of visual feature matching, are introduced for real- time camera tracking and reconstruction on GPU [20] and CPU [21]. However, this type of methods, aka direct methods, usually results in less accurate pose estimate than a feature based SLAM method.
The abovementioned SLAM methods accrue pose error over time. Loop-closure [17], [18] technique may be used to remove the accrued error at a loop-closing point if one exists. However, the pose error accumulated before such a point is detected may be large enough to break down the RNA’s wayfinding function. To address this problem, geometric features of the operating environment have been incorporated in an EKF-SLAM process in [11], [12], [33] and a pose-graph SLAM process in [22], [23] to mitigate the accumulative pose error. The methods in [22], [23] require extraction of multiple intersecting planes from 3D point data, a time-consuming process in case of data with a low inlier ratio. Therefore, they are not suitable for an RNA that needs real-time PE.
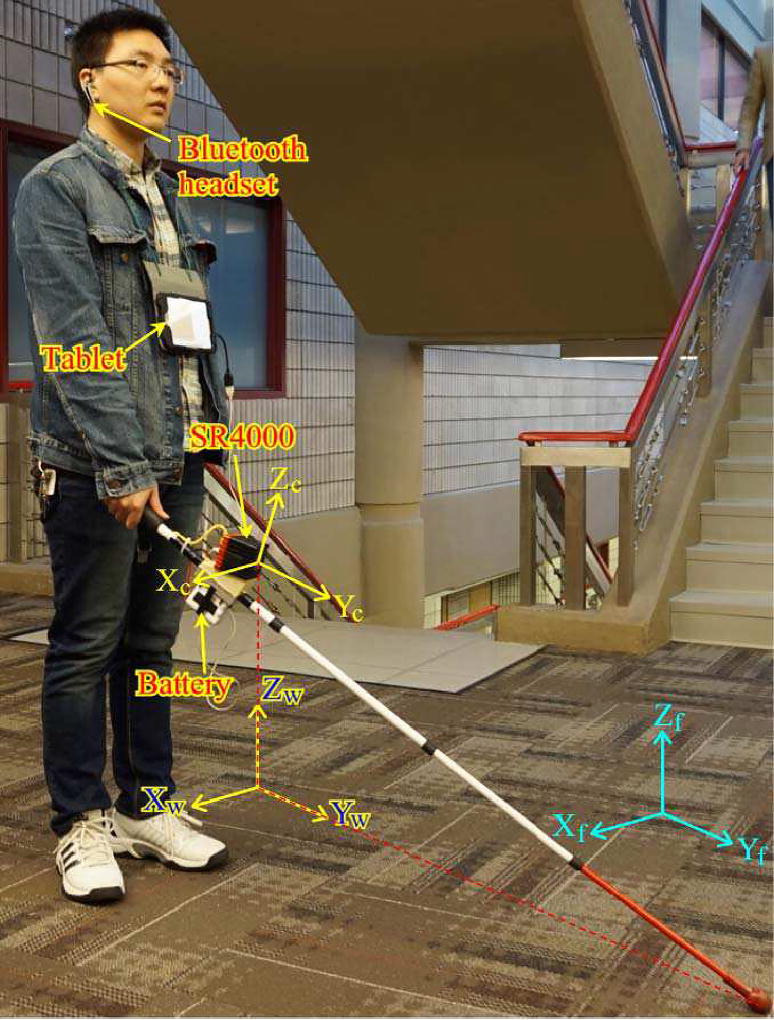
In this paper, we propose a 2-step pose-graph SLAM method for real-time wayfinding of an RNA. In the first step, the method extracts the floor plane from the 3D point cloud of the RNA’s 3D camera and incorporates the floor plane as a landmark in a 3D pose-graph SLAM process to reduces Z error as well as roll and pitch errors (see Fig. 1 for coordinate definition). In the second step, the data points are projected onto the floor plane for wall line detection. The detected wall lines are then used by a 2D SLAM process (implemented on XOY plane) to reduce X, Y and yaw errors. The 2-step SLAM method reduces the device’s 6-DOF pose error with a smaller computational time than the plane-based SLAM method [22]. Using the proposed SLAM method, we developed a wayfinding system that can be used to navigate a visually impaired person in an indoor environment.
Fig. 1.
The Smart Cane and its coordinate systems: the camera, floor plane and world coordinates are denoted by subscripts c, f, and w, respectively.
II. RNA Prototype and 3D Camera
The RNA, called Smart Cane (SC), is depicted in Fig. 1. It uses a SwissRanger SR4000 for 3D perception. The SR4000 is a 3D time-of-flight camera. It has a spatial resolution of 176×144 pixels and a field-of-view of 43.6°×34.6°. The camera illuminates its environment with modulated infrared light. Based on phase shift measurement, it detects a range up to 5 meters (with a ±1 cm accuracy) for every pixel on the imaging plane. The SR4000 produces both range data and intensity image simultaneously at a rate up to 50 FPS. The capability of producing complete range data and the small dimension (50×48×65 mm3) makes the SR4000 ideal for the SC. Its modulation frequency is programmable to allow simultaneous use of multiple cameras without interference. The SR4000 is mounted on the white cane with a 18° tilt-up angle to keep the cane out of the camera’s field-of-view. The camera is configured at the software-trigger-mode. It sends out a frame of intensity and range data when an acquisition command is received. A client-server architecture is used to allow real-time wayfinding computation. A HP Stream 7 32GB Windows 8.1 tablet computer is used as the client. It performs tasks with light computation, These include acquiring data from the camera, relaying the data to the server computer, and providing a speech interface for human-device interaction. A Lenovo ThinkPad T430 laptop computer (with an Intel Core i5-3320M CPU and 8GB memory) is used as the server. It performs the computation-intensive wayfinding task—the proposed SLAM method. The laptop’s graphics card (NVS 5400M with 96 CUDA cores) is used to speed up the SLAM computation. The laptop runs Ubuntu 12.04 64-bit as its OS. The client accesses the server via WiFi for wayfinding service. The software of the wayfinding system is described in III. The camera, world, and floor plane coordinate systems, XcYcZc, XwYwZw, Xf Yf Zf of the SC are defined in Fig. 1. For simplicity, we drop subscript w and use XYZ to denote the world coordinate system from now on. In this work, we use Euler angle with z-x-y rotation sequence (i.e., yaw-pitch-roll angles) to represent orientation.
III. Wayfinding System Description
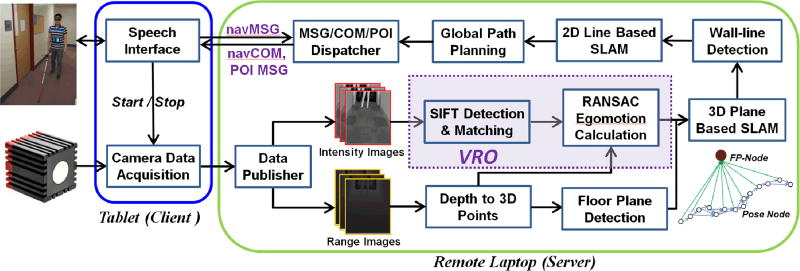
The wayfinding system’s software is depicted in Fig. 2. A client-server architecture is adopted. The client acquires data from the camera and sends it to the server via WiFi. It also communicates with the user through a speech interface. The server performs SLAM, uses the SLAM result to locate the user in a floorplan, plans the optimal path, and sends to the client a navigational command and POI message. The client then announces the command and message to the user by the speech interface. Some key modules of the wayfinding software are detailed as follows.
Fig. 2.
Wayfinding system software: navMSG—navigational message, navCOM—navigational command, FP-Node—floor plane node.
A. Speech Interface
A speech interface is developed for human-device interaction. On one hand, it receives an audio instruction from the user, converts it into a navigational message (e.g., “go to room 555”) by speech recognition, and sends the message to the server to start the wayfinding service. On the other hand, it receives a navigational command and POI message from the server, performs text-to-speech conversion, and makes announcement to the user. A navigational command indicates the needed action from the user, e.g., “go forward for 1 meter”, “turn left slowly”, etc. while a POI message indicates to the user what is nearby, e.g., “room 530 is on your left”.
B. Data Acquisition
A relatively larger camera integration time (8.3 ms) is used to produce intensity and range data with lower noise. A 3×3 Gaussian filter is applied to the data for noise reduction. To reduce WiFi data traffic, the camera’s 16-bit intensity image is converted into an 8-bit one and sent to the server along with the depth data. The depth data is then translated into a point cloud by using the camera model in the server side. These treatments result in a 594-Kb data size for each camera frame and thus a real-time data transmission over the 802.11g WiFi channel.
C. Visual-Range Odometry (VRO)
The VRO algorithm [25] is used to estimate the camera’s egomotion. The method extracts visual features from the current intensity image and matches them with those from the previous image to determine the camera’s egomotion between the two views. SIFT feature descriptors [35] is used for feature matching and siftGPU [24] is used to speed up feature extraction and matching and achieve a ~30-ms runtime for the VRO. A detailed description of the VRO is given in IV.
D. 2-STEP Graph SLAM
The 2-step SLAM method first extracts the floor plane from the camera’s point cloud data and incorporates the floor plane as a landmark in a 3D graph SLAM process to reduce pitch, roll and Z errors. It then projects the point data onto the extracted floor plane to detect the wall lines and incorporates them in a 2D graph SLAM (in XOY plane) process to reduce yaw, X and Y errors. The 2-step SLAM method exploits geometric features—floor plane and wall lines—to reduce the camera’s 6-DOF pose error. The 2-step SLAM method is detailed in V.
E. Global Path Planning
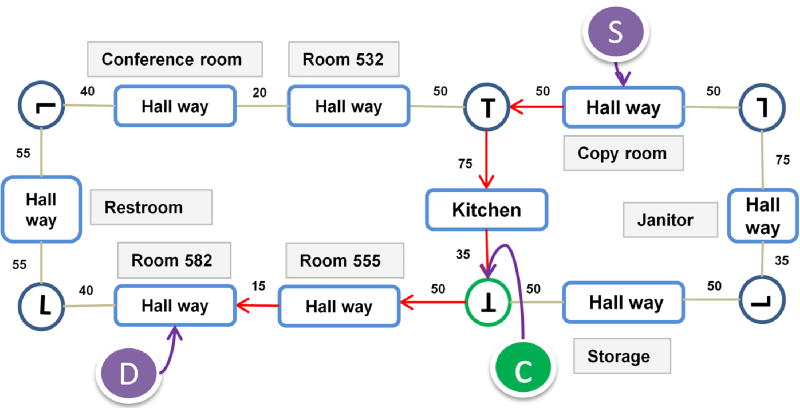
The global path planning module finds the shortest path between the starting point and destination by applying the A* algorithm to a POI-graph. The POI-graph takes the POIs (hallway junctions, rooms, etc.) of a floorplan as its nodes and each edge connecting two nodes has a weight equal to the distance between the nodes. Taking the floorplan of the 5th floor of the EIT building as an example, the POI graph is shown in Fig. 3. The shortest path from the copy room to RM 582 is depicted by the red arrows. At each POI, a navigational message is generated based on the current location and the next POI. For example, the next POI for the T-junction labeled by C is RM 555. Therefore, the navigational message is “turn right slowly”. This message is dispatched to the speech interface in the client and translated into an audio message for the user.
Fig. 3.
POIs based graph for path planning
IV. Visual-Range Odometry
The VRO algorithm estimates the egomotion (pose change) between two camera views. The estimated poses are then used to construct a pose graph for SLAM by the proposed method. The VRO’s operating principle and egomotion estimation performance are presented in this Section.
A. Operating principle
The VRO extracts SIFT features from the current intensity image and matches them to those from the previous intensity image based on the SIFT feature descriptors. SIFT descriptor is used in this work because it produces more reliable feature match than other scale-invariant descriptors [37]. As the matched features’ 3D coordinates are known from the camera’s 3D point data, the feature-matching process results in two 3D point sets, {ai} and {bi} for i = 1, ⋯, N. The rotation and translation matrices, R and t, between the two images are determined by minimizing the following error residual
| (1) |
This least-squares data fitting problem is solved by the Singular Value Decomposition (SVD) method [36]. As the feature matching process may result in incorrect matches (outliers), the following RANSAC process is used to reject the outliers:
Detect SIFT features in two consecutive intensity images, find the matched features and form the corresponding 3D data sets {ai} and {bj}. Repeat steps 2 & 3 for K times.
Draw a sample by randomly selecting 4 associated pointpairs, {am} and {bm} for m = 1, ⋯, 4, from the two point sets and find the least-squares rotation and translation matrices (Rk and tk) for {am} and {bm}.
Project the entire point set {bi} onto {ai} by using Rk and tk and compute error for each point-pair. Sk = Sk +1 if is below a threshold (Sk is the score for this transform).
The transformation with max(Sk) is recorded. The corresponding point sets {aj} and {bj} for j = 1, ⋯, max(Sk), called inliers, are used to compute the maximum likelihood estimate R and t of the camera by the SVD method. The camera’s pose change is then determined.
Given the true inlier ratio ε, the minimum K required to ensure, with confidence ζ, that point sets {aj} and {bj} are outlier-free, is computed by
| (2) |
In this paper, m = 4 and ζ = 0.99 are used. As ε is a priori unknown, it is estimated at each repetition using the sample with the largest support.
B. Accuracy and Repeatability
Noises in the SR4000’s intensity and range data may produce error in egomotion estimation. In this work, a 3×3 low-pass Gaussian filter (σ = 1) was applied to the camera’s intensity and range data. The filter reduces the overall noise levels (the mean noise ratio) of the intensity and range data by 57% and 63%, respectively.
Using an in-house built motion table to produce ground truth rotation and translation simultaneously for the camera, we characterized the VRO’s Pose Change Estimation (PCE) accuracy and repeatability. In this work, we use roll ϕ, pitch θ and yaw φ (Y-X-Z Euler angles) to represent camera orientation. Tables I and II summarize the PCE errors with individual movement in ϕ, θ, φ, X, and Y. In this study, we used a series of roll/pitch/yaw movements (range: 3°~18°, step size: 3°) or X/Y movements (range: 100~400 mm, step size: 100 mm) for data collection. 540 frames were captured from the camera in a typical office environment before and after each rotation/translation movement for computing the mean and standard deviation of the errors. From the tables, we can see that most of the mean and standard deviations of the errors are within the SR4000’s angular resolution (0.24°) and absolute accuracy (±10 mm). The mean and standard deviation of a rotation measurement (the 2nd group of data in Table I) increase with an increasing pitch angle. This is because the pitch movement increases the incident angle of the light, causing a weaker reflection and larger noise and thus a larger mean error and standard deviation. This problem can accelerate the growth of pose error when the VRO-computed pose changes are integrated into the SC pose in the world coordinate. In this paper, the accumulative pose error is reduced by using geometric features (floor plane and wall-lines) extracted from the SR4000’s point cloud data.
TABLE I.
PCE Errors in Rotation Measurement
| MV: (μ, σ) | Roll ϕ (°) | Pitch θ (°) | Yaw φ (°) |
|---|---|---|---|
|
| |||
| TV: (ϕ, θ, φ) | |||
|
| |||
| (3, 0, 0) | (0.17, 0.11) | (0.06, 0.07) | (0.04, 0.06) |
| (6, 0, 0) | (0.16, 0.10) | (0.02, 0.06) | (0.03, 0.07) |
| (9, 0, 0) | (0.07, 0.10) | (0.07, 0.06) | (0.05, 0.06) |
| (12, 0, 0) | (0.02, 0.11) | (0.09, 0.07) | (0.01, 0.07) |
| (15, 0, 0) | (0.00, 0.10) | (0.05, 0.08) | (0.11, 0.09) |
|
| |||
| (0, 3, 0) | (0.05, 0.03) | (0.42, 0.06) | (0.08, 0.05) |
| (0, 6, 0) | (0.06, 0.04) | (0.40, 0.10) | (0.08, 0.06) |
| (0, 9, 0) | (0.08, 0.04) | (0.53, 0.16) | (0.10, 0.07) |
| (0, 12, 0) | (0.13, 0.06) | (0.76, 0.22) | (0.31, 0.13) |
| (0, 15 0) | (0.25, 0.06) | (0.91, 0.34) | (0.26, 0.15) |
|
| |||
| (0, 0, 3) | (0.02, 0.07) | (0.09, 0.13) | (0.17, 0.11) |
| (0, 0, 6) | (0.02, 0.08) | (0.09, 0.14) | (0.21, 0.11) |
| (0, 0, 9) | (0.01, 0.08) | (0.18, 0.16) | (0.14, 0.16) |
| (0, 0, 12) | (0.03, 0.09) | (0.18, 0.20) | (0.15, 0.22) |
| (0, 0, 15) | (0.01, 0.12) | (0.22, 0.22) | (0.23, 0.27) |
MV: Measured Values, TV: True Values, μ: mean error, σ: standard deviation, ϕ, θ, and φ mean Δϕ, Δθ and Δφ (Δ is dropped for simplicity).
TABLE II.
PCE Errors in Translation Measurement
| MV: (μ, σ) | X (mm) | Y (mm) | Z (mm) |
|---|---|---|---|
|
| |||
| TV: (X, Y, Z) | |||
|
| |||
| (100, 0, 0) | (9.8, 4.0) | (0.4, 1.4) | (3.3, 2.4) |
| (200, 0, 0) | (5.6, 5.5) | (2.7, 1.7) | (3.9, 2.9) |
| (300, 0, 0) | (10.5, 5.2) | (3.4, 1.6) | (7.7, 3.6) |
| (400, 0, 0) | (2.8, 8.9) | (4.7, 2.7) | (6.9, 6.8) |
|
| |||
| (0, 100, 0) | (1.4, 2.8) | (4.3, 1.7) | (3.4, 2.7) |
| (0, 200, 0) | (2.8, 2.8) | (6.2, 1.7) | (2.5, 3.1) |
| (0, 300, 0) | (0.9, 2.7) | (7.7, 1.8) | (0.3, 3.5) |
| (0, 400, 0) | (3.3, 3.1) | (9.5, 1.8) | (3.3, 3.7) |
MV: Measured Values, TV: True Values, μ: mean error, σ: standard deviation, X, Y, Z: changes of position (Δ is dropped for simplicity).
We have also characterized the VRO with combined rotation and translation movements. The first combination consists of pitch and yaw rotations and Y translation and the second combination consists of pitch and yaw rotations and X translation. The quantitative results we obtained are similar to Tables I and II, meaning that the overall PE accuracy and repeatability of the VRO with combinatory motion are equally good. For simplicity, the results are omitted here. Reader are referred to [37] for details. The histogram plots of the PCE error demonstrate that each PCE error follow a Gaussian distribution.
V. 2-STEP Graph SLAM
The SR4000’s tilt angle for the SC is a trade-off between the need of a large look-ahead distance for object/obstacle detection and the need of more visual features on the intensity image. With the 18° tilt angle, there will be spurious data points on the upper portion of the image plane. This is because the SR4000 used in this work has a non-ambiguity range between 0 and 5 meters, meaning that a distance beyond 5 meters will be folded back to the non-ambiguity range due to the periodicity of the modulating signal. Fig. 4 shows the intensity and range data captured in an unobstructive hallway in the EIT building. There are noticeable noisy data within the rectangular area (marked in red in Figs. 4a and 4b). These data, with ambiguous range, forms a shape like a bowling pin when displayed as 3D point cloud (Fig. 4c). These spurious data can negatively impact wall plane extraction. In this work, we use an RANSAC based plane extraction algorithm [26]. After extraction of the floor plane (containing majority of the data points), the inlier ration of the remaining data become much lower. This may result in a long RANSAC process for wall plane extraction (according to (2)) and a less accurate extracted wall plane. To overcome this problem, we project the data points onto the extracted floor plane and extract wall lines in the 2D space. The wall line extraction process saves substantial computational time. We then use the floor plane in a 3D SLAM process and the wall line(s) in a 2D SLAM process to estimate the camera’s pose. Compare with a plane based graph SLAM algorithm [22], the 2-step SLAM method is more computationally efficient and results in a more accurate pose.
Fig. 4.
Intensity image (left), range image (middle); and color-coded point cloud data (right) of the SR4000.
A. Graph SLAM
A graph SLAM method consists of two steps: pose graph construction and pose graph optimization. A graph G contains nodes (camera poses) and edges between nodes. Let x = (x1, …, xN)T be a vector consisting of nodes x1, …, xN, where xi for i = 1, …, N is the camera pose at i. Let zij and Ωij be the mean and information matrix of a virtual measurement between nodes i and j. The virtual measurement is a transformation (i.e., pose change) between xi and xj. Let ẑij be the expected virtual measurement given xi and xj. The measurement error eij = zij − ẑij and the information matrix Ωij are used to describe edge Eij = < eij, Ωij > connecting nodes i and j. By assuming that all measurements are independent, the overall error of G is given by:
| (3) |
The solution to the graph SLAM problem is to find a set of nodes x* that minimizes (3). A numerical solution to the non-linear cost function can be obtained by using the Levenberg-Marquardt (LM) algorithm [34]. The LM approximates eij by its first order Taylor expansion around the initial guess x̃ for x*:
| (4) |
Here, Jij is the Jacobian of eij (x) computed at x̃. Substituting (4) into Fij (x) of (3), we obtain:
| (5) |
where and . Using this local approximation, (3) may be rewritten as
| (6) |
where a = Σij aij, b = Σij bij, and H = Σij Hij. It can be minimized in term of Δx by solving the linear system
| (7) |
where λ is a damping factor whose value is adjusted at each iteration by the LM algorithm. The linearized solution is then obtained by
| (8) |
The graph optimization process iterates the linearization in (6), the solution in (7) and the update step in (8) until an optimal x* is found.
B. Plane-Aided Graph SLAM (PAG-SLAM)
If the floor plane is detected at i with pose-node (P-node) xi, a floor-plane-node (FP-node) is added to the graph. In this paper, k = 1 because there is only one floor plane. The edge between xi and are added into G. The cost function is then:
| (9) |
where λf is the ratio of the total number of edges between the FP-node and the P-nodes to the total number of edges between the P-nodes of the graph. λf is used to balance the influences of the two types of edges on graph optimization. The virtual measurement between xi and is given by , where n is the floor plane’s normal vector and d is the distance between the floor plane and the origin of the camera’s coordinate system. n and d are computed from the extracted floor plane. We can follow the same graph SLAM procedure to minimize F (x) in (9) by using and . The computation of Eij = < eij, Ωij > and are detailed in the Appendixes A and B, respectively. Incorporating the floor plane in (9) for graph optimization reduces the camera’s pitch, roll and Z errors. The PAG-SLAM is a 3D (6-DOF) SLAM method.
C. Line-Aided Graph SLAM (LAG-SLAM)
After the PAG-SLAM, a refined pose x = {x, y, z, ϕ, θ, φ} for each node is obtained. As the floorplan’s coordinate system is aligned with XOY, the values of x, y and φ are then used by the LAG-SLAM.
1) Wall Line Detection
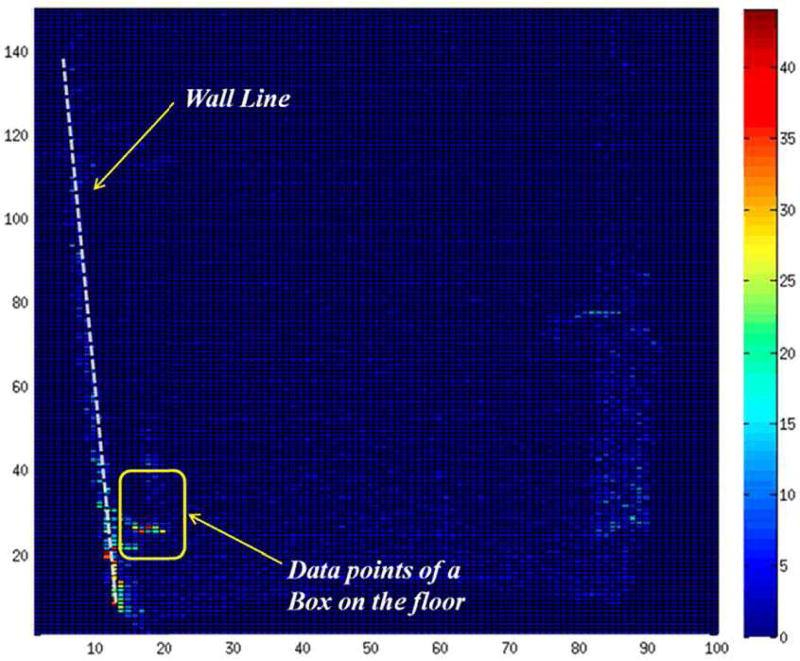
We discretize the extracted floor plane into 300×300 grid cells and project the 3D points onto the floor plane. The number of times the projected points fall into cell Cij is recorded and denoted by hij. A cell Cij is classified as a wall cell if hij is above threshold Th, or a non-wall cell, otherwise. A RANSAC-based line extraction algorithm is then applied to extract line(s) from the wall cells. A line with a length above threshold Tl (1.5 meters in this paper) is accepted as a wall line. Fig. 5 shows the color-coded plot of array h = {hij} and wall line extraction result for a point cloud data of a hallway in the ETAS building (see the second experiment in VI).
Fig. 5.
Wall line extraction by projecting data points onto the extracted floor plane. Spurious data, noise and the data of a box nearby the wall line on the floor are determined as outliers.
2) 2D Graph SLAM
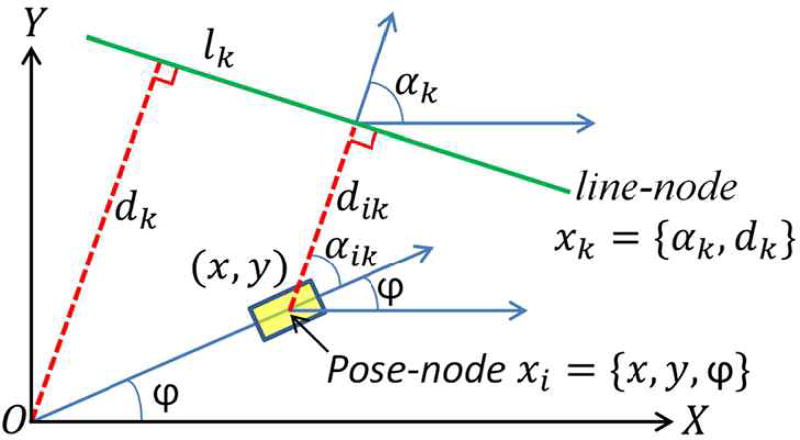
A 2D graph SLAM method is devised by incorporating wall line information in the graph consisting of P-nodes, line-nodes (L-nodes) and edges between them. As depicted in Fig. 6, a wall line is detected at pose-node xi = {x, y, φ}. As it is associated with a truth wall line Lk of a given floorplan, it is denoted lk and a line-node is added into the graph. Here, αk is the angle between the normal vector of lk and X axis and dk is the distance between lk and the origin of the coordinate system. Given the truth wall line of the floorplan, the mean virtual measurement between xi and can be computed as . Its expectation is given by . The edge between nodes xi and is then given by with
| (10) |
The Jacobian matrix is given by:
| (11) |
where
| (12) |
and
| (13) |
The cost function of the graph is:
| (14) |
where is an error vector containing the x, y and φ elements of eij, is a sub-matrixes of Ωij containing entries related to x, y and φ, and λl is the ratio of the total number of edges between the L-nodes and the P-nodes to the total number of edges between the P-nodes of the graph. The computation of is given in Appendix. C. We can use the same graph optimization procedure to minimize (14) by using and . Here, is a sub-matrixes of Jij containing entries related to x, y and φ. The use of wall line constraint in the graph helps to reduce x, y and yaw errors. The LAG-SLAM is a 2D (3-DOF) SLAM method.
Fig. 6.
Geometry of 2D Line
3) Graph Construction
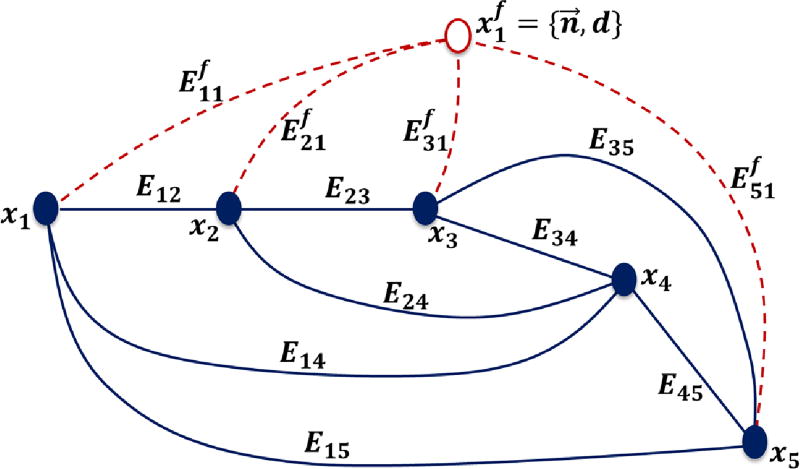
A graph of the PAG-SLAM consists of a set of P-nodes {x1, …, xN} and a FP-node . A P-node xi for i = 1, ⋯, N creates an edge Eij = < eij, Ωij > with each of the previous five P-nodes, denoted xj for j = i − 1, ⋯, i − 5, if one exists (i.e. if the VRO successfully compute a pose change between the two nodes). An FP-node is added into the graph at the first time the floor plane is detected with P-node xi. Since then, an edge is created whenever the floor plane is detected with P-node xi. A data association process is implemented for floor plane detection at time step i. First, the RANSAC plane extraction process finds the largest plane Pi = (n, d) (with the maximum data points) from the camera’s point cloud. Second, the predicted camera pose x̂i is obtained by using the pose estimates (from the graph optimization process at time step i −1) and the predicted floor plane observation P̂i = (n̂, d̂) is computed by using x̂i. Third, the innovation γi = Pi − P̂i is used for floor plane detection as follows: The predicted variance for γi is computed by , where η is the observation noise. If γi < 2sγ, Pi is detected as the floor plane; otherwise, it is not the floor plane. Fig. 7 depicts a graph with 5 P-nodes and 1 FP-node.
Fig. 7.
A graph with 5 P-nodes and 1 FP-node for PAG-SLAM.
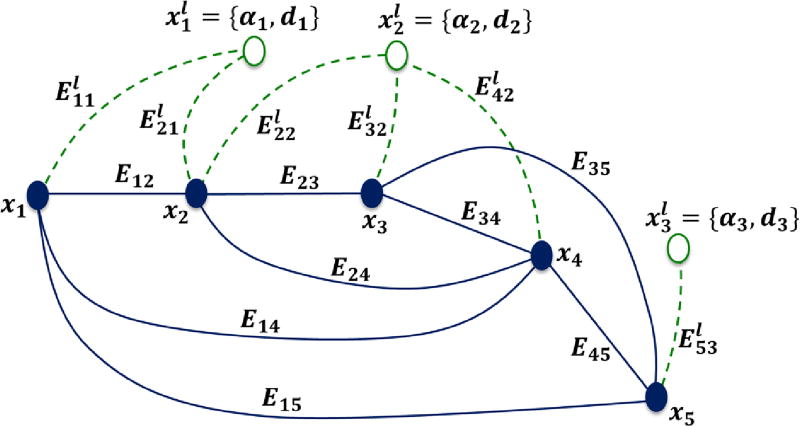
A graph of the LAG-SLAM consists of a set of P-nodes {x1, …, xN} and a set of L-nodes. The P-nodes and their edges are created in the same way as the PAG-SLAM. An L-node, for k = 1, ⋯, K, is added into the graph only if an extracted wall line is associated with a new truth wall line lk. An edge between P-node xi and L-node is created whenever a wall line extracted from the point cloud data with pose xi is associated with lk. Given a floorplan, a set of truth wall lines {l1, …, lk} are computed, where lk = (αk, dk) for k = 1, ⋯, K. These wall lines are then used to perform line association for graph construction. Fig. 8 shows a graph with 5 P-nodes and 3 L-nodes. A wall line is detected at i = 1 with P-node x1. Because it is associated with l1, L-node is added to the graph and edge is created. At P-node x2, two wall lines are detected with one associated with a new truth wall line l2 and the other one still associated with l1. As a result, a new L-node is added and two edges and are created. This process continues as a new camera data frame is acquired and processed. A data association process similar to that of floor plan detection is implemented for wall line detection. The details are omitted for conciseness.
Fig. 8.
A graph with 5 P-nodes and 3 L-nodes for LAG-SLAM.
VI. Experiments
We carried out experiments with the SC prototype in various indoor environments to validate the proposed method. First, the SIFT-based VRO method was compared with the direct VO algorithm of the LSD-SLAM [21] to show the advantage of the feature based method. Second, the proposed method was compared with the RGBD-SLAM [10] and planar SLAM [22] methods. Finally, we performed human subject study to test the efficacy of the wayfinding system as a whole.
1) Comparision of the SIFT-based and direct methods
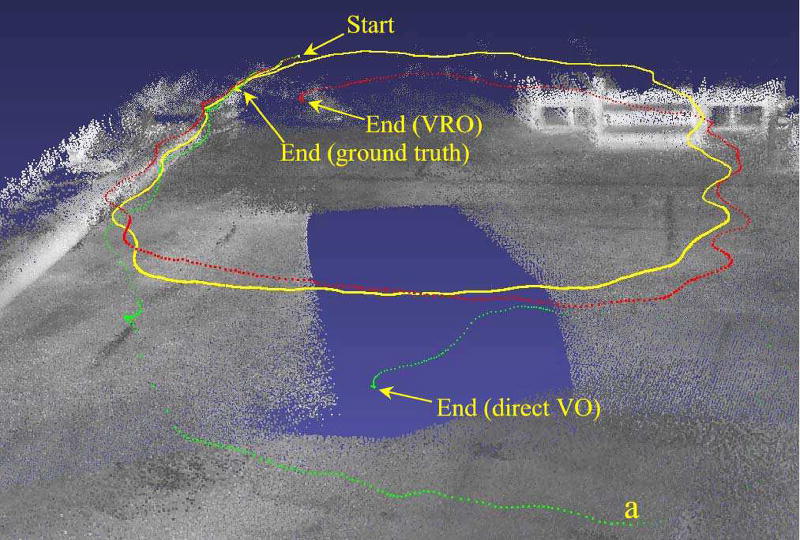
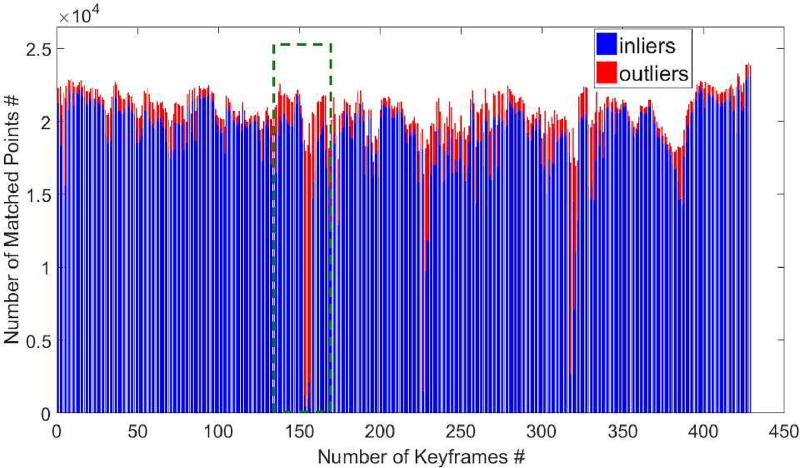
Like other direct method, the LSD-SLAM method aligns two whole images by minimizing their photometric error (i.e., intensity difference) to determine the pose change between the two views. Due to the local minimums of the error function, the direct VO of the LSD-SLAM method requires a good initialization (good initial motion estimate) and the pixel correspondences are not outlier-free. On the contrary, the VRO method does not need a good initialization and can completely remove outlier. As a result, the VRO results in a much more accurate PCE. In addition, the intensity of the SR4000’s image may change substantially as the camera’s orientation changes and make the direct VO less reliable. For performance comparison, we ran the VRO and direct VO on a data set collected by using the SC in our lab equipped with a motion capture system [12]. The SR4000’s ground truth trajectory (from the motion capture system) and trajectories produced by the two methods are depicted in Fig. 9. It can be seen that the VRO produced much more accurate poses than the direct VO. Using the ground truth pose changes, we determined the inliers and outliers for each pair of keyframes and the result of the direct VO is plotted in Fig. 10. We can see a substantial number of outliers at each keyframe. These outliers result in a larger PCE error. The plot for the VRO is not shown here as it is outlier-free. As the PCE errors generated by the VO are very big (Fig. 9) resulting in a graph with poor quality edges, it is not possible for the graph optimization process to illuminate the errors and produce accurate pose for each node. We ran the VRO based SLAM and LSD-SLAM methods in their entirety on the data collected from the human subject study (see VI.3). The results show that the pose graph optimization further deteriorated the pose estimates of the direct VO while improving that of the VRO. In the LSD-SLAM’s pose-graph, an edge with a large node-span (i.e., there are multiple nodes between the nodes of the edge) may incur a very large PCE error due to less accurate initialization. The graph optimization process propagates the PCE error to the nodes in between and increases those nodes’ pose errors. The results of the SLAM methods are omitted for conciseness.
Fig. 9.
The ground truth trajectory (yellow) and the trajectories generated by the VRO (red) and direct VO (green). The green trajectory is under the ground after point a due to large pose errors.
Fig. 10.
Inliers and outliers of the direct VO: the image alignment produced correspondences between the two 3D point sets. One point set was projected onto the other by using the ground truth pose change to determine outliers.
2) Comparison with RGBD-SLAM and Planar SLAM
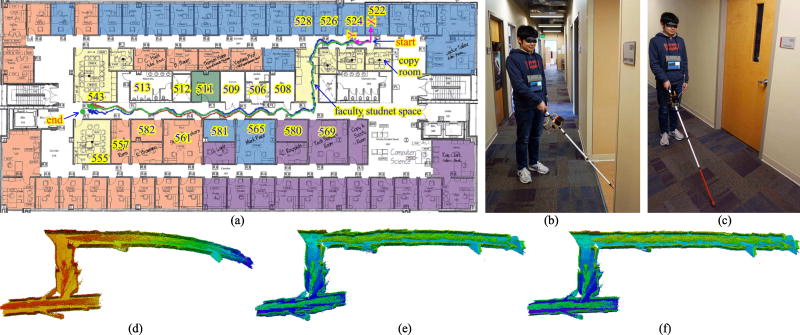
A number of experiments were performed in various environments. Two of them are shown here. The first environment was conducted on the 5th floor of the EIT building. The carpeted floor is feature-rich (Figs. 11b, 11c). The floorplan is depicted in Fig. 11a. The path-length for this experiment is 53.19 meters, from the start point (copy room) in the upper hallway to the end point (RM 555) in the middle hallway. The user walked with a speed of ~0.4 m/s and swung the SC while walking. The estimated trajectories of the RGBD-SLAM, planar SLAM and proposed methods are shown in red, green and blue, respectively. The Endpoint Position Error Norm (EPEN) of the proposed method (0.901 m or 1.69% of the path-length) is smaller than that of the planar SLAM (1.101 m or 2.07% of the path-length) and is much smaller than that of the RGBD-SLAM method (3.27 m or 6.15% of the path-length). Also, the estimate trajectory of the proposed method is the closest to the ground truth path. Using the poses estimated by each SLAM method, we registered the SR4000’s point data to build an octomap [27]. The octomaps (with the same view angle) generated by the three methods are shown in Figs. 11d, 11e and 11f. It can be seen that the map generated by the proposed method is of the best quality, indicating the most accurate PE along the path. The planar SLAM method results in less accurate poses than the proposed method due to the errors in the extracted wall planes.
Fig. 11.
Experiemnt 1 (5th floor, EIT building). (a) Trajectories produced by the three SLAM methods: RGBD-SLAM (red), planar SLAM (green), the proposed method (blue); (b) Human subject was turning left (at the 1st T-juntion) to the faculty student space; (c) Human subject was walking nearby RM 582; (d) Octomap of RGBD-SLAM; (e) Octomap of the planar SLAM; (f) Octomap of the proposed method;
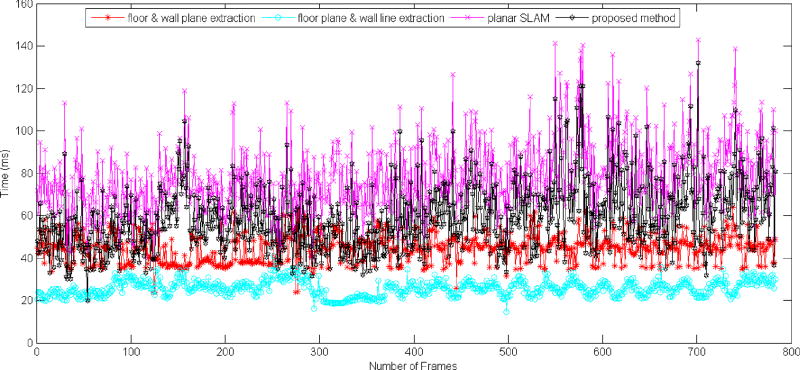
The runtimes of the proposed method and the planar SLAM method are compared in Fig. 12. The average runtime of the proposed method for one frame data is 59.4 ms (with a standard deviation of 16.0 ms) while that of the planar SLAM is 77.6 ms (with a standard deviation of 16.7 ms). The 30.6% runtime reduction was due to the fact that it took 42.9 ms to extract the floor plane and the wall plane(s) but only 25.4 ms to extract the floor plane and the wall line(s). The use of the proposed method resulted in a ~17Hz position update rate for the wayfinding system.
Fig. 12.
Runtime comparison of the planar SLAM and the proposed method
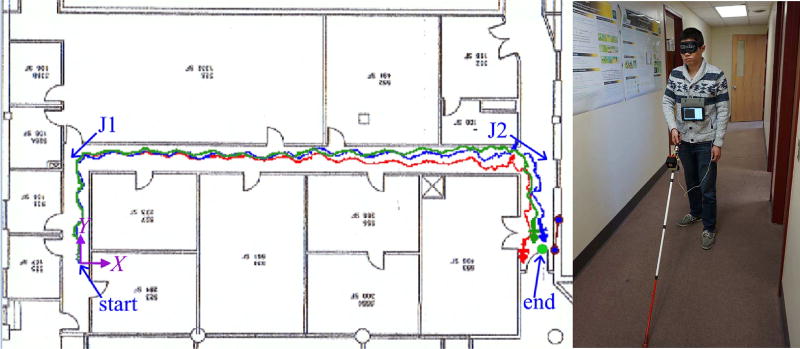
The second experiment was carried out on the 5th floor of the ETAS building. The floor is covered with patternless carpet and the path-length is 40.02 meters. There were numerous cardboard boxes at the wall lines along the hallways. This added more visual features to the intensity images and helped to operate the VRO more reliably. The user walked with a slower speed (~0.2 m/s). The estimated trajectories are shown in Fig. 13. The EPEN of the proposed method (0.39 m or 0.97% of the path-length) is smaller than that of the planar SLAM (0.48 m or 1.12% of the path-length) and the RGBD-SLAM method (2.45 m or 6.12% of the path-length). The average one-frame runtimes of the proposed method and the planar SLAM method are 47.3 ms (standard deviation: 13.0 ms) and 63.2 ms (standard deviation: 13.2 ms), respectively. The runtime plots of this experiment are omitted for conciseness. The runtime reduction in this case is 33.6%. Once again, the results show that the proposed method is able to obtain a better PE result with a shorter computational time.
Fig. 13.
Experiment 2 (5th floor, ETAS building). Left: Trajectories estimated by RGBD-SLAM (red), planar SLAM (green) and the proposed method (blue); Right: Human subject at the starting point.
3) Human Subject Test for RNA
Seven sighted human subjects were recruited outside the research team from our university to test the wayfinding system. We followed the protocol approved by the university’s institutional review board to recruit the human subjects. Each subject was blindfolded and performed a navigation task from the copy room to RM 582 (see Fig. 11) three times by using the SC. After that, he/she repeated the same task without a blindfold. This allowed the subject to memorize the destination’s orientation and the path towards the destination. He/she was then blindfolded to perform the same task by using a conventional white cane and stopped at the point deemed to be the destination. The path is 45.0 meters from the doorway of the copy room to the doorway of RM 582. The POIs along the path are copy room, faculty student space, RM 580, RM 506, RM 509, RM 511 and the destination (RM 582). When the subject went by each POI, we recorded if it was announced by the wayfinding system. The results of this experiment are summarized in Table III. It can be seen that the system successfully made announcement for 95% of the POIs and the subject successfully arrived at the destination for 81% of the tests with an average EPEN of 0.29 meter. In contrast, there was only one successful case (14%) with an EPEN of 0.50 meter by using the white cane. The result demonstrates that the SC is able to provide significant help in indoor wayfinding.
TABLE III.
Sighted Subject Test Result (5th Floor, EIT Building)
| Human Subject |
With SC | With White Cane | |||||
|---|---|---|---|---|---|---|---|
| N-POI | NST | EPEN (m) | AT (s) | NST | EPEN (m) | AT (s) | |
| 1 | 20/21 | 2/3 | 0.30 | 145 | 1/1 | 0.50 | 117 |
| 2 | 18/21 | 2/3 | 0.37 | 114 | 0/1 | - | - |
| 3 | 21/21 | 3/3 | 0.35 | 130 | 0/1 | - | - |
| 4 | 21/21 | 3/3 | 0.10 | 146 | 0/1 | - | - |
| 5 | 21/21 | 3/3 | 0.50 | 134 | 0/1 | - | - |
| 6 | 21/21 | 3/3 | 0.43 | 124 | 0/1 | - | - |
| 7 | 18/21 | 1/3 | 0.00 | 102 | 0/1 | - | - |
| Average | 95% | 81% | 0.29 | 130 | 14% | - | - |
N-POI: number of announced POIs; NST: number of successful tasks; AT: average time per task. EPEN and AT of the tests with SC were computed over the successful task(s), which is defined as one with EPEN ≤ 1 meters. Their values for the tests with a white cane were not computed because only one test was successful. The EPEN was measured on XOY plane.
For those failed tests with a white cane, subjects 3 and 7 passed the first the first T-junction (requiring a left-turn) and got lost while subjects 2, 4, 5 and 6 ended with an endpoint with an EPEN ranging from 3 to 6 meters. All failed tests with the SC were caused by a too fast walking speed (over 0.6 m/s). This limitation will be addressed in our future work by improving the robustness of the PE method. One direction of investigation is IMU-aided graph-SLAM.
We also perform human subject experiments in the ETAS building. The results show that the RNA provided significant help to the subjects in getting to the destination for some cases but was not so helpful in other cases. Taking the case as depicted in Fig. 13 as an example, the navigation task is relatively simpler than that in Fig. 11 because the subject has no chance to miss a junction. In the cases that the destination is close to the T-Junction J2, the subject could simply turn right after the white cane hit the wall and then stop after walking a specific number of steps. In these cases, there were no significant differences between using the white cane and the SC. In other cases where the distance between the destination and the T-Junction was much longer, the SC produced more accurate arrival of destination than the white cane. In other words, the SC provides more significant assistance in wayfinding if the navigation task is more complicated.
We surveyed the subjects after the experiments. The average ratings for the SC idea, usefulness of wayfinding function, usefulness of speech interface, functional enhancement of white cane, and comfortability of weight are 4.3, 4.0, 4.4, 4 and 2.7, respectively (5-highest, 1-lowest). The 4.0 score for the wayfinding function is quite pleasing considering that there is room to improve the system’s robustness in the future. There was a major complain on the weight of the SC (a low score of 2.7), which caused discomfort when a subject did the three experiments without a break. The survey results suggest the directions for improvement in the future.
We recruited two blind subjects from the World Service for the Blind to test the wayfinding function on the 5th floor of the EIT building. In addition to the task from the copy room to RM 582 (task 1), the following two wayfinding tasks were used for the study: Task 2 (25.0 m)—from the copy room to RM 571 with copy room, faculty student space, RM 571 as the POIs and Task 3 (30.0 m))—from the copy room to RM 539 with copy room and rooms 526, 532, 536, 537 and 539 as the POIs. Each subject performed each of the three tasks by first using the SC and then using the white cane. He was allowed to memorize the destination location (e.g., count the number of steps) when doing the experiment with the SC. He was also allowed to use the white cane but not his hands to explore the surroundings (e.g., touch the walls). The experimental results are tabulated in Table IV. The NST for the SC is 100% except for task 1 performed by human subject 2. In that experiment, he walked too fast by pointing the cane ~45° to the left of the straight-ahead direction. This caused the SLAM method to fail in estimating the SC’s pose. The experimental results demonstrate the effectiveness of the SC to the end users—the visually impaired. In addition, the 20% NST for the tests with a white cane tends to indicate that a blind subject has the same path integration (localization) ability as a blind-folded sighted subject. This is consistent with the finding in [38]. (To be conclusive on this, more experiments with blind subjects will be carried out in our future study.) The subjects indicated an overall satisfaction with the SC except for the device’s weight.
TABLE IV.
Blind Subject Test Result (5th Floor, EIT Building)
| Experiment | With SC | With White Cane | ||||||
|---|---|---|---|---|---|---|---|---|
| N-POI | NST | EPEN (%) | T (s) | NST | EPEN (%) | T (s) | ||
| HS1 | RM582 | 7/7 | 1/1 | 0.67 | 161 | 0/1 | 3.16 | 121 |
| RM571 | 3/3 | 1/1 | 0.88 | 94 | 0/1 | 7.92 | 74 | |
| RM539 | 6/6 | 1/1 | 1.37 | 102 | 0/1 | 2.77 | 71 | |
| HS2 | RM582 | - | - | - | - | - | - | - |
| RM571 | 3/3 | 1/1 | 1.52 | 75 | 1/1 | 2.00 | 41 | |
| RM539 | 6/6 | 1/1 | 1.40 | 73 | 0/1 | 17.00 | 27 | |
| Average | 100% | 100% | 1.17 | - | 20% | 6.57 | - | |
N-POI: number of announced POIs; NST: number of successful tasks; T: time used. EPEN of the tests with SC were computed over the successful task(s), which is defined as one with EPEN ≤ 1 m over a 50-m path (i.e., 2%).
VII. Conclusion
A new 6-DOF pose estimation method is introduced for indoor localization of an RNA for the visually impaired. The method takes two graph SLAM processes to reduce the accumulative pose error of the RNA. In the first step, the floor plane is extracted from the 3D camera’s point cloud and added as a node into the graph for 6-DOF SLAM to reduce roll, pitch and Z errors. In the second step, the wall lines are extracted and incorporated into the graph for 3-DOF SLAM to reduce X, Y and yaw errors. As a result, the 6-DOF pose error is reduced by using the floor and wall information of the operating environment. Experimental results validate that the proposed method obtain a more accurate pose with less time than the state-of-the-art plane-based SLAM methods. Based on the pose estimation method, we developed a real- time wayfinding system (with a pose update rate of ~17 Hz) for guiding a visually impaired person in indoor environments. Human subject tests have been conducted and the experimental results demonstrate the usefulness of the wayfinding system.
In term of future work, we will employ a loop-closure detection algorithm [42] in the proposed SLAM method. This will allow the SLAM method to reduce the accumulative pose error in case that the smart cane user walks in the looped trajectory.
Acknowledgments
This work was supported by the NIBIB and the National Eye Institute (NEI) of the NIH under award R01EB018117 and the NEI of the NIH under award R01EY026275. The content is solely the responsibility of the authors and does not necessarily represent the official views of the funding agencies.
Biographies

He Zhang received BS degrees in Computer Science & Technology from China University of Mining &Technology, Beijing, China, in 2009. Since 2014 August, he is a Ph.D student with the Department of Systems Engineering, University of Arkansas at Little Rock. His research interests include simultaneous localization and mapping, rehabilitation robotics, 2D/3D computer vision.

Cang Ye (S’97–M’00–SM’05) received the B. E. and M. E. degrees from the University of Science and Technology of China, Hefei, Anhui, in 1988 and 1991, respectively, and the Ph.D. degree from the University of Hong Kong, Hong Kong in 1999. He is currently a Professor with the Department of Systems Engineering, University of Arkansas at Little Rock. His research interests are in mobile robotics, computer vision, assistive technology and intelligent system.
Appendix
A. Computation of Edge Eij
Node xi represents the ith camera pose in the world coordinate system. The transformation matrix that transforms the world coordinate system to the camera coordinate system is , where Ri is the rotation matrix determined by the Euler angle ϕi, θi, φi and ti is the translation vector. The transformation matrix from node xi to node xj is computed by
| (15) |
The expected virtual measurement between node xi and node xj is , where function Π (·) computes the Euler angles and translation vector from T̂ij. The mean virtual measurement zij is computed by zij = Π (Tij), where Tij = υ(xi, xj) is the transformation matrix between xi to xj as determined by the VRO algorithm [37] (see IV.A). Function υ(·) represents VRO computation. The measurement error is then given by The Jacobian matrix Jij of edge Eij can be numerically calculated by Jij = [0 … 0 Ji 0 … 0 Jj 0 … 0], where Ji = ∇eij and Jj = ∇eij are computed at xi and xj, respectively.
With the SR4000’s configuration in our application, the range error’s repeatability is about ±0.01 m. The covariance matrix of the 3D point corresponding to a SIFT feature at (ui, υi) on the image plane can be estimated by , where and . (ox, oy) is the location of the intensity image’s central pixel. fx and fy are the focal lengths. These intrinsic parameters of the camera are obtained by a camera calibration process. Assuming there are m inliers in υ(xi, xj), the covariance matrix of zij can be estimated by using the standard law of error propagation:
| (16) |
with Fa = ∇zij, Fb = ∇zij computed at {al } and {bl }, respectively. Σal and Σbl are the covariance matrices for SIFT feature points al and bl, respectively. The information matrix is then computed by .
B. Computation of Edge
An FP-node is represented by in the world coordinate system. If the floor plane is observed at node xi, the expected normal vector in the camera coordinate system is while the expected distance is . Therefore, the expected virtual measurement is formed as . The mean virtual measurement is computed by using the method in [33]. The measurement error is then calculated by . The Jacobian is given by Jik = [0 … 0 Ji 0 … 0 Jk 0 … 0], where Ji and Jk are computed by using the method in [22].
The covariance matrix Cik of for a m-point plane can be estimated by the following first-order approximation [39]:
| (17) |
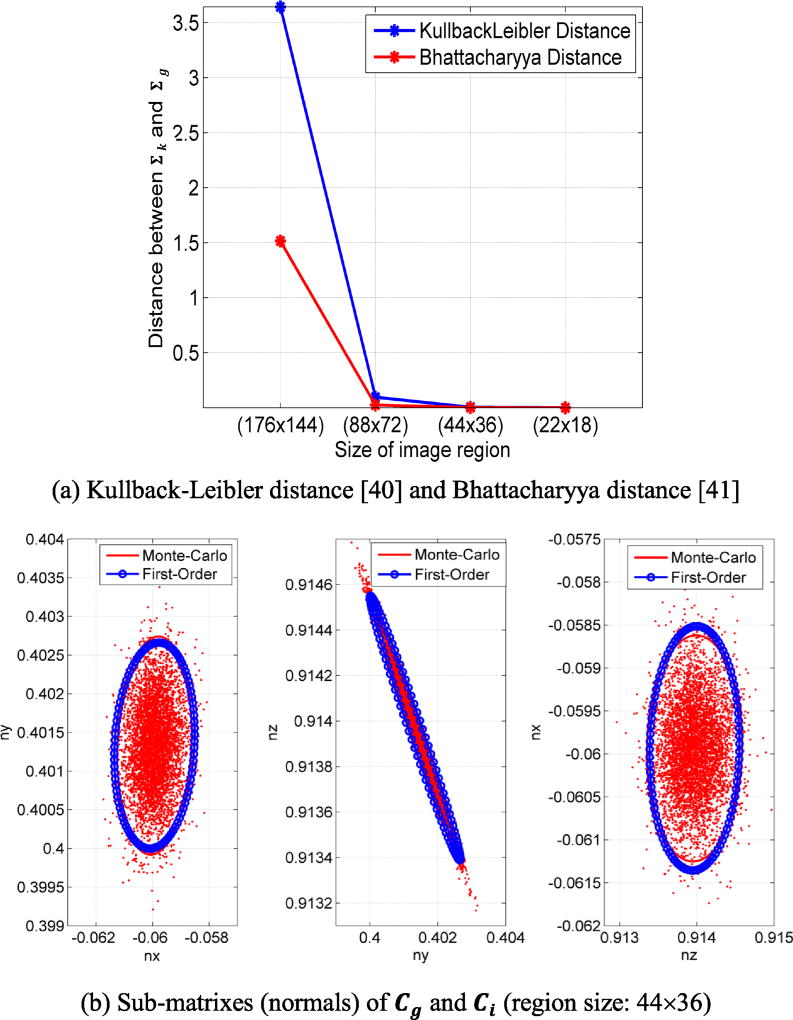
where Σqj for j = 1 … m is the covariance matrix of 3D point qj and is computed at qj for j = 1 … m. To reduce the computational cost, Fq is computed at only a number of representative points (instead of all points) by the following procedure: 1) the intensity image associated with the floor plane is evenly divided into a number of regions; 2) the element of Fq for a 3D point associated with a pixel in each image region is computed by using the 3D point corresponding to the central pixel of the region. The above scheme trades a little accuracy for computational reduction if a suitable size of image region is used. The accuracy loss can be described by the Kullback-Leibler or Bhattacharyya distance between the covariance matrices computed by using all points and part of them. Fig.14 depicts accuracy loss versus the size of image region. It can be seen from Fig. 14a that the accuracy loss is very little when the region size is no greater than 44×36. In this case, the computational time cost is 16 times lower. It can also be observed from Fig. 14b that the covariance matrix computed by (17) (using a region size of 44×36) is accurate. Finally, the information matrix is given by .
Fig. 14.
Pces computed by real data of the SR4000 with a floor plane. Cg is the covariance matrix estimated by Monte-Carlo approach with 5000 samples while Ci is the matrix computed by using (17) with various region sizes: 176×144, 88×72, 44×36, 22×18.
C. Computation of for Edge
From the floor plane observed at node xi with normal vector , we can compute the rotation matrix Q that transform the camera coordinate system to XlYlZl that is parallel to the floor plane by letting . A point in the camera coordinate system can now be transformed into one in XlYlZl by . The projection of , denoted , on the floor plane (for wall-line detection) can be obtained by simply removing the Z coordinate of . The covariance matrix of can be computed by , where is the covariance matrix of , and the covariance matrix of is a sub-matrix of containing the entries related to x and y. If the RANSAC step finds m inlier points in the line-extraction process, the covariance matrix of the extracted wall-line is estimated by:
| (18) |
where for j = 1 … m is the covariance matrix of and is computed at for j = 1 … m. The information matrix is then given by .
References
- 1.The Bat K-Sonar. 2016 [Online]. Available: http://ksonar.com.
- 2.UltraCane. 2016 [Online]. Available: http://www.ultracane.com.
- 3.Bhatlawande S, Mahadevappa M, Mukherjee J, Biswas M, Das D, Gupta S. Design, Development, and Clinical Evaluation of the Electronic Mobility Cane for Vision Rehabilitation. IEEE Trans. Neural Syst. Rehabil. Eng. 2014;22(6):1148–1158. doi: 10.1109/TNSRE.2014.2324974. [DOI] [PubMed] [Google Scholar]
- 4.Benjamin J, Ali N, Schepis A. A Laser Cane for the Blind. Proc. San Diego Medical Symposium. 1973;12:53–57. [Google Scholar]
- 5.Yuan D, Manduchi R. A Tool for Range Sensing and Environment Discovery for the Blind; Proc. IEEE Computer Society Conference on Computer Vision and Pattern Recognition Workshops; 2004. [Google Scholar]
- 6.Tsukada K, Yasumura M. Activebelt: Belt-type wearable tactile display for directional navigation. Proc. Ubiquitous Comput. 2004:384–399. [Google Scholar]
- 7.Sendero Group. Mobile Geo Navigation Software. 2009 [Online]. Available: http://www.senderogroup.com.
- 8.Ye C. Navigating a Portable Robotic Device by a 3D Imaging Sensor; Proc. IEEE Sensors Conference; 2010. pp. 1005–1010. [Google Scholar]
- 9.Qian X, Ye C. 3D Object Recognition by Geometric Context and Gaussian-Mixture-Model-Based Plane Classification; Proc. IEEE Int. Conf. on Robotics and Automation; 2014. pp. 3910–3915. [Google Scholar]
- 10.Endres F, Hess J, Engelhard N, Sturm J, Cremers D, Burgard W. An evaluation of the RGB-D SLAM system; Proc IEEE Int. Conf. Robotics and Automation; 2012. pp. 1691–1696. [Google Scholar]
- 11.Tamjidi A, Ye C, Hong S. 6-DOF pose estimation of a portable navigation aid for the visually impaired; Proc. IEEE international symposium on robotic and sensors environments; 2013. pp. 178–183. [Google Scholar]
- 12.Ye C, Hong S, Tamjidi A. 6-DOF pose estimation of a robotic navigation aid by tracking visual and geometric features. IEEE Trans. Autom. Sci. Eng. 2015 Oct.12(4):1169–1180. doi: 10.1109/TASE.2015.2469726. [DOI] [PMC free article] [PubMed] [Google Scholar]
- 13.Kulyukin V, Gharpure C, Nicholson J, Osborne G. Robot-assisted wayfinding for the visually impaired in structured indoor environments. Auton. Robot. 2006;21(1):29–41. [Google Scholar]
- 14.Hesch JA, Roumeliotis SI. Design and analysis of a portable indoor localization aid for the visually impaired. Int. J. Robot. Res. 2010;29(11):1400–1415. [Google Scholar]
- 15.Davison A, Reid I, Molton N, Stasse O. MonoSLAM: Real-time single camera SLAM. IEEE Trans. Pattern Anal. Mach. Intell. 2007 Jun.29(6):1052–1067. doi: 10.1109/TPAMI.2007.1049. [DOI] [PubMed] [Google Scholar]
- 16.Bailey T, Durrant-Whyte H. Simultaneous Localization and Mapping (SLAM): Part II. IEEE Robotics & Automation Magazine. 2006;13(3):108–117. [Google Scholar]
- 17.Kümmerle R, Grisetti G, Strasdat H, Konolige K, Burgard W. g2o: A general framework for graph optimization; Proc. IEEE Int. Conf. Robot. Autom; 2011. pp. 3607–3613. [Google Scholar]
- 18.Kaess M, Ranganathan A, Dellaert F. iSAM: Incremental smoothing and mapping. Robotics. IEEE Transactions on Robotics. 2008;24(6):1365–1378. [Google Scholar]
- 19.Klein G, Murray D. Parallel tracking and mapping for small AR workspaces; Proc. IEEE and ACM International Symposium on Mixed and Augmented Reality; 2007. pp. 225–234. [Google Scholar]
- 20.Newcombe RA, Lovegrove SJ, Davison AJ. DTAM: Dense tracking and mapping in real-time; Int. Conf. Computer Vision; 2011. pp. 2320–2327. [Google Scholar]
- 21.Engel J, Schöps T, Cremers D. LSD-SLAM: Large-scale direct monocular SLAM; Proc. European Conference on Computer Vision; 2014. pp. 834–849. [Google Scholar]
- 22.Trevor A, Rogers John, Christensen H. Planar surface SLAM with 3D and 2D sensors; Proc. IEEE Int. Conf. Robot. Autom; 2012. pp. 3041–3048. [Google Scholar]
- 23.Dou M, Guan L, Frahm J-M, Fuchs H. Exploring High-Level Plane Primitives for Indoor 3D Reconstruction with a Hand-held RGB-D Camera. Proc. Computer Vision-ACCV Workshops. 2012;7729:94–108. [Google Scholar]
- 24.Sinha SN, Frahm J, Pollefeys M, Genc Y. GPU-Based Video Feature Tracking and Matching. Proc. Workshop on Edge Computing Using New Commodity Architectures. 2006 [Google Scholar]
- 25.Ye C, Bruch M. A visual odometry method based on the SwissRanger SR-4000. Proc. Unmanned Syst. Technol. XII Conf. SPIE Defense, Security, and Sensing Symp. 2010;7692 [Google Scholar]
- 26.Qian X, Ye C. NCC-RANSAC: A fast plane extraction method for navigating a smart cane for the visually impaired; Proc. IEEE Int. Conf. Autom. Sci. Eng; 2013. pp. 261–267. [Google Scholar]
- 27.Hornung A, Wurm KM, Bennewitz M, Stachniss C, Burgard W. OctoMap: an efficient probabilistic 3D mapping framework based on octrees. Auton. Robots. 2013;34(3):189–206. [Google Scholar]
- 28.Saez JM, Escolano F, Penalver A. First steps towards stereobased 6DOF SLAM for the visually impaired; Proc. IEEE Int. Conf. Comput. Vision Pattern Recogn; 2005. pp. 23–23. [Google Scholar]
- 29.Pradeep V, Medioni G, Weiland J. Robot vision for the visually impaired; Proc. IEEE Int. Conf. Comput. Vision Pattern Recogn; 2010. pp. 15–22. [DOI] [PubMed] [Google Scholar]
- 30.Lee YH, Medioni G. RGB-D camera based navigation for the visually impaired. Proc. Workshop RGB-D: Adv. Reasoning With Depth Camera. 2011:1–6. [Google Scholar]
- 31.Nister D, Naroditsky O, Bergen J. Visual odometry. Proc. IEEE Int. Conf. Comput. Vision Pattern Recogn. 2004;1:I-652–I-659. [Google Scholar]
- 32.Sunderhauf N, Konolige K, Lacroix S, Protzel P. Visual odometry using sparse bundle adjustment on an autonomous outdoor vehicle. Tagungsband Autonome Mobile Systeme. 2005:157–163. [Google Scholar]
- 33.Weingarten J, Siegwart R. 3D SLAM using planar segments; Proc. IEEE/RSJ Int. Conf. Intell. Robot. Syst; 2006. pp. 3062–3067. [Google Scholar]
- 34.Lourakis MA, Argyros A. SBA: A Software Package for Generic Sparse Bundle Adjustment. ACM Trans. Math. Software. 2009;36(1):1–30. [Google Scholar]
- 35.Lowe DG. Distinctive Image Features From Scale-Invariant Keypoints. Int. J. Computer Vision. 2004;60(2):91–110. [Google Scholar]
- 36.Arun KS, Huang TS, Blostein SD. Least Square Fitting of Two 3-D Point Sets. IEEE Transactions on Pattern Analysis and Machine Intelligence. 1987;9(5):698–700. doi: 10.1109/tpami.1987.4767965. [DOI] [PubMed] [Google Scholar]
- 37.Hong S, Ye C, Bruch M, Halterman Performance Evaluation of a Pose Estimation Method based on the SwissRanger SR4000; Proc. IEEE Int. Conf. Mechatronics and Automation; 2012. pp. 499–504. [Google Scholar]
- 38.Loomis J, Klatzky R, Golledge R. Navigating withour Vision: Basic and Applied Research. Optometry and Vision Science. 2001;78(5):281–289. doi: 10.1097/00006324-200105000-00011. [DOI] [PubMed] [Google Scholar]
- 39.Ozog P, Eustice RM. Real-time SLAM with piecewise-planar surface models and sparse 3D point clouds; Proc. IEEE/RSJ Int. Conf. Intell. Robots. Syst; 2013. pp. 1042–1049. [Google Scholar]
- 40.Kullback S, Leibler RA. On information and sufficiency. The annals of mathematical statistics. 1951:79–86. [Google Scholar]
- 41.Bhattacharyya A. On a measure of divergence between two multinomial populations. Sankhyā: the indian journal of statistics. 1946:401–406. [Google Scholar]
- 42.Ho KL, Newman P. Loop closure detection in SLAM by combining visual and spatial appearance. Robotics and Autonomous Systems. 2006;54(9):740–749. [Google Scholar]


