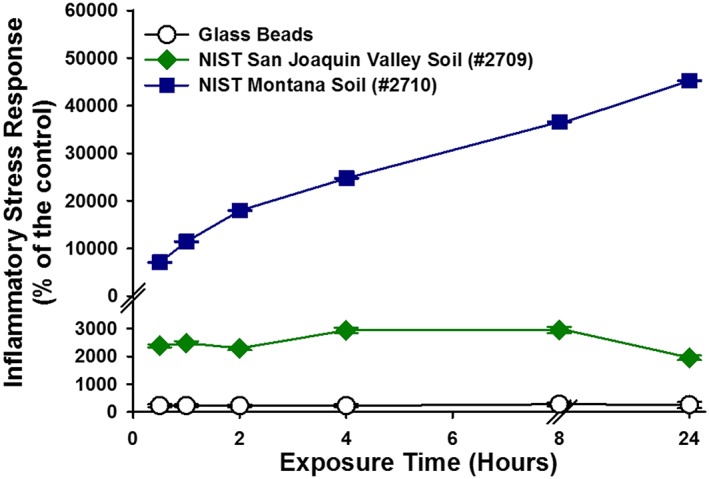
Figure 8.

The temporal evolution of the ISR generated by elevated particle loadings (0.025 m2/mL) for reference material samples: glass beads, NIST San Joaquin Valley soil (#2709), and NIST Montana soil (#2710). For some data points, the error bars are hidden by the symbols.
