Abstract
In vitro models of the developing brain such as 3D brain organoids offer an unprecedented opportunity to study aspects of human brain development and disease. However, it remains undefined what cells are generated within organoids and to what extent they recapitulate the regional complexity, cellular diversity, and circuit functionality of the brain. Here, we analyzed gene expression in over 80,000 individual cells isolated from 31 human brain organoids. We find that organoids can generate a broad diversity of cells, which are related to endogenous classes, including cells from the cerebral cortex and the retina. Organoids could be developed over extended periods (over 9 months) enabling unprecedented levels of maturity including the formation of dendritic spines and of spontaneously-active neuronal networks. Finally, neuronal activity within organoids could be controlled using light stimulation of photoreceptor-like cells, which may offer ways to probe the functionality of human neuronal circuits using physiological sensory stimuli.
In recent years, reductionist in vitro models of the developing human brain have emerged in the form of 3D human brain organoids and spheroids derived from pluripotent stem cells, suitable for large-scale production and genetic engineering1. These systems offer an unprecedented opportunity to study both normal brain development and complex human diseases that affect multiple cell types, their interactions, and the function of neuronal circuits.
Thus far, organoid models have been applied to study events of neural progenitor dysfunction that occur during early stages of brain development, including microcephaly-associated phenotypes2 and progenitor abnormalities resulting from Zika virus infections3–7. Organoids generated from patients with severe idiopathic Autism Spectrum Disorder (ASD) have also been used to implicate progenitor overproliferation and generation of excessive GABAergic neurons in this complex disease8. However, hurdles remain that preclude broader application of brain organoids to disease modeling 9.
Central issues include our incomplete understanding of the cellular composition of brain organoids, the potential of organoids to generate the regional and cellular diversity present in the brain, and the reproducibility of the cell-type spectrum generated within individual organoids.
It is also critical to understand whether 3D brain organoids can continue to develop in culture past early developmental events, to allow not only the generation of endogenous cellular diversity but also the maturation of neuronal networks, which will be needed to apply brain organoids to studies of late developmental events, such as complex cellular interactions and, most notably, higher-order brain functions that rely on functional neural networks.
Here we describe the prolonged development of human whole-brain organoids, and provide the largest-to-date molecular map of the diversity of cell types generated and its reproducibility across organoids. We show that organoids undergo substantial neuronal maturation, including generation of dendritic spines and the formation of spontaneously active neuronal networks. Finally, we demonstrate that neuronal activity within organoids is responsive to light-based stimulation of photosensitive cells, suggesting that organoid models may allow investigation of circuit functionality using physiological sensory mechanisms.
Protracted in vitro development of human whole-brain organoids
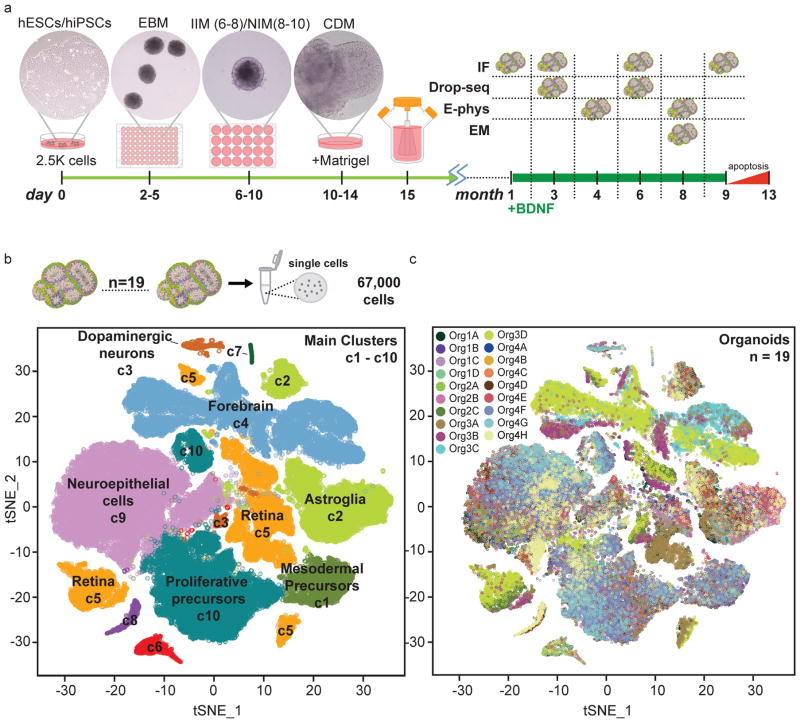
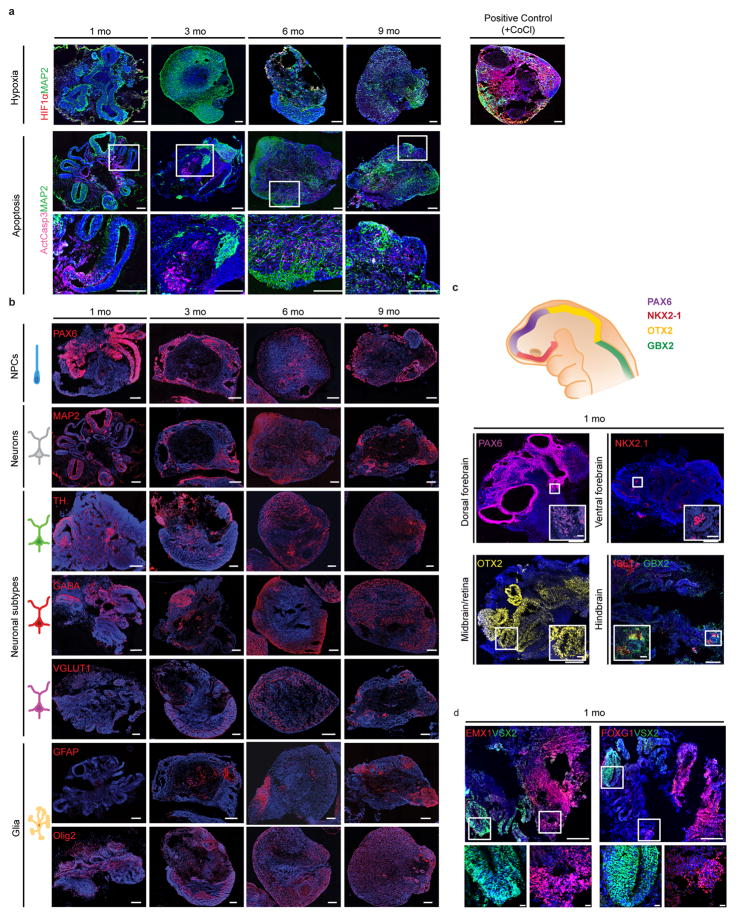
Human whole-brain organoids are largely self-patterning systems and therefore in principle have the potential to generate the vast cellular diversity of the endogenous tissue. However, this possibility remains largely untested. To address this point directly, we modified the culturing protocol first described by Lancaster et al.2,10 to foster extended periods of growth and development. By seeding initial embryoid bodies (EBs) with a reduced number of pluripotent stem cells (2,500 cells), optimizing neural induction, and adding BDNF to the final differentiation medium, we obtained long-term, progressive development for over 9 months (mo) (Figure 1a, Extended Data Figure 1; see Methods). With this protocol, organoids do not become hypoxic, and levels of programmed cell death remain relatively low up to 9 mo (Extended Data Figure 1a). The yield of organoids from initial EBs was also improved, to >95% at 1 month with the iPSC11a line and 70% for HuES66.
Figure 1. Large-scale, single-cell sequencing demonstrates development of a broad spectrum of cell types in human brain organoids.
a. Schematic of long-term culture of brain organoids. Dissociated human iPSCs are seeded at day 0 into round-bottom plates to allow EB formation (day 2–5). After a two-step neural induction (day 6–10), EBs are embedded in Matrigel (day 10) and transferred to spinning bioreactors (day 15) for long-term culture. BDNF is added starting at 1 month. Immunohistochemistry (IHC), single cell RNA-sequencing (Drop-seq), electrophysiology (E-phys) and electron microscopy (EM) were performed at different timepoints. b. t-SNE plot of single-cell mRNA sequencing data from 6 mo organoids. A total of 66,889 cells were clustered into 10 distinct groups. c. Same as in b, with cells color-coded by organoid of origin.
To define the timeline of generation of broadly-defined cell classes, we analyzed a small set of informative single-gene markers by immunohistochemistry (IHC) in organoids derived from the iPSC11a line over 1 to 9 months in culture (Extended Data Figure 1b,c and Supplementary Discussion). At 1 mo, organoids exhibited early brain regionalization, expressing markers for germinal zones of the forebrain (Pax6 and Nkx2.1), midbrain (Otx2), hindbrain (Gbx2), and retina (VSX2, Otx2) (Extended Data Figure 1c,d). Resembling the endogenous sequence, neural progenitors emerged first, followed by glutamatergic (Vglut1), GABAergic (GABA), and dopaminergic (TH) neuronal identities and GFAP+ astroglia. The data indicate that whole brain organoids can develop for long periods of time and have the potential to generate cell types from distinct germinal zones of the brain and retina.
Large-scale, single-cell sequencing in human brain organoids reveals extensive diversity of cells
Individual gene markers cannot resolve the cellular diversity of the human brain, in which closely related cell classes can be identified only using combinatorial gene signatures. Single-cell RNA sequencing allows systematic interrogation of many genes, but the cellular diversity of the human brain requires that very large numbers of cells be profiled. To address this issue directly, we employed Drop-seq single-cell mRNA sequencing11 to molecularly profile 82,291 single cells isolated from 31 organoids derived from a healthy-control pluripotent stem cell line (iPSC line 11a) at 3 mo and 6 mo in vitro.
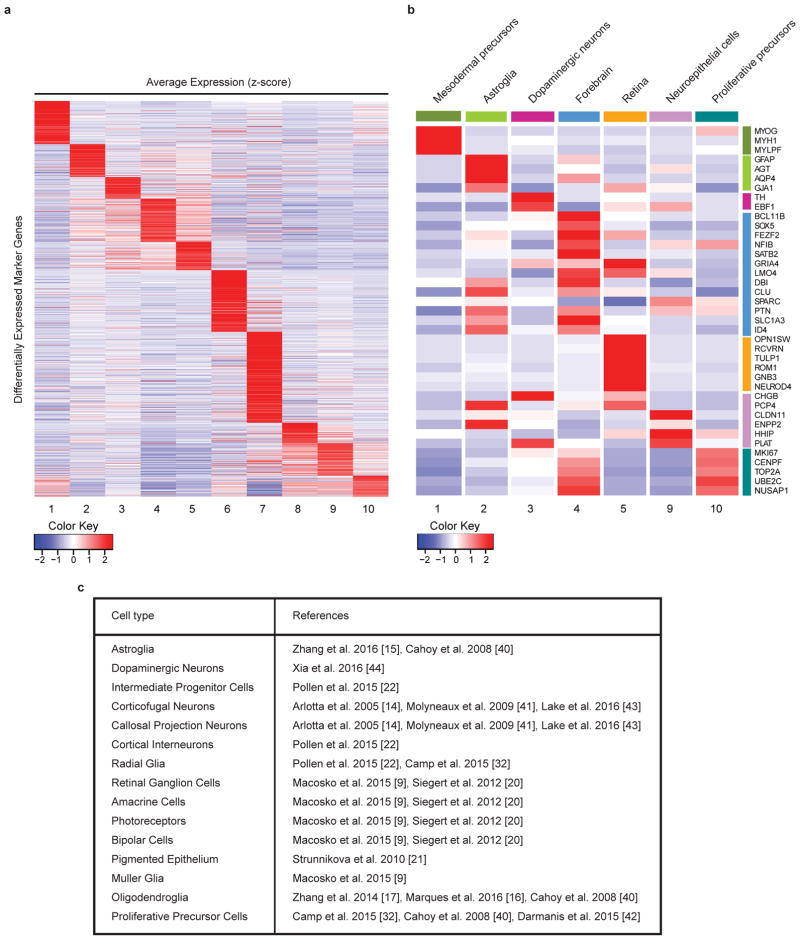
Starting with a relatively advanced stage of development, 6 mo, we sequenced an average of 3,520 cells from each of 19 organoids grown in 4 separate bioreactors (range 1,656–11,061 cells per organoid). Principal component analysis (PCA) of read counts was performed with dimensionality reduction using tSNE12–14 (see Methods). Clustering all cells from the 6 mo organoids produced ten main transcriptionally distinct populations (Figure 1b). We systematically compared the differentially expressed gene signatures for each cluster to gene signatures extracted from existing RNA-seq datasets of endogenous cell types11,15–27 (Extended Data Figure 2). We were able to define the identity of the seven largest clusters (c1, c2, c3, c4, c5, c9 and c10) (Figure 1b).
Six of the seven clusters belonged to the neurectodermal lineage; however, one cluster (c1; 3,027 cells) expressed mesodermal markers, including Myogenin and Myosin genes (MYH3, MYH8, MYL1, MYLPF), indicating that, despite early patterning to a neurectodermal fate, organoids can still produce a minority of cells of another embryonic origin.
Cluster c2 (8,409 cells) was primarily composed of cells expressing genes of endogenous adult human astrocytes27, including canonical astrocyte markers AQP4 and GFAP. Cluster c9 (17,103 cells) contained progenitors of neuroepithelial origin, including cells with oligodendrocyte precursor-like identity20,26. Cluster c10 (13,428 cells) was mainly composed of cells with signatures of highly proliferative progenitors (e.g., TOP2A and MKI67). Cluster c3 (971 cells) was enriched for cells expressing neuronal genes, including dopaminergic markers (e.g., TH and EBF1). Perhaps the most interesting clusters were c4 and c5 (12,378 and 9,919 cells, respectively) (Figure 2a–d). Cluster c4 had a clear neuronal signature, and was enriched for markers of neurons and progenitors of the cerebral cortex. Cluster c5 (9,919 cells) showed a strong representation of genes of the neural retina, such as the photoreceptor markers CRX and RCVRN28,29. Comparison with several gene expression datasets of mouse and human retina11,23,24 confirmed that this cluster was composed predominantly of retinal cells.
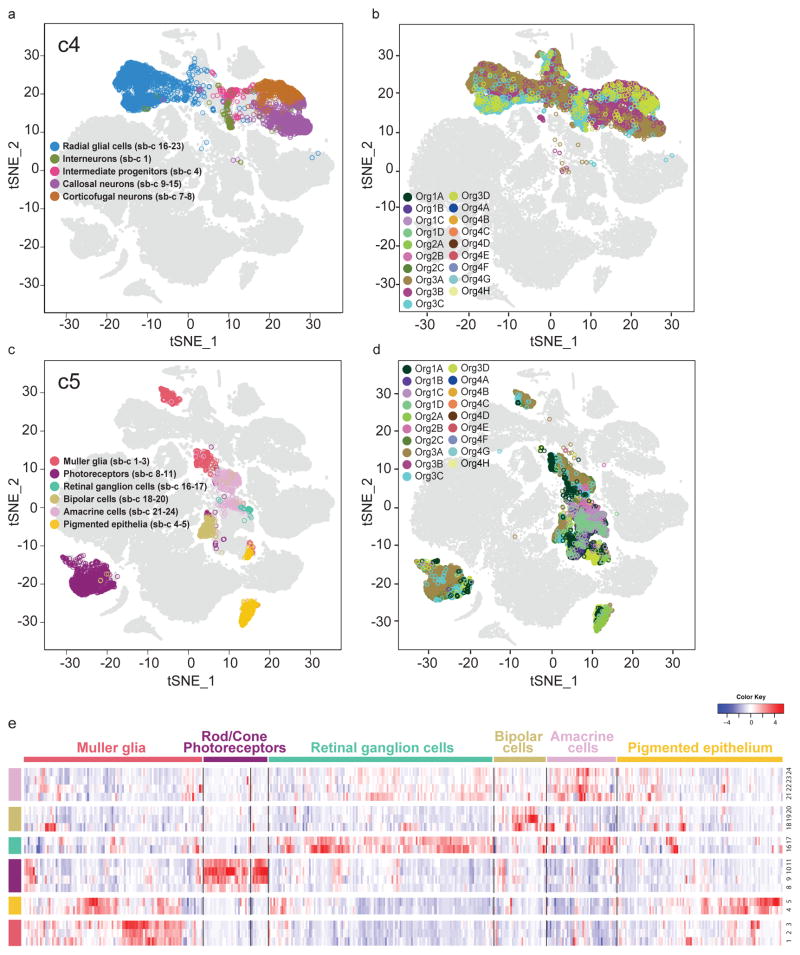
Figure 2. Human brain organoids contain subclasses of forebrain and retina cells.
a. Subclustering of the forebrain cluster (c4): five major cell subtypes were identified as radial glia (7 subclusters), interneurons (1 subcluster), intermediate progenitors (1 subcluster), corticofugal neurons (2 subclusters), or callosal neurons (8 subclusters). b. All cells in c4, color-coded by organoid of origin. c. Subclustering of the retina cluster (c5): six major cell subtypes were identified as Muller glia (3 subclusters), photoreceptors (4 subclusters), retinal ganglion cells (2 subclusters), bipolar cells (3 subclusters), amacrine cells (4 subclusters), or pigmented epithelium (2 subclusters). d. All cells in c5, color-coded by organoid of origin. e. Expression of genes identified as retinal cell subtype markers across the retinal subclusters (see Extended Data Figure 2c for sources).
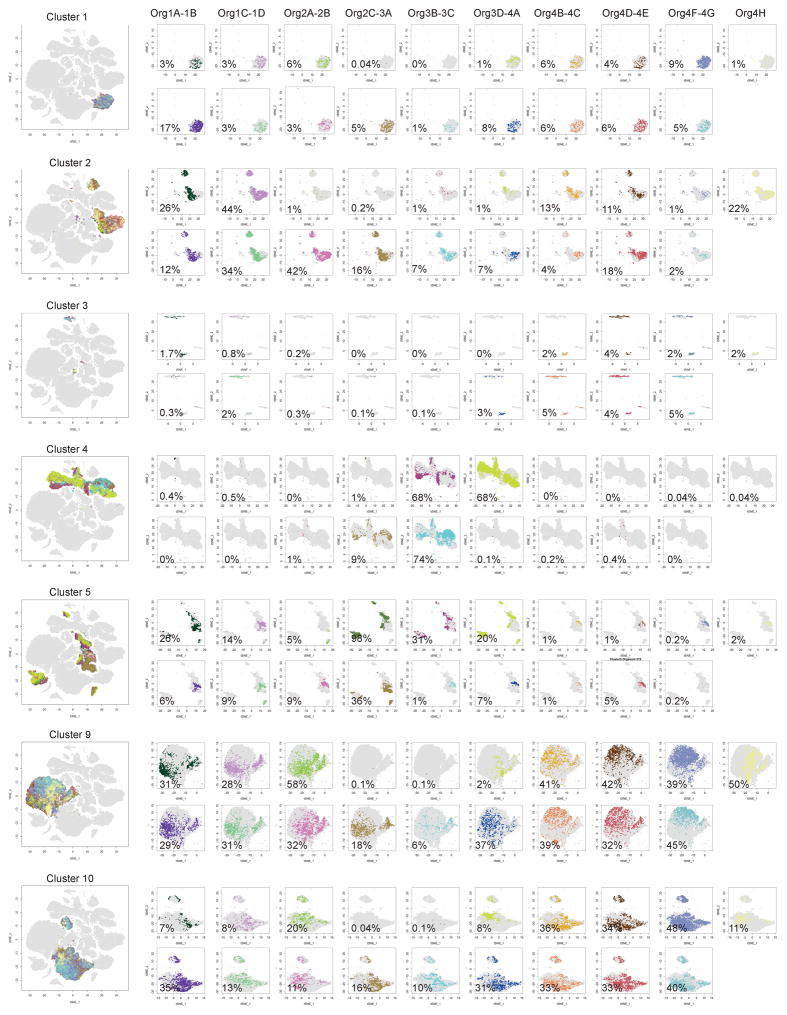
To quantify variability among organoids and possible bioreactor-based batch effects, we determined the frequency with which cells from each of the ten clusters were generated in individual organoids and across bioreactors (Figure 1c, Extended Data Figure 3 and Supplementary Discussion). We found that most clusters were consistently represented (c1, c2, c5, c9, c10; all >89% of organoids), although clusters c3 and c4 were present in only a subset of organoids (53% and 32%, respectively). Notably, organoids grown in the same bioreactor were more similar to each other in their ability to make cells of each cluster (e.g., 100% of organoids from bioreactor 3 contained the forebrain cluster), suggesting that bioreactor-related growth environment is a key factor in controlling cell class identity (Extended Data Figure 3 and Supplementary Discussion).
Many cell types of the endogenous human forebrain and retina are identified within brain organoids
In order to understand to what degree endogenous cellular diversity is generated within organoids, we more closely dissected the forebrain and retina clusters (c4 and c5) by a second iteration of clustering. Within cluster c4, we identified 30 transcriptionally distinct sub-clusters (Figure 2a and data not shown); we were able to assign 17 of these to 5 broad cell type identities (Figure 2a). Sub-clusters (sb-c) 7–8 and sb-c 9–15 included neurons of putative corticofugal and callosal projection neuron identity, respectively. Sb-c 16–23 was enriched in human radial glia markers22, while sb-c 4 was distinguished by expression of canonical genes for intermediate progenitors, including EOMES and ELAV4. Finally, sb-c 1 displayed molecular signatures of interneurons, including DLX5, DLX2, SCGN and GAD1.
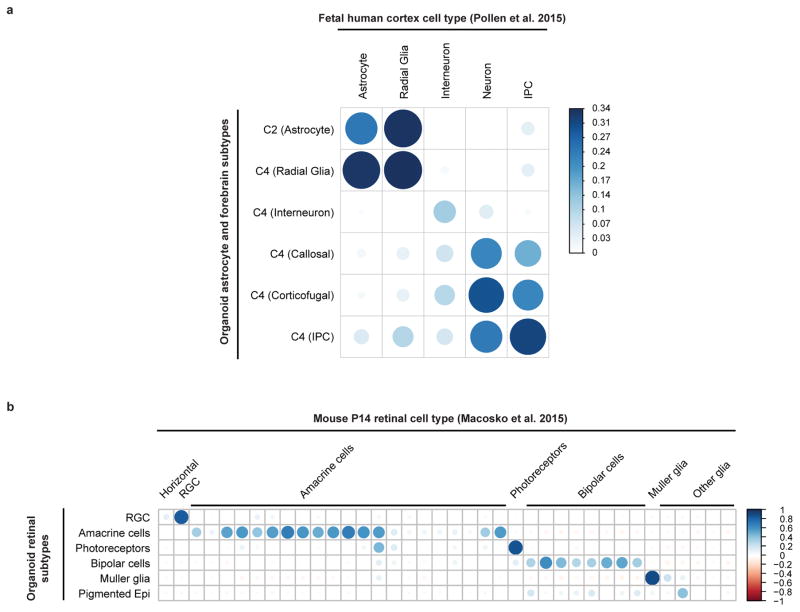
We confirmed this similarity by correlating sub-cluster gene signatures with a previously published single-cell RNAseq dataset of human fetal cortex22 (see Methods). Despite the differences in the profiling methods used (Drop-seq vs. Fluidigm C1), we detected appropriate, preferential correlation between corresponding cell types for radial glia, interneurons, projection neurons and IPCs (Extended Data Figure 5a).
Next, we examined sub-clusters of the retina cluster (c5). Using class-specific retina markers identified in a previous Drop-seq analysis of 44,408 single cells from the murine retina11, we found that cluster c5 contained virtually all of the cell classes found in the mouse retina. Specifically, we identified populations corresponding to Muller glia cells (e.g., DKK3, SOX9), pigmented epithelial cells (e.g., MLANA, MITF), photoreceptors (e.g., CRX, RCVN, NRL), retinal ganglion cells (e.g., NEFL, NEFM), bipolar cells (e.g., LHX4, PCP2), and amacrine cells (e.g., TFAP2B, SLC32A1) (Figure 2c,e). To validate these identities, we correlated sub-cluster gene signatures to the mouse retina Drop-seq dataset11 (see Methods). Each of the organoid retinal populations showed strong correlation to the expected mouse retinal cell class (Extended Data Figure 5b).
Taken together, these analyses indicate that distinct cell types generated in organoids transcriptionally resemble the appropriate endogenous counterparts from the human fetal cortex and mouse retina.
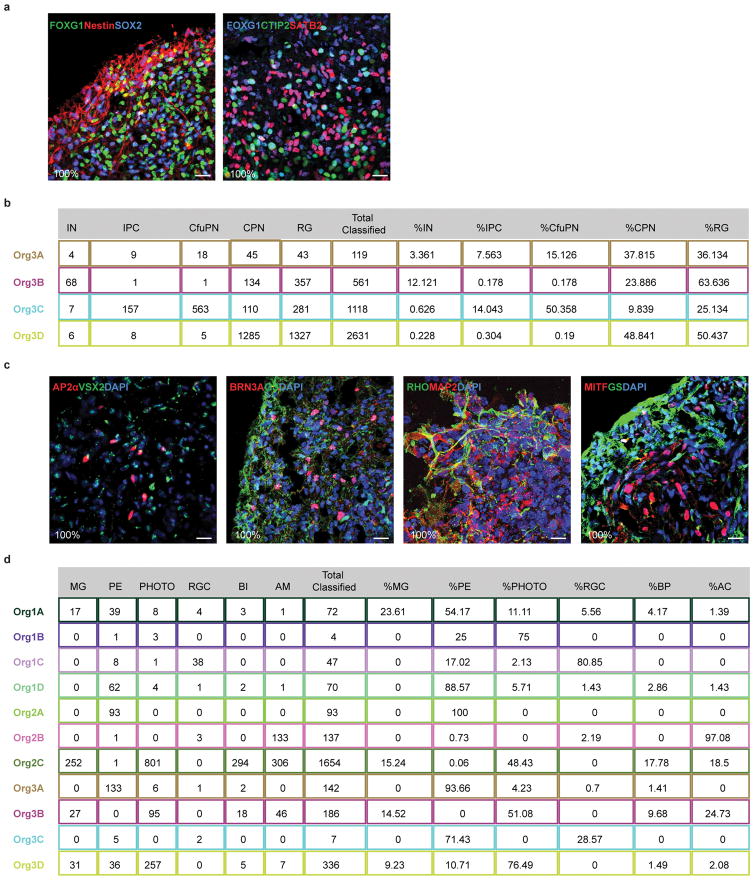
To assess variability in cell type production, we examined organoids from bioreactors in which all organoids generated forebrain (bioreactor 3) or retina (bioreactors 1, 2 and 3) (Figure 2b,d, Extended Data Figure 4 and Supplementary Discussion). For the forebrain, callosal projection neurons and radial glia progenitors were present in all organoids sampled, while cortical interneurons, corticofugal projection neurons and intermediate progenitors were present in 50%. For retina, photoreceptors and pigmented epithelial cells developed in the majority of organoids (73% and 91%, respectively), while retinal ganglion cells, bipolar cells and amacrine cells (each ~55%) and Muller glia (36%) occurred more sporadically (Extended Data Figure 4b,d). This analysis likely overestimates the true variability, given the relatively small number of cells in each sub-cluster sampled from each organoid, and differences in robustness to dissociation and collection between cell types; indeed, IHC for known markers indicates a higher frequency of co-development of the same putative populations (Extended Data Figure 4a,c and Supplementary Discussion).
Protracted culture of human brain organoids leads to increased cell diversity and neuronal maturation
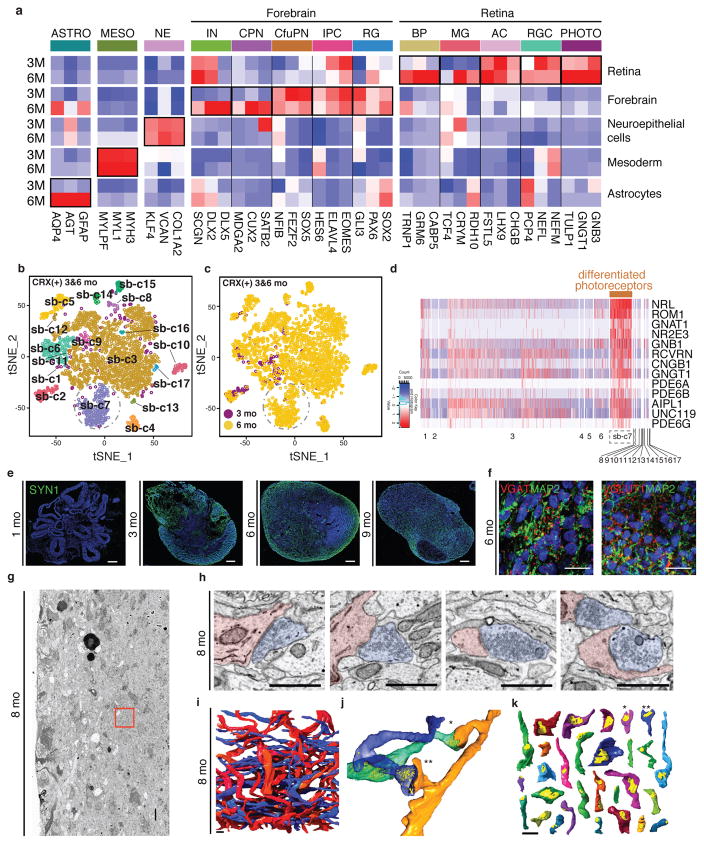
To evaluate whether additional cell types, and greater maturation, progressively emerge over time in culture, we performed Drop-seq analysis on an additional 15,402 cells from 3 mo organoids. We found that while some cell types were present at both 3 and 6 months, some appeared only at 6 mo. Of note, at 3 mo the forebrain cluster lacked the population of putative callosal projection neurons, which in vivo are born during late corticogenesis. Similarly, Muller glia and bipolar cells, normally generated at late stages of retina development, were absent from the 3 mo dataset (Figure 3a).
Figure 3. Extended culture permits development of mature cell types including differentiated photoreceptors.
a. Average expression of selected marker genes in organoids, by cell type and organoid age (3 vs. 6 month). ASTRO: astrocytes; MESO: mesodermal cells; NE: neuroepithelial cells; IN: interneurons; CPN: callosal projection neurons; CfuPN: corticofugal projection neurons; IPC: intermediate progenitor cells; RG: radial glial cells; BP: bipolar cells; MG: Muller glia; AC: amacrine cells; RGC: retinal ganglion cells. b. Reclustering of CRX+ cells in the combined 3 mo and 6 mo data sets identifies 17 clusters. c. Among CRX+ cells, sub-cluster sb-c7 is present only at 6 mo. d. Genes related to rod phototransduction (brown bar) are highly differentially expressed in the photoreceptor cluster (sb-c7). e–k. Synapse and dendritic spine development in organoids. e. Expression of the synaptic marker SYN1 is absent at 1 mo and appears with organoid maturation by 3 mo. f. Immunohistochemical detection of the synaptic proteins VGAT and VGLUT1 in a 6 mo organoid. g. EM slice from an 8 mo organoid (outer surface at left). Red frame, reconstructed area used in h–k. Scale bar, 10 μm. h. Example EM images of synaptic structures in the reconstructed volume. Scale bars, 1 μm. i. 3D renderings of all traced axons (blue) and dendrites (red) that establish synapses in the volume. Scale bar, 1 μm. j. Example dendrite with two spines (orange) making synapses with two axons (blue and green). Synaptic vesicles, yellow. k. Synaptic contact sites (yellow) on the 29 spines identified in the volume. Asterisks, synapses from j. Scale bar, 1 μm.
We next identified populations that were present at both 3 and 6 months and compared their molecular signatures between ages. First, we examined cells in the retina cluster that expressed the transcription factor CRX, which marks both developing and mature photoreceptors. Clustering all CRX-positive cells across both 3 and 6 mo organoids identified a sub-cluster (sb-c 7) (871 cells) which contained mature photoreceptors (Figure 3b–d and Methods). Importantly, all but one of the cells in this cluster came from the 6 mo data set (Figure 3c).
Cells of putative corticofugal projection neuron identity were present in both 3 and 6 month organoids and showed similar progressive maturation: functional clustering of gene sets (using DAVID 6.730) revealed a clear enrichment for genes involved in neuronal maturation at 6 mo, but not at 3 mo (data not shown). Finally, cells expressing astroglial markers at 3mo lacked markers of mature astrocytes (i.e., GFAP, AQP4 and AGT), which were present only at 6 mo (Figure 3a).
We then investigated whether the maturation of cells detected by molecular profiling was also reflected in structural traits of more mature neurons, including formation of synapses and the presence of dendritic spines.
The presynaptic marker synapsin 1 (SYN1) was absent at 1 mo but began to be expressed at 3 mo, persisting for at least 9 mo (Figure 3e). Detection of VGAT+ and VGLUT1+ puncta suggested that both glutamatergic and GABAergic synapses were present (Figure 3f). Electron Microscopy (EM) imaging of an organoid at 8 months (Extended Data Figure 6), confirmed the presence of many structurally-defined synapses (Figure 3h).
Next, we used serial EM to examine neuronal morphology, and in particular dendritic spines, which are notoriously difficult to generate in vitro because neurons derived from pluripotent stem cells typically retain an embryonic identity. We reconstructed a ~16 × 16 × 5.4 μm region of an 8 mo organoid (Figure 3g) and identified a total of 129 synapses (0.088 synapses per μm3, approximately in the range of human fetal cortex31; see Supplementary Discussion) (Figure 3h,i, videos S1 and S2). We analyzed 100 of these synapses; with two exceptions (two objects both receiving and making synapses), processes were either exclusively pre-synaptic (57 objects, axons) or exclusively post-synaptic (54 objects, dendrites), often making more than one synapse in the volume. The labeled dendrites had a total of 37 spines, which were variable in shape, but were often innervated by a synapse; 30 of these synapses were made on spines (Figure 3j,k, video S3).
These data indicate that long-term culture of human brain organoids allows continuing development to ultimately produce great cellular diversity and unprecedented neuronal maturation.
Human brain organoids develop spontaneously active neuronal networks and photosensitive cells
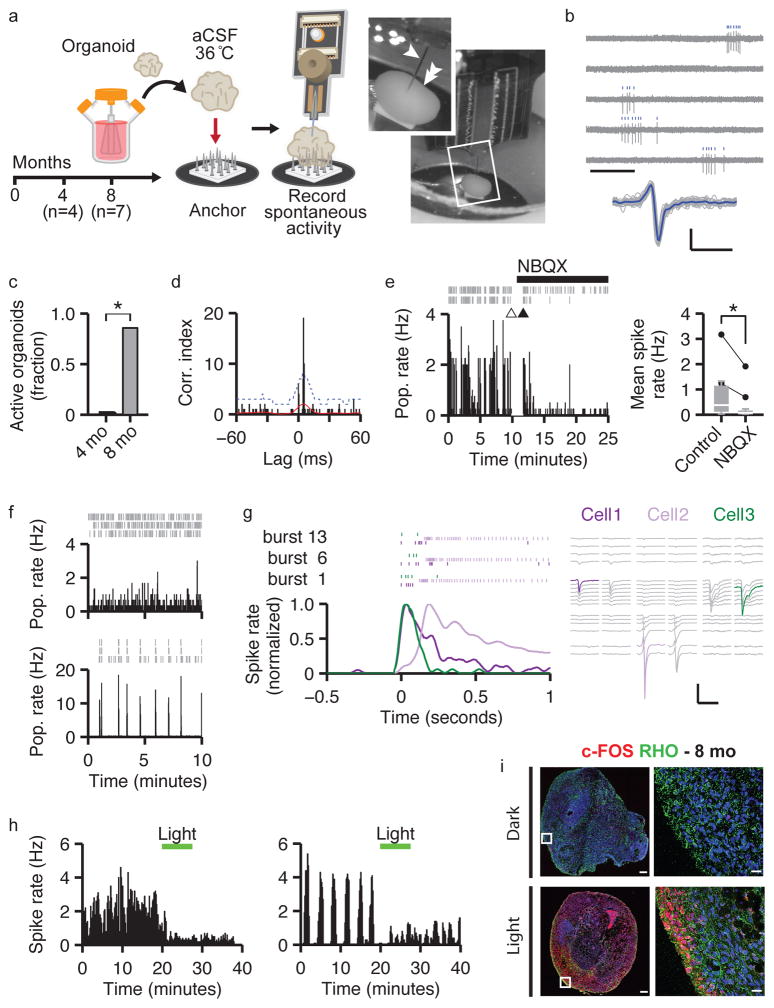
Given the enhanced maturity of the neurons generated, we investigated whether spontaneously active neuronal networks were present. We performed extracellular recordings with high-density silicon microelectrodes32 (Figure 4a and Extended Data Figure 7a), and were able to isolate spikes in six out of seven 8 mo organoids (11 recording sites, 32 units in total), with a median mean firing rate of 0.66 Hz (Q1–3=0.20–2.08 Hz). Spike rate was suppressed by bath application of TTX (2 μM), a voltage gated sodium channel antagonist (n=4 organoids; data not shown); together with the correspondence of the unit waveforms to standard structure, and the presence of typical refractory periods (Figure 4b and Extended Data Figure 7b), this indicates that the isolated spikes are action potentials. In contrast, no spontaneously firing neurons were detected in 4 mo organoids (n = 4 organoids; Figure 4c), in line with the progressive maturation seen in our single-cell transcriptome data.
Figure 4. Brain organoids develop spontaneous networks and photosensitive neurons that can be modulated by sensory stimulation with light.
a. Schematic and photograph of extracellular recordings from intact organoids. (arrow, probe; double arrow, organoid). b. Human brain organoids display spontaneous activity. Top, example raw traces and spike raster plots from a single unit (scale bar 0.5 s). Bottom, individual (gray) and average (blue) spike waveforms (scale bars, 0.5 ms, 50 μV). c. Organoids display spontaneous activity at 8 months (6 of 7) but not 4 months (0 of 4; Fisher’s exact test, p=0.015). d. Example spike-train cross-correlogram. The positive peak with a short time lag indicates mono-synaptic connections. Red line, estimated mean spike rate; Blue line, statistical threshold for identification of connected pairs (see Methods). e. NBQX attenuates activity. Left, example raster plots and population-averaged spiking rate (2 s bins; arrows, break to apply NBQX). Right, summary plot (n=12; pre-NBQX, M=0.380 Hz, Q1–3=0.115–1.145; post-NBQX, M=0.073 Hz, Q1–3=0.007–0.163; exact sign test, p<0.0005). f. Example population rate histograms (1 s bins), for organoids displaying bursts of activity (bottom) and without obvious bursting (top). Inset, raster plots of isolated units. g. Neuronal activity during population bursts shows temporal structure. Left, neuron mean firing rate aligned to burst onset and raster plots for 3 neurons (color-coded) in 3 example bursts. Right, mean spike waveforms recorded by probes (color, peak response; vertical order reflects probe geometry). Scale bars, 2 ms, 50 μV. h. Example rate histograms (10 s bins) for 2 cells showing light-attenuated activity (see Extended Data Figure 7 h–i). i. Light stimulation increases c-fos expression (red); rod-like cells are indicated by rhodopsin staining (green). Scale bars, main 250 μm, inset 20 μm. All: * denotes significance p < 0.05.
To determine if active neurons were functionally connected, we analyzed the spike train cross-correlograms and detected positive peaks with a short lag time, indicative of excitatory mono-synaptic connections33,34 (Figure 4d). Bath application of 20 μM NBQX35 significantly reduced the firing rate by 81% (Figure 4e), suggesting that the majority of recorded spikes were being driven by non-NMDA receptor mediated excitatory synaptic transmission.
We next assessed active neuronal networks by examining population firing characteristics. In all spontaneously active organoids (n=6), for the majority of isolated units, the statistical structure of the time-series indicated the presence of network activity (Extended Data Figure 7d). Three of these organoids displayed obvious burst firing patterns (Figure 4f, bottom panel), while the remaining 3 showed relatively stable firing patterns (Figure 4f, top panel). In bursting organoids, we observed sets of neurons displaying periods of coordinated activity (i.e., population bursts; 3 recording sites from 2 organoids). Interestingly, within these periods the order of neuronal recruitment and firing showed a clear and reproducible temporal structure (Figure 4g), reflected by asymmetry in the cross-correlograms (Extended Data Figure 7g). These results suggest that brain organoids establish neuronal networks that can support self-organized patterns of activity.
Our single-cell RNAseq analysis indicates that long-term cultures of human brain organoids support the differentiation of photoreceptor-like cells equipped with key proteins for light responsiveness. This is in agreement with the finding that retina organoids display photosensitive cells36. We therefore tested whether light-based physiological sensory stimuli could modulate neuronal activity. We investigated the effect of 530 nm light on the firing rate of 25 cells recorded from 10 organoids (7–9 mo), and identified a sub-population of neurons that displayed attenuated firing rates after light exposure (4 out of the 10 organoids tested had light-responsive units, Figure 4h and Extended Data Figure 7h,i). In agreement, cFos, an activity-dependent gene, was upregulated in 8 mo organoids after light exposure (Figure 4i). The data indicate that brain organoids establish spontaneously-active neuronal networks and generate functional photo-sensitive cells, which may in the future permit modulation of network activity using physiological sensory mechanisms.
Discussion
Human brain organoids have enormous potential to serve as in vitro models of the human brain. Fulfillment of this promise, however, requires a deeper knowledge of their cellular composition, and a better understanding of the extent and reproducibility with which they generate the cellular diversity of the brain, produce mature neuronal traits, and develop functional neuronal networks. We applied a very large single-cell transcriptional profiling to establish that human whole-brain organoids can achieve extensive development and maturation and generate an unprecedented diversity of cell types. In agreement with prior work examining a smaller number of cells from early-stage organoids17, the cells generated are closely related to their endogenous counterparts of the brain and retina.
In addition to mapping cellular diversity in organoids, we provide a first measure of the organoid-to-organoid variability in the generation of each cell type, and identify types that are reproducibly generated and others that appear more sporadically. Notably, this variability relates at least partly to bioreactor-based batch effects, suggesting a need for strategies to better control growth environment or to identify “successful” bioreactors a priori.
We find that upon maturation organoids acquire structural traits of mature neurons, including dendritic spine-like structures, which have been notoriously difficult to generate by in vitro directed differentiation. This offers the opportunity to study a new set of developmental processes, such as human synaptic pruning and active spine refinement, which could not previously be modeled in vitro.
By 8 months, whole-brain organoids also generate spontaneously-active neurons and neuronal networks, as well as photosensitive cells that can respond to non-invasive, light-based sensory stimulation. While we could not determine whether light directly alters the activity of photosensitive cells or modulates downstream neuronal networks, the work suggests that this model may make it possible to study the response of neuronal networks to physiological sensory stimuli, in parallel with engineered optogenetic systems. In future work, it will be important to identify the neuron types participating in these networks, ideally via strategies that link whole cell patch-clamp recordings to single-cell transcriptomes.
The diversity and maturation of cell types generated, the robustness of the neuronal networks, the presence of structural traits of mature neurons, and the possibility of using sensory experience to modulate neuronal activity collectively suggest that, beyond modeling early events of progenitor biology, these 3D brain organoids have the potential to model higher-order functions of the human brain, such as cellular interactions and neural circuit dysfunctions related to neurodevelopmental and neuropsychiatric pathologies.
Methods
Pluripotent stem cell culture
Human pluripotent stem cells used in these experiments were from the hiPSC11a line37 (gift from the Eggan lab, Harvard University), which we confirmed to be karyotipically normal. Cells were maintained in 10-cm tissue culture dishes (Corning) coated with 1% Geltrex membrane matrix (Thermo Fisher Scientific) in mTeSR medium (Stemcell Technologies). PSCs and colonies were dissociated with Gentle Cell Dissociation Reagent (Stemcell Technologies). All human pluripotent stem cells were maintained below passage 50 and confirmed negative for mycoplasma.
Long-term cultures of human brain organoids
Cerebral organoids were generated using a modified version of the protocol published by Lancaster et al.10. Embryoid bodies (EBs) were derived by dissociating PSCs colonies and plating 2,500 single cells in each well of a 96-well plate. EBs were cultured as described in 10. After five days in culture, EBs were transferred to Intermediate Induction Medium (IIM), consisting of DMEM/F12, 6% KOSR (Thermo Fisher Scientific), 0.9% FBS (GIBCO), 6 ng/ml bFGF (Peprotech), 0.7% N2 supplement (Invitrogen), Glutamax (Invitrogen), minimum-essential-media non-essential amino acids (MEM-NEAA) (Thermo Fisher Scientific), heparin 0.7 μg/ml (Sigma). Two days after plating in IIM, 500 μl of Neural Induction Medium (NIM) were added to each well. Following neural induction, organoids were embedded in Matrigel and transferred to cerebral differentiation medium (CDM) as described in10. A total of 40 organoids were added to each spinner flask, and medium was changed once every six days for the duration of the culture process. After one month, brain derived neurotrophic factor (BDNF) was supplemented to the CDM medium at a concentration of 14 ng/ml. Cerebral organoids were cultured for up to 13 months. For induction of hypoxia, six-month organoids were cultured in cerebral differentiation medium supplemented with 100μM cobalt (II) chloride (Millipore) in a conventional incubator (37°C; 5% C02) for 24 hours before fixation.
Histology and immunofluorescence
Cerebral organoids were fixed by immersion in 4% paraformaldehyde (Electron Microscopy Services), cryoprotected in 30% sucrose solution and then embedded in optimum cutting temperature (OCT) compound (Tissue Tek). Organoids were then cryosectioned at a thickness of 14 or 30 μm.
Immunohistochemistry was performed as previously described38. Primary antibodies and dilutions used were as listed at the end of this paragraph. Fluorescently-conjugated secondary antibodies used were Goat anti-rabbit IgG Alexa Fluor 488, 546 and 647 (Life Technologies A11070, A-11071, A21246), goat anti-chicken IgG Alexa Fluor 488, 546, 647 (Life Technologies A11039, A11040, A21449), goat anti-rat 488, 546, 647 (Life Technologies A11006, A11081, A21247), goat anti–mouse IgG Alexa Fluor 488, 546, 647 (Life Technologies A11017, A11018, A21237), Alexa Fluor donkey anti-mouse 488 (Life Technologies 715-545-151), Alexa Fluor donkey anti-rabbit 488 (Life Technologies A10036) Alexa Fluor donkey anti-rat 488 (Life Technologies A-21208), Alexa Fluor donkey anti-mouse 546 (Life Technologies A10036), Alexa Fluor donkey anti-goat 546 (Life Technologies A-11056), Alexa Fluor donkey anti-mouse (Life Technologies A31571), Alexa Fluor donkey anti-rabbit 647 (Life Technologies A10040). Secondary antibodies were diluted 1:1200. Rhodopsin immunohistochemistry was performed without Triton X-100 or Tween 20 to preserve membrane integrity, and signal was amplified using biotin (1:500, Vector BA9200) and streptavidin (1:600, Thermo Fisher S32354) conjugates. Cell nuclei were stained with Hoechst staining (1:5,000; Invitrogen), and slides were mounted using Fluoromount-G mounting medium.
Primary antibodies employed in this study:
| Antibody | Host | Company | Catalog | Dilution |
|---|---|---|---|---|
| AP2α | Mouse | U of Iowa | 3B5 | 1:100 |
| CTIP2 | Rat | Abcam | AB18465 | 1:100 |
| CUX1 | Mouse | Abcam | AB54583 | 1:350 |
| DCX | Goat | Santa Cruz | SC8066 | 1:300 |
| EMX1 | Rabbit | Sigma | HPA006421 | 1:50 |
| FOXG1 | Rabbit | Abcam | AB18259 | 1:300 |
| GFAP | Mouse | Sigma | G3893 | 1:400 |
| GABA | Rabbit | Sigma | A2052 | 1:1000 |
| GS | Rabbit | Abcam | AB73593 | 1:200 |
| HIF1α | Mouse | Abcam | AB16066 | 1:200 |
| ISL1 | Rabbit | Abcam | AB109517 | 1:2000 |
| MAP2 | Chicken | Abcam | AB5392 | 1:5000 |
| MITF | Mouse | Exalpha | X2398M | 1:500 |
| Nestin | Mouse | Abcam | AB6142 | 1:100 |
| NKX2.1 | Rabbit | DSBS | 74.5A5 | 1:250 |
| OTX2 | Rabbit | Abcam | AB21990 | 1:100 |
| PAX6 | Rabbit | Biolegend | 901301 | 1:400 |
| SYN1 | Mouse | SYSY | 106 001 | 1:100 |
| TH | Rabbit | Millipore | AB152 | 1:5000 |
| TUJ1 | Rabbit | Sigma | T2200 | 1:1000 |
| GBX2 | Goat | Abcam | AB109726 | 1:200 |
| OLIG2 | Rabbit | IBL | 18953 | 1:200 |
| VGLUT1 | Rabbit | SYSY | 135302 | 1:1000 |
| HOMER1 | Rabbit | SYSY | 160003 | 1:700 |
| c-FOS | Rabbit | Abcam | AB134122 | 1:500 |
| RHODOPSIN | Mouse | Abcam | AB5417 | 1:800 |
| VSX2 | Sheep | Millipore | AB9016 | 1:300 |
Microscopy and image analysis
All mounted sections were imaged using a Nikon Eclipse Ti microscope, analyzed with NIS Elements analysis software and processed using ImageJ. Confocal images were obtained using a Zeiss 700 confocal microscope. Images were collected and analyzed using the Zen 2010 program. For EM, images were processed using ImageJ, manually segmented using VAST Lite (freely available at https://software.rc.fas.harvard.edu/lichtman/vast/), and rendered in 3ds Max (Autodesk, Inc).
Drop-seq single cell sequencing
For the 6 mo dataset, we sequenced 19 organoids from 4 bioreactors: 4 organoids from bioreactor 1 (Org1A, 3,547 cells; Org1B, 3,463 cells; Org1C, 3,698 cells; Org1D, 2,811 cells), 3 organoids from bioreactor 2 (Org2A, 2,238 cells; Org2B, 3,159 cells; Org2C, 2,708 cells), 4 organoids from bioreactor 3 (Org3A, 4,225 cells; Org3B, 2,557 cells; Org3C, 3,614 cells; Org3D, 11,061 cells) and 8 organoids from bioreactor 4 (Org4A, 1,656 cells; Org4B, 1,663 cells; Org4C, 1,795 cells; Org4D, 2,151 cells; Org4E, 3,407 cells; Org4F 7,443 cells; Org4G, 2,905 cells; Org4H, 2,788 cells). For the 3 mo dataset, we sequenced 12 organoids from bioreactor 6 (8,478 cells) and bioreactor 7 (6,924 cells).
Droplets containing single cells and barcoded micro-particles were generated and processed as described in 11. Briefly, droplets were collected and beads were recovered and processed for immediate reverse transcription. The resulting cDNA was amplified, fragmented and further amplified using the Nextera XT DNA library preparation kit. Sequencing was performed on the Illumina NextSeq 500.
Clustering of cells derived from 6-month organoids was performed using the Seurat R package12, with some modifications from the procedure described previously11. Clustering was done in two iterative rounds of principal components analysis (PCA). First, digital gene expression matrices were column-normalized and log-transformed. Cells with fewer than 400 expressed genes were removed from analysis. A set of variable genes was then identified by binning the average expression of all genes into 300 evenly sized groups and computing the median dispersion (variance divided by the mean) in each bin. Genes were selected for inclusion in PCA that had higher than twice the median dispersion, minus the minimum value (final set: 1,568 genes). The edges of a nearest neighbor graph were generated by computing the fraction of shared nearest neighbors amongst cells in the first 20 PC dimensions using the approximate nearest neighbors package (ANN) in R (CRAN), setting the k parameter to 25 (“BuildSNN” function in Seurat). A first round of clustering with the Louvain modularity-based community detection algorithm39 set at a resolution of 0.01 was used to generate a total of 10 first-round clusters (“FindClusters” function in Seurat). The largest 50% of the cells from each of these clusters was again subjected to gene selection and PCA. These PCs were evaluated for statistically significant gene expression signals using the Jackstraw method11,40 (“JackStraw” function in Seurat). At most 15 PCs were used in this second round of clustering by Louvain, with the resolution parameter set at 3. The resulting clusters were compared pairwise for differential expression, as in11, and clusters with fewer than 10 genes differentially expressed by more than 2-fold were merged, producing 202 clusters. For analysis of organoid-to-organoid variability, organoids were excluded from a given cluster if they contributed less than 1% of the cells in that cluster.
Correlation analysis between gene expression in a dataset of human fetal cortex22 against the astrocyte cluster (c2) and the identified subclusters of the forebrain cluster (c4) was performed using the log average expression of a set of 104 genes, identified by taking the top 10 most differentially expressed genes for each cluster pair in the published fetal cortex dataset (some of which overlapped) as the most informative for distinguishing the reported endogenous cell classes of the cortex. We then constructed expression profiles for the six organoid cell groups and measured the correlation of gene expression levels for the 104 endogenous genes, comparing each of the endogenous cortical cell classes to each of the organoid cell groups. For the retinal subclusters (subclusters of c5), we repeated this correlation analysis against a dataset of P14 mouse retina11, using 110 genes, identified by taking the top 10 most enriched genes from the 11 major cell classes (horizontal cells, retinal ganglion cells, amacrine cells, photoreceptors, bipolar cells, and six glial retinal types) in the mouse dataset, and correlating against the expression profiles of the orthologous human genes in the six organoid retinal cell groups.
Electron microscopy
An 8 month old organoid was immersion-fixed in 2.5% Paraformaldehyde, 2.5% Glutaraldehyde in 0.1M Sodium Cacodylate buffer (EMS #15949) at room temperature for 24h. The organoid was washed in cold 0.15M Sodium Cacodylate buffer (Caco buffer), embedded in 4% low-melt agarose, and sectioned into 100 micrometer thick slices (Leica Vibratome) in cold Caco buffer (Extended Data Figure 6). 3 slices were selected for further processing. The results shown in Figure 3 and Extended Data Figure 6 come from one of those slices.
Preparation for EM was similar to that previously described41. Briefly, sections were washed in cold Caco buffer and stained for 2h in reduced 2% Osmium Tetroxide solution (with 15 mg/ml Potassium Ferrocyanide) on ice, washed, incubated in 1% Thiocarbohydrazide solution for 30 minutes, washed again, and finally stained with 2% Osmium Tetroxide solution for 1h (ROTO method). Slices were then dehydrated in a series of ascending Ethanol concentrations, followed by Acetone and Propylene Oxide, infiltrated with mixtures of Epoxy resin (variants of EPON) and Propylene Oxide, and embedded in 100% epoxy resin and cured at 60°C for two weeks. Blocks were trimmed and sectioned at 40 nm slice thickness with a Leica EM UC6 Ultramicrotome, and serial sections were collected on carbon-coated Kapton tape using an ATUM41. Strips of tape were mounted on silicon wafers and sections were post-stained with 2% Uranyl Acetate and Lead Aspartate (Leica Ultrastain). Slices were then imaged in a Zeiss Sigma scanning electron microscope.
A stack of 136 slice images was acquired using backscatter electron imaging (9 kV, 3 μs dwell time per pixel, 122882 pixels at 4 nm resolution). A roughly aligned region of 40962 pixels was cropped from the images and aligned using ImageJ (“Linear Stack Alignment with SIFT”, using expected transformation: Affine). The resulting aligned image stack was imported into VAST Lite for manual segmentation (freely available at https://software.rc.fas.harvard.edu/lichtman/vast/). 3D rendering was done in in 3ds Max (Autodesk, Inc). Data analysis was performed in Matlab (The Mathworks, Inc.). We noted that axons, more than dendrites, appeared to preferentially run parallel to the organoid surface (Wilcoxon rank-sum test, p<10−5; Figure 3i, video S2). For the Wilcoxon rank-sum test we first performed a principal component analysis of the point cloud of each axon and dendrite, and used the vertical components of each largest principal component of all axons vs. all dendrites.
Electrophysiology
Cerebral organoids were randomly selected and transferred from the culture flask to a recording chamber containing artificial cerebrospinal fluid composed of (in mM) NaCl (125.0), D-Glucose (10.0), NaHCO3 (26.2), KCl (3.5), NaH2PO4 (1.3), MgCl2 (1.0), CaCl2 (1.2), L-Ascorbic acid (1.0), and Na-Pyruvate (1.0), bubbled with carbogen (95% O2, 5% CO2). In the recording chamber, the organoid was immobilized by placing it on a small grid of spikes. Prior to recording, the organoids were initially held at 32 °C for 30 minutes, followed by a further 30 minutes acclimatisation at 36 °C (the recording temperature). The temperature of the recording chamber was monitored and maintained by a temperature control unit (TC-344C, Warner Instruments), and a custom built heating platform. During acclimatization and electrophysiological recordings, the organoids were maintained in the absence of ambient light. Extracellular silicon probes were positioned by a micromanipulator (Scientifica PatchStar) under infrared illumination (850nm LED) using a digital microscope (Dino-Lite Edge AM4115-FIT). Extracellular neurophysiological signals were recorded using high density silicon probes32 with a two-column, 32-row configuration of 9×9 μm PEDOT electroplated gold recording sites of 12 μm pitch. Signals were processed and digitized on a headstage proximal to the silicon probe (Intan RHD2000 chip, 30 kS/s per channel, 0.1 Hz high pass filter, 7.6 kHz anti-aliasing filter, 16-bit ADC), then acquired by a NeuroNexus SmartBox system. Wide-band data was stored for analysis. Spike detection was carried out by SpikeDetekt. The initial spike clustering was done by an unsupervised masked EM algorithm (KlustaKwik), followed by a stage of manual curation aided by KlustaViewa software (full procedure is described in 42). In order to show raw signal (Figure 4b), we applied a 117 Hz high-pass Daubechies 4 wavelet filter.
Spontaneous neuronal activity was recorded for at least 10 minutes. A cerebral organoid was classified as not active when no spontaneous action potentials were detected during 40 min of recording in at least 3 different recording sites. The 99% confidence bounds for the fano factor were approximated by a gamma distribution43. Mono-synaptic connections were identified by the detection of peaks or troughs, with a short time lag (< 5 ms), in the spike-train cross-correlograms33,34. The statistical threshold for the identification of connected pairs was set at the 99.9th percentile of the cumulative Poisson distribution for the estimated spike rate, which was calculated by convolving the cross-correlogram (0.5 ms bins) with a Gaussian window (s.d. 10 ms).
Light stimulation was controlled by in-house MATLAB scripts. Briefly, a national instruments board (NI PCIe-6323, X Series DAQ) was used to deliver TTL pulses to an external LED driver (LEDD1B, ThorLabs). For light stimulation, a 530 nm LED (Thorlabs, M530L3) was single band-pass filtered (11 nm bandwidth, Semrock FF01-530/11) and collimated. Using a calibrated meter and photodiode (PM100D and S130C, Thorlabs), the maximum LED power output was set to 300 μW/cm2, and the final output controlled by pulse width modulation. During light stimulation, ninety 200 ms pulses of 530 nm light were delivered at 0.2 Hz (the first 30 were 30 μW/cm2, the second 30 were at 100 μW/cm2, the final 30 were at 300 μW/cm2).
For the analysis of the light experiment, the mean spike rate recorded during a 5 min period post-light stimulus was normalized to a 5 minute period immediately before light stimulation. The baseline normalized spike rate was then fit by a series of Gaussian mixture models, with 1 to 4 components. Minimization of the Bayes Information Criterion was used to identify the optimal number of components. Post-fitting, data was partitioned according to the fit component with the largest posterior probability, weighted by the component probability. All analysis was done in Matlab, using statistics toolbox version 9.0 (fitgmdist.m and cluster.m). 4 units were excluded from analysis based on a mean baseline spike rate < 0.1 Hz (2 iPSC11a units and 2 HuES66 units).
Stock solutions of 2,3-Dioxo-6-nitro-1,2,3,4-tetrahydrobenzo[f]quinoxaline-7-sulfonamide disodium salt (NBQX disodium salt, Abcam; 100 mM) and Tetrodotoxin citrate (TTX, Abcam; 10 mM) were prepared in dd.H20.
All descriptive statistics and statistical tests were performed in MATLAB (version 8.3, R2014a, The MathWorks, Inc.), using the Statistics Toolbox (version 9.0, R2014a, The MathWorks, Inc.). The Lilliefors test was used to test for normality of data distributions. As the null hypothesis that the mean spike rates are normally distributed was rejected at the 5% level (p <0.001), appropriate non-parametric tests for paired and independent data sets were used to test for significance. All data sets met the assumptions of the applied statistical tests. Mean spike rate data is presented as Tukey style box plots, showing the 1st, 2nd, and 3rd quantile (Q1, M (median), & Q3 respectively; inter-quartile range, IQR = Q3-Q1). Box plot whiskers extend to the most extreme data points between Q1-1.5*IQR and Q3+1.5*IQR. For illustrative purposes, all data points outside the whiskers are plotted individually. When comparing groups, the equality of the variance was tested at the 5% significance level by a two-tailed squared ranks test. All statistical tests applied to the electrophysiological data were two-tailed, with a 5% significance level.
Data availability statement
Single cell RNA sequencing data that support the findings of this study have been deposited in NCBI GEO accession codes GSE86153.
Extended Data
Extended Data Figure 1. Time-course of expression of selected marker genes in human brain organoids.
a. Top: Expression of the hypoxia marker HIF1-α over 1 to 9 months of culture, and positive control (a 6 month organoid treated with cobalt (II) chloride, an activator of the hypoxia signaling pathway). Bottom: Expression of the apoptosis marker active caspase 3 over 1 to 9 months of culture. b. Expression of markers for progenitor, neuronal and glial populations over 1 to 9 months of culture. c. One month old brain organoids exhibit early brain regionalization, expressing markers of forebrain, midbrain, and hindbrain progenitors. d. One month old brain organoids express the cortical marker EMX1, the forebrain marker FOXG1, and the retina marker VSX2, with spatial segregation between regions positive for forebrain versus retinal markers. Scale bars, 250 μm (low magnification), 20 μm (high magnification).
Extended Data Figure 2. Decoding of the identity of cell types within the main clusters.
a. Heatmap of differentially expressed cell-type marker genes across each of the 10 main clusters. For gene lists and p-values, see Supplementary Table 1. b. Heatmap of average expression for representative marker genes and cell-type classification of the main clusters from the 6 mo organoid data set. c. Table of references used for cluster identification in a.
Extended Data Figure 3. Quantifying variability among organoids.
t-SNE plots depicting the proportion of cells each organoid contributed to each cell-type cluster. The cells are color-coded by the organoid of origin. The large plot shows the entire cluster, and the smaller plots show the contribution of each individual organoid, labeled with the percentage of cells within the cluster contributed by that organoid.
Extended Data Figure 4. Distribution and reproducibility of forebrain and retina cell types across organoids.
a. Immunohistochemical detection in a 6 month old organoid of the forebrain marker FOXG1 with the progenitor markers Nestin and SOX2 (left) and of FOXG1 with the corticofugal projection neuron marker CTIP2 and the callosal projection neuron marker SATB2 (right), all showing extensive co-coexpression, which was observed in all organoids examined (6 of 6). b. Count of cells assigned to each cortical cell type in individual organoids from Flask 3, and the percentage of each cell type out of all classified cortical cells in that organoid. c. Immunohistochemical detection of retinal cell types in 6 month organoids shows expression of known markers for amacrine cells, bipolar cells, retinal ganglion cells, Muller glia, rods, and retinal pigmented epithelium, observed across all organoids in every flask, n=11, 3 bioreactors. d. Count of cells assigned to each retinal cell type in individual organoids from Flasks 1, 2, and 3, and the percentage of each cell type out of all classified retinal cells in that organoid. IN: interneurons; IPC: intermediate progenitor cells; CfuPN: corticofugal projection neurons; CPN: callosal projection neurons; RG: radial glial cells; MG: Muller glia; PE: pigmented epithelium; PHOTO: photoreceptors; RGC: retinal ganglion cells; BP: bipolar cells; AC: amacrine cells.
Extended Data Figure 5. Correlation analysis for organoid cell types vs. fetal human cortex and mouse retina.
a. Correlation between expression patterns of highly variable genes between cell populations within a previously published single-cell RNAseq dataset of human fetal cortex22 against the organoid astrogial cluster (c2) and the identified subclusters of the forebrain cluster (c4). IPC, intermediate progenitor cells. b. Correlation between expression patterns of highly variable genes between cell populations within a previously published single-cell RNAseq dataset of P14 mouse retina11 and the cell populations identified within the retinal cluster (c5) in our organoid dataset. RGC: retinal ganglion cells; Pigmented Epi: pigmented epithelium. Scale bars represent the range of the coefficients of determination (r2) in each analysis.
Extended Data Figure 6. Electron microscopy of an 8 month old human brain organoid.
a. Whole organoid before vibratome sectioning shows regional structures. Red line shows approximate location of the vibratome slice. b. Example 40 nm section. c. Regular finger-like membrane stack could indicate development of the outer segment of a retinal rod cell. d. Stacked endoplasmic reticulum. e. Example synapse with crystalline-looking arrangement of vesicles. f. Putative muscle cell characterized by a large cell body with a diameter of about 30 μm highlighted in an organoid section stained with eosin-haematoxylin. Scale bar, 50 μm. g. Example of a muscle cell showing a distribution of the mitochondria near the cell surface, typical for muscle cells. Scale bar, 10 μm. h. Large cell body with muscle fibers highlighted in blue. Enlarged red square region shows muscle fibers with sarcomeres. Scale bar, 10 μm (low magnification) and 1 μm (enlargement). i. Left, one of the dark cell bodies appearing as dark spots on the organoid surface. Right, cell reaching to the surface of the organoid. Scale bar, 10 μm. j. Several cell bodies with different morphologies and cytoplasm content highlighted in color. Scale bar, 10 μm.
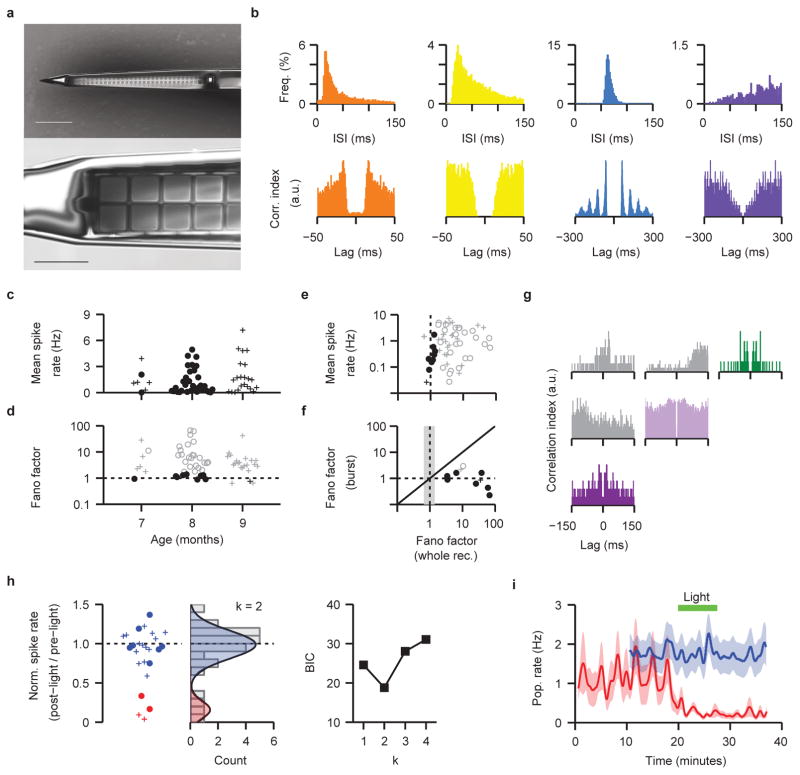
Extended Data Figure 7. Statistical structure of spontaneous firing activity in human brain organoids.
a. Electron micrograph of a 64-channel high-density probe shank (corresponding to the tip of the device shown in Fig. 4a) with two columns of 32 rows of recording sites, visible as squares along the center of the shank (top panel). The recording sites consist of 9×9 μm exposed gold pads (bottom panel) that are PEDOT electroplated to lower electrical impedances. Each recording site is connected to the outside by insulated nanofabricated wires, running along the length of the probe shank (visible as gray lines flanking the recording sites). The shank width is tapered from 35 to 60 μm wide, and is 15 μm thick. Scale bars, 100 μm (top), 20 μm (bottom). b. Example inter-spike interval (top) and auto-correlogram (bottom) plots for spontaneous activity recorded from 4 prototypical units; 1 ms bins. c. Plot of the mean spike rate in iPSC11a (o) and HuES66 (+) organoids recorded at 7–9 months. The difference between the median of the mean spike rates in the two organoid lines are non-significant (iPSC11a n= 34 cells, 12 recording sites, 7 organoids, M= 0.662, Q1= 0.186, Q3= 2.071; HuES66 n= 27 cells, 9 recording sites, 8 organoids, M=1.186, Q1= 0.463, Q3= 2.848; 2 tailed Wilcoxon rank sum test, 5% significance level, z= -1.47, p= 0.14; squared rank test suggests that the variance of mean spike rate in the two organoid lines is not significantly different, z= -1.47, p= 0.141). d. Plot of the fano factor against organoid age. e. Plot of mean spike rate against the fano factor (n = 61 neuronal units, from 15 organoids). Fano factors that are outside the expected 99% confidence bounds are plotted in gray; those that are within the 99% confidence bounds are plotted in black. A time-series fano factor greater than 1 indicates that the unit firing is not well modeled by a stationary Poisson distribution, and points at the presence of network activity. f. Plot of the fano factor calculated across the whole recording versus the fano factor calculated during the population bursts. Shaded region highlights the 99% confidence bounds for a whole-recording fano factor of 1. Black symbols correspond to units with a fano factor close to 1, consistent with a stationary Poisson distributed system and implying a fixed firing profile during the first second of population burst. g. Spike train auto-correlogram (color) and cross-correlogram (gray) for the three units presented in Figure 4g. Color-coding as in Figure 4g. h. Left, baseline normalized spike rate (n = 25 cells from 10 organoids; o, iPSC11a, n = 9 cells 4 organoids; +, HuES66, n = 16 cells 6 organoids); color identifies the clustering of data points into responders (red) and non-responders (blue). Middle, count histogram of the data plot in the left panel overlaid by the optimal Gaussian mixture model (number of components k = 2; see Methods). The two underlying distributions are plotted as shaded regions (μ1= 0.16, σ1= 0.11, mixing proportion= 0.16; μ2= 0.99, σ2= 0.18, mixing proportion= 0.84). Right, plot of the Bayes Information Criterion (BIC) generated for the Gaussian mixture models with k components. BIC is minimized at k = 2, signifying that the data is best described by a bimodal distribution (see middle panel). i. Population averaged activity for the two populations of neurons (responders in red, n=4 neurons; non-responders in blue, n=21 neurons); error envelope (shaded) is the s.e.m. In the 4 responsive organoids, light stimulation attenuated firing rate in 4 out of 5 isolated neurons.
Supplementary Material
Acknowledgments
We are grateful to Juliana Brown, Steve Hyman, Guoping Feng, Zhanyan Fu, Alejandro Schinder, Lee Rubin, Francesca Rapino, Emilio Kropff and members of the Arlotta lab for insightful discussions and editing of the manuscript. We thank Alex Pollen and Arnold Kriegstein for sharing of human single-cell datasets and Connie Cepko for generous sharing of antibodies. We thank Helen Zhang for outstanding technical support. We thank Frank Yates and Serena Pavoni for helpful advice on culturing organoids. This work was supported by grants from the Stanley Center for Psychiatric Research, the Broad Institute of Harvard and MIT, and the Star Family Award of Harvard University to PA. ESB acknowledges NIH Director’s Pioneer Award 1DP1NS087724. JL acknowledges support by IARPA, Conte and MURI Army Research Office. PA and ESB are New York Stem Cell Foundation-Robertson Investigators.
Footnotes
Author Contribution:
PA and GQ conceived the experiments. GQ developed long-term cultures of organoids and performed all immunohistochemical characterization with help from NM. EZM, GQ, TN, and MG performed all single cell sequencing experiments. EZM, GQ, TN, PA and SAM analyzed and interpreted the drop-seq data. JLS, SMY and ZMW performed electrophysiological experiments. JS, JK and ESB developed multielectrode probes and helped JLS adapt them to organoids. DB and JL performed EM work. PA, GQ, EZM and SAM wrote the manuscript with contributions from all authors.
Competing financial interests
The authors declare no competing financial interests.
References
- 1.Kelava I, Lancaster MA. Stem Cell Models of Human Brain Development. Cell Stem Cell. 2016;18:736–748. doi: 10.1016/j.stem.2016.05.022. [DOI] [PubMed] [Google Scholar]
- 2.Lancaster MA, et al. Cerebral organoids model human brain development and microcephaly. Nature. 2013;501:373–379. doi: 10.1038/nature12517. [DOI] [PMC free article] [PubMed] [Google Scholar]
- 3.Cugola FR, et al. The Brazilian Zika virus strain causes birth defects in experimental models. Nature. 2016;534:267–271. doi: 10.1038/nature18296. [DOI] [PMC free article] [PubMed] [Google Scholar]
- 4.Dang J, et al. Zika Virus Depletes Neural Progenitors in Human Cerebral Organoids through Activation of the Innate Immune Receptor TLR3. Cell Stem Cell. 2016 doi: 10.1016/j.stem.2016.04.014. [DOI] [PMC free article] [PubMed] [Google Scholar]
- 5.Garcez PP, et al. Zika virus impairs growth in human neurospheres and brain organoids. Science. 2016 doi: 10.1126/science.aaf6116. [DOI] [PubMed] [Google Scholar]
- 6.Nowakowski TJ, et al. Expression Analysis Highlights AXL as a Candidate Zika Virus Entry Receptor in Neural Stem Cells. Cell Stem Cell. 2016 doi: 10.1016/j.stem.2016.03.012. [DOI] [PMC free article] [PubMed] [Google Scholar]
- 7.Qian X, et al. Brain-Region-Specific Organoids Using Mini-bioreactors for Modeling ZIKV Exposure. Cell. 2016;165:1238–1254. doi: 10.1016/j.cell.2016.04.032. [DOI] [PMC free article] [PubMed] [Google Scholar]
- 8.Mariani J, et al. FOXG1-Dependent Dysregulation of GABA/Glutamate Neuron Differentiation in Autism Spectrum Disorders. Cell. 2015;162:375–390. doi: 10.1016/j.cell.2015.06.034. [DOI] [PMC free article] [PubMed] [Google Scholar]
- 9.Quadrato G, Brown J, Arlotta P. The promises and challenges of human brain organoids as models of neuropsychiatric disease. Nat Med. 2016;22:1220–1228. doi: 10.1038/nm.4214. [DOI] [PubMed] [Google Scholar]
- 10.Lancaster MA, Knoblich JA. Generation of cerebral organoids from human pluripotent stem cells. Nat Protoc. 2014;9:2329–2340. doi: 10.1038/nprot.2014.158. [DOI] [PMC free article] [PubMed] [Google Scholar]
- 11.Macosko EZ, et al. Highly Parallel Genome-wide Expression Profiling of Individual Cells Using Nanoliter Droplets. Cell. 2015;161:1202–1214. doi: 10.1016/j.cell.2015.05.002. [DOI] [PMC free article] [PubMed] [Google Scholar]
- 12.Satija R, Farrell JA, Gennert D, Schier AF, Regev A. Spatial reconstruction of single-cell gene expression data. Nat Biotechnol. 2015;33:495–502. doi: 10.1038/nbt.3192. [DOI] [PMC free article] [PubMed] [Google Scholar]
- 13.Amir ED, et al. viSNE enables visualization of high dimensional single-cell data and reveals phenotypic heterogeneity of leukemia. Nat Biotechnol. 2013;31:545–552. doi: 10.1038/nbt.2594. [DOI] [PMC free article] [PubMed] [Google Scholar]
- 14.van der Maaten LaH. Geoffrey Visualizing Data using t-SNE. Journal of Machine Learning Research. 2008;9:2579–2605. [Google Scholar]
- 15.Arlotta P, et al. Neuronal subtype-specific genes that control corticospinal motor neuron development in vivo. Neuron. 2005;45:207–221. doi: 10.1016/j.neuron.2004.12.036. S0896627304008530 [pii] [DOI] [PubMed] [Google Scholar]
- 16.Cahoy JD, et al. A transcriptome database for astrocytes, neurons, and oligodendrocytes: a new resource for understanding brain development and function. The Journal of neuroscience: the official journal of the Society for Neuroscience. 2008;28:264–278. doi: 10.1523/JNEUROSCI.4178-07.2008. [DOI] [PMC free article] [PubMed] [Google Scholar]
- 17.Camp JG, et al. Human cerebral organoids recapitulate gene expression programs of fetal neocortex development. Proc Natl Acad Sci U S A. 2015;112:15672–15677. doi: 10.1073/pnas.1520760112. [DOI] [PMC free article] [PubMed] [Google Scholar]
- 18.Darmanis S, et al. A survey of human brain transcriptome diversity at the single cell level. Proc Natl Acad Sci U S A. 2015;112:7285–7290. doi: 10.1073/pnas.1507125112. [DOI] [PMC free article] [PubMed] [Google Scholar]
- 19.Lake BB, et al. Neuronal subtypes and diversity revealed by single-nucleus RNA sequencing of the human brain. Science. 2016;352:1586–1590. doi: 10.1126/science.aaf1204. [DOI] [PMC free article] [PubMed] [Google Scholar]
- 20.Marques S, et al. Oligodendrocyte heterogeneity in the mouse juvenile and adult central nervous system. Science. 2016;352:1326–1329. doi: 10.1126/science.aaf6463. [DOI] [PMC free article] [PubMed] [Google Scholar]
- 21.Molyneaux BJ, et al. Novel subtype-specific genes identify distinct subpopulations of callosal projection neurons. J Neurosci. 2009;29:12343–12354. doi: 10.1523/JNEUROSCI.6108-08.2009. 29/39/12343 [pii] [DOI] [PMC free article] [PubMed] [Google Scholar]
- 22.Pollen AA, et al. Molecular identity of human outer radial glia during cortical development. Cell. 2015;163:55–67. doi: 10.1016/j.cell.2015.09.004. [DOI] [PMC free article] [PubMed] [Google Scholar]
- 23.Siegert S, et al. Transcriptional code and disease map for adult retinal cell types. Nat Neurosci. 2012;15:487–495. s481–482. doi: 10.1038/nn.3032. [DOI] [PubMed] [Google Scholar]
- 24.Strunnikova NV, et al. Transcriptome analysis and molecular signature of human retinal pigment epithelium. Hum Mol Genet. 2010;19:2468–2486. doi: 10.1093/hmg/ddq129. [DOI] [PMC free article] [PubMed] [Google Scholar]
- 25.Xia N, et al. Transcriptional comparison of human induced and primary midbrain dopaminergic neurons. Sci Rep. 2016;6:20270. doi: 10.1038/srep20270. [DOI] [PMC free article] [PubMed] [Google Scholar]
- 26.Zhang Y, et al. An RNA-sequencing transcriptome and splicing database of glia, neurons, and vascular cells of the cerebral cortex. J Neurosci. 2014;34:11929–11947. doi: 10.1523/jneurosci.1860-14.2014. [DOI] [PMC free article] [PubMed] [Google Scholar]
- 27.Zhang Y, et al. Purification and Characterization of Progenitor and Mature Human Astrocytes Reveals Transcriptional and Functional Differences with Mouse. Neuron. 2016;89:37–53. doi: 10.1016/j.neuron.2015.11.013. [DOI] [PMC free article] [PubMed] [Google Scholar]
- 28.Furukawa T, Morrow EM, Cepko CL. Crx, a novel otx-like homeobox gene, shows photoreceptor-specific expression and regulates photoreceptor differentiation. Cell. 1997;91:531–541. doi: 10.1016/s0092-8674(00)80439-0. [DOI] [PubMed] [Google Scholar]
- 29.Korf HW, White BH, Schaad NC, Klein DC. Recoverin in pineal organs and retinae of various vertebrate species including man. Brain Res. 1992;595:57–66. doi: 10.1016/0006-8993(92)91452-k. [DOI] [PubMed] [Google Scholar]
- 30.Dennis G, Jr, et al. DAVID: Database for Annotation, Visualization, and Integrated Discovery. Genome Biol. 2003;4:P3. [PubMed] [Google Scholar]
- 31.Huttenlocher PR, Dabholkar AS. Regional differences in synaptogenesis in human cerebral cortex. J Comp Neurol. 1997;387:167–178. doi: 10.1002/(sici)1096-9861(19971020)387:2<167::aid-cne1>3.0.co;2-z. [DOI] [PubMed] [Google Scholar]
- 32.Scholvin J, et al. Close-Packed Silicon Microelectrodes for Scalable Spatially Oversampled Neural Recording. IEEE transactions on bio-medical engineering. 2016;63:120–130. doi: 10.1109/tbme.2015.2406113. [DOI] [PMC free article] [PubMed] [Google Scholar]
- 33.Fujisawa S, Amarasingham A, Harrison MT, Buzsaki G. Behavior-dependent short-term assembly dynamics in the medial prefrontal cortex. Nat Neurosci. 2008;11:823–833. doi: 10.1038/nn.2134. [DOI] [PMC free article] [PubMed] [Google Scholar]
- 34.Stark E, Abeles M. Unbiased estimation of precise temporal correlations between spike trains. J Neurosci Methods. 2009;179:90–100. doi: 10.1016/j.jneumeth.2008.12.029. [DOI] [PubMed] [Google Scholar]
- 35.Zeman S, Lodge D. Pharmacological characterization of non-NMDA subtypes of glutamate receptor in the neonatal rat hemisected spinal cord in vitro. Br J Pharmacol. 1992;106:367–372. doi: 10.1111/j.1476-5381.1992.tb14342.x. [DOI] [PMC free article] [PubMed] [Google Scholar]
- 36.Zhong X, et al. Generation of three-dimensional retinal tissue with functional photoreceptors from human iPSCs. Nat Commun. 2014;5:4047. doi: 10.1038/ncomms5047. [DOI] [PMC free article] [PubMed] [Google Scholar]
- 37.Boulting GL, et al. A functionally characterized test set of human induced pluripotent stem cells. Nat Biotechnol. 2011;29:279–286. doi: 10.1038/nbt.1783. [DOI] [PMC free article] [PubMed] [Google Scholar]
- 38.Quadrato G, et al. Nuclear factor of activated T cells (NFATc4) is required for BDNF-dependent survival of adult-born neurons and spatial memory formation in the hippocampus. Proc Natl Acad Sci U S A. 2012;109:E1499–1508. doi: 10.1073/pnas.1202068109. [DOI] [PMC free article] [PubMed] [Google Scholar]
- 39.Waltman L, van Eck NJ. A smart local moving algorithm for large-scale modularity-based community detection. The European Physical Journal B. 2013;86:1–14. doi: 10.1140/epjb/e2013-40829-0. [DOI] [Google Scholar]
- 40.Chung NC, Storey JD. Statistical significance of variables driving systematic variation in high-dimensional data. Bioinformatics. 2015;31:545–554. doi: 10.1093/bioinformatics/btu674. [DOI] [PMC free article] [PubMed] [Google Scholar]
- 41.Kasthuri N, et al. Saturated Reconstruction of a Volume of Neocortex. Cell. 2015;162:648–661. doi: 10.1016/j.cell.2015.06.054. [DOI] [PubMed] [Google Scholar]
- 42.Rossant C, et al. Spike sorting for large, dense electrode arrays. Nat Neurosci. 2016;19:634–641. doi: 10.1038/nn.4268. [DOI] [PMC free article] [PubMed] [Google Scholar]
- 43.Eden UT, Kramer MA. Drawing inferences from Fano factor calculations. J Neurosci Methods. 2010;190:149–152. doi: 10.1016/j.jneumeth.2010.04.012. [DOI] [PubMed] [Google Scholar]
Associated Data
This section collects any data citations, data availability statements, or supplementary materials included in this article.
Supplementary Materials
Data Availability Statement
Single cell RNA sequencing data that support the findings of this study have been deposited in NCBI GEO accession codes GSE86153.


