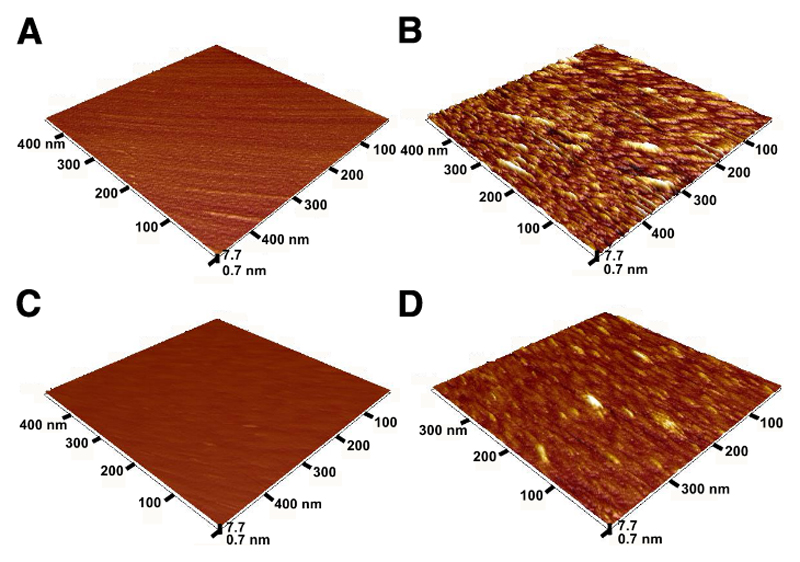
Figure 5.
AFM images of the glycan biosensor 2 before (A) and after incubation with GOD-2C4 analyte (B) and of the glycan biosensor 3 before (C) and after incubation with GOD-2C4 analyte (D). In all four AFM images z-axis is the same for better comparison of the size of features present on the surface.

