Abstract
Prenatal testosterone (T) excess in sheep leads to peripheral insulin resistance (IR), reduced adipocyte size, and tissue-specific changes, with liver and muscle but not adipose tissue being insulin resistant. To determine the basis for the tissue-specific differences in insulin sensitivity, we assessed changes in negative (inflammation, oxidative stress, and lipotoxicity) and positive mediators (adiponectin and antioxidants) of insulin sensitivity in the liver, muscle, and adipose tissues of control and prenatal T–treated sheep. Because T excess leads to maternal hyperinsulinemia, fetal hyperandrogenism, and functional hyperandrogenism and IR in their female offspring, prenatal and postnatal interventions with antiandrogen, flutamide, and the insulin sensitizer rosiglitazone were used to parse out the contribution of androgenic and metabolic pathways in programming and maintaining these defects. Results showed that (1) peripheral IR in prenatal T–treated female sheep is related to increases in triglycerides and 3-nitrotyrosine, which appear to override the increase in high-molecular-weight adiponectin; (2) liver IR is a function of the increase in oxidative stress (3-nitrotyrosine) and lipotoxicity; (3) muscle IR is related to lipotoxicity; and (4) the insulin-sensitive status of visceral adipose tissue appears to be a function of the increase in antioxidants that likely overrides the increase in proinflammatory cytokines, macrophages, and oxidative stress. Prenatal and postnatal intervention with either antiandrogen or insulin sensitizer had partial effects in preventing or ameliorating the prenatal T–induced changes in mediators of insulin sensitivity, suggesting that both pathways are critical for the programming and maintenance of the prenatal T–induced changes and point to potential involvement of estrogenic pathways.
Prenatally testosterone excess induces tissue-specific changes in negative and positive mediators of insulin sensitivity in a manner consistent with their insulin sensitivity status.
Peripheral insulin resistance (IR) is a common metabolic phenotype associated with obesity, type 2 diabetes mellitus, and polycystic ovary syndrome (PCOS) (1). Other metabolic dysfunctions observed are impaired glucose tolerance, dyslipidemia, and increased risk for cardiovascular disease (1, 2). Although the modern lifestyle, with its high-caloric diet and overnutrition together with a sedentary way of life, has contributed to the development of metabolic disorders (3), considerable evidence suggests that developmental insults (4), including exposure to excess native steroids during disease states (5) and environmental endocrine-disrupting chemicals with steroidogenic potential (6, 7) during the perinatal period, can also culminate in metabolic disorders. For instance, gestational exposure to excess testosterone (T) in rodents, sheep, and nonhuman primates leads to reproductive and metabolic defects similar to those seen in women with PCOS (8, 9). In the sheep model of gestational exposure to excess T, the main metabolic abnormalities observed are peripheral IR, dyslipidemia with increased palmitic acid in circulation, and reduced adipocyte size (10–12). In addition, tissue-specific studies of members of the insulin signaling pathway have suggested that liver and muscle are insulin resistant, whereas adipose tissue is insulin sensitive (13, 14). Similarly, rats exposed to excess prenatal dihydrotestosterone manifest hyperinsulinemia, with an associated increase in adiposity, dyslipidemia, and hepatic steatosis (15).
The underlying mechanisms leading to development of IR with prenatal exposure to excess androgens remain to be delineated. In other conditions of IR, such as that induced by obesity, chronic low-grade inflammation in adipose tissue, along with dyslipidemia, oxidative stress, and lipotoxicity in metabolic tissues, appear to contribute to the development of IR (16–18). In these scenarios, the development of chronic low-grade inflammation in adipose tissues appears to involve infiltration of macrophages, leading to activation of the immune system and to a consequent increase in proinflammatory cytokines (17, 19), which act in an autocrine and paracrine manner to interfere with insulin signaling (17) and to promote lipolysis, causing dyslipidemia (18). Increased accumulation of lipids also correlates with oxidative stress (20), which can interfere with insulin action in metabolic tissues (18). Additionally, an increase in circulating lipids can lead to ectopic accumulation of lipids in liver and muscle, causing lipotoxicity, which, coupled with the ability of lipids to negatively regulate glucose metabolism and insulin action (21, 22), can result in disruption of insulin signaling and development of IR (23).
Alternatively, decreased expression of mediators that promote tissue insulin sensitivity could also lead to development of IR. One such molecule that has gained prominence is the adipokine adiponectin (ADIPOQ). Adiponectin, secreted predominantly by adipose tissue [although other tissues, such as muscle, produce them (24)], exists in the circulation as a wide range of multimer complexes, with low (LMW), middle (MMW), and high molecular weight (HMW) forms being the major ones. They act through the adiponectin receptors ADIPOR1 and ADIPOR2, which are expressed in majority of the tissues (25) and signal through phosphorylation of 5′ AMP-activated protein kinase (AMPK) (26). Of the oligomeric forms of adiponectin, the HMW form has been demonstrated to be the most metabolically active (27). Adiponectins exert antidiabetic, antiatherogenic, and anti-inflammatory activities, with hypoadiponectinemia strongly associated with metabolic disorders (28–30).
Antioxidant enzymes, such as glutathione reductase (GSR) and superoxide dismutases (SODs), can also promote insulin signaling by neutralizing reactive oxygen or nitrogen species, which increase oxidative stress (31). Considering the multiple pathways that can affect insulin signaling, the primary goal of this study was to determine whether the insulin-sensitive status of the metabolic tissues in prenatal T–treated female sheep is reflective of changes in adiponectin, inflammatory/oxidative stress pathways, and lipotoxicity.
Because gestational testosterone excess induces maternal hyperinsulinemia and increases fetal testosterone and estradiol levels (32, 33), the developmental changes in mediators of tissue-specific insulin sensitivity could be programmed by androgenic, estrogenic, or insulin-dependent pathways. Additionally, because prenatal T treatment in female sheep culminates in functional hyperandrogenism and hyperinsulinemia in the female offspring (10), the prevailing steroidal and insulin status may regulate expression of mediators of insulin sensitivity in target tissues. Therefore, using an androgen antagonist and an insulin sensitizer as pharmacological interventions, the second goal of this study was to dissect out the organizational (prenatal) as well as the activational (postnatal) role of androgen and insulin in programming as well as the maintenance of the tissue-specific mediators of insulin sensitivity with focus on adiponectin, markers of macrophage infiltration, inflammation, oxidative stress, and lipotoxicity.
Materials and Methods
Animals
All procedures involving animals in this study were approved by the Institutional Animal Care and Use Committee of the University of Michigan and are consistent with the National Institutes of Health Guide for the Care and Use of Laboratory Animals. All studies were conducted using multiparous Suffolk sheep at the University of Michigan Sheep Research Facility (Ann Arbor, MI). Animal maintenance, breeding, prenatal treatments, and lambing were performed as described previously (34). In brief, about 2 to 3 weeks before and until the time of breeding, ewes were group-fed daily with 0.5 kg shelled corn and 1.0 to 1.5 kg alfalfa hay per ewe. Ewes were mated to raddled Suffolk rams of proven fertility and housed under a natural photoperiod in the pasture and group-fed with a daily maintenance diet of 1.25 kg alfalfa/brome mix hay per ewe.
After weaning at ∼8 weeks of age, female lambs were maintained outdoors and fed a pelleted diet (Shur-Gain; Nutreco Canada Inc., Guelph, Canada) comprised of 3.6 MCal/kg digestible energy and 18% crude protein.
Prenatal and postnatal treatments
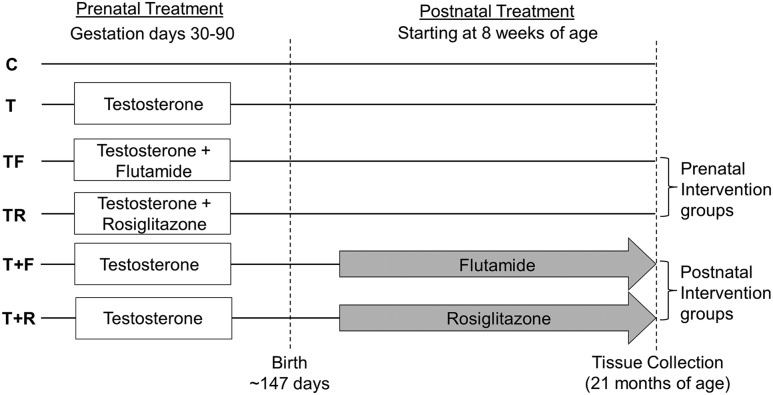
Pregnant ewes were blocked by body score and weight and randomly assigned to four prenatal treatment groups: control (C), prenatal T–treated, prenatal T + androgen receptor antagonist (flutamide)–treated (TF), and prenatal T + insulin sensitizer (rosiglitazone)–treated (TR) (Fig. 1). Gestational T treatment consisted of twice weekly intramuscular administration of 100 mg T propionate (1.2 mg/kg) (Sigma-Aldrich, St. Louis, MO) suspended in 2 mL corn oil from day 30 to day 90 of gestation. To generate the TF group, capsules (Profill Capsule Filling System; Torpac, Fairfield, NJ) filled with flutamide (15 mg/kg) (Sigma-Aldrich) were administered daily at the dose shown to block the phenotypic virilization effects of both exogenous and endogenous androgens in male and prenatal T–treated female sheep (36). To generate the TR group, rosiglitazone (∼0.11 mg/kg) (Avandia; GlaxoSmithKline, Research Triangle Park, NC), at the dose shown previously to normalize the insulin to glucose ratio during gestation (33) and to restore insulin sensitivity (37) in prenatal T–treated sheep, was administered orally on a daily basis.
Figure 1.
Schematic showing the study design with the time and duration of different pre- and postnatal treatments used in this study. Modified from Padmanabhan et al. (35).
A subset of prenatal T–treated female sheep received postnatal treatments from 8 weeks of age (Fig. 1). They received flutamide (T+F; 15 mg/kg/d) or rosiglitazone (T+R; 0.11 mg/kg/d) by oral administration of packed capsules or tablets, respectively, which continued until the time of tissue harvest. The dosage was adjusted on the basis of weekly body weight measurements. The sample sizes for the prenatal treatment groups were C = 6, T = 5, TF = 8, and TR = 5. The numbers of animals in each postnatal treatment groups were T+F = 5 and T+R = 7. When multiple pregnancies were involved, only one offspring was used in any given treatment group. The effects of prenatal as well as postnatal interventions on estradiol-positive feedback, puberty, insulin sensitivity, and adipocyte size involving animals from this cohort have been previously published (11, 14, 35, 38).
Tissue collection
All animals were ovariectomized at the end of the second breeding season to prevent confounding effects from differing steroid background, and a 1-cm estradiol implant was placed subcutaneously as described previously (39) to maintain early follicular phase levels of estradiol. Twenty-eight days later, animals were implanted subcutaneously with two controlled internal drug-releasing implants containing progesterone (CIDR-G; InterAg, Hamilton, New Zealand). Progesterone implants were removed 14 days later, and four 30-mm estradiol implants were inserted subcutaneously. Tissues were harvested 18 hours later during the artificial follicular phase after euthanization by barbiturate overdose (Fatal Plus; Vortech Pharmaceuticals, Dearborn, MI). Blood samples were collected in a heparinized tube prior to barbiturate administration. All animals were fasted for 48 hours prior to tissue collection. Liver was obtained from the tip of the left lobe, skeletal muscle from the vastus lateralis, subcutaneous adipose tissue (SAT) from the sterna region, and visceral adipose tissue (VAT) from the mesenteric fat surrounding the ventral sac of the rumen. Tissues were flash-frozen and stored at −80°C until processed.
Real-time reverse transcription-polymerase chain reaction
Total RNA was isolated using Trizol reagent (Invitrogen, Carlsbad, CA), DNAse treated, and purified using the RNAeasy kit (Qiagen, Germantown, MD) as per the manufacturer’s guidelines. Total RNA was reverse transcribed into cDNA using the SuperScrit Vilo cDNA synthesis kit (Invitrogen) for use in the gene expression analysis. An SYBRgreen-based real-time reverse transcription polymerase chain reaction assay was used to determine the messenger RNA (mRNA) levels on a BioRad myiQ iCycler real-time polymerase chain reaction instrument. Oligonucleotide primers for the genes under study were designed using Primer Express software (Life Technologies, Carlsbad, CA), and the sequences for the primers used are shown in Supplemental Table 1 (15.1KB, docx) . The relative amount of each transcript was calculated using the ΔΔCT method and normalized to the endogenous reference gene ribosomal protein L19.
Immunoblotting
Plasma adiponectin was assessed using a previously published method (40) using the bovine antiadiponectin antibody kindly provided by Dr. Helga Sauerwein from University of Bonn, Germany. Briefly, 2.0 μL plasma was diluted 10-fold in phosphate-buffered saline and loaded onto sodium dodecyl sulfate polyacrylamide gel electrophoresis gels. Plasma proteins were separated under reducing conditions to detect LMW forms and under nonreducing conditions to detect HMW forms and transferred to nitrocellulose membranes. Membranes were first stained with Ponceau to visualize the protein loading.
To determine tissue-specific AMPK levels, tissue samples were homogenized in radio-immunoprecipitation assay buffer (Pierce RIPA Buffer; Thermo Scientific, Rockford, IL) containing protease inhibitors (Complete Mini; Roche Diagnostics, Indianapolis, IN) and phosphatase inhibitors (PhosSTOP; Roche Diagnostics) as described previously (14). Briefly, tissue homogenates were centrifuged at 10,000 g for 15 minutes at 4°C, and the supernatant containing whole-tissue protein extract was collected. Protein concentrations were determined using the Biorad DCA kit as per manufacturer’s recommendations. Equal amounts of protein (∼40 µg) were resolved on sodium dodecyl sulfate polyacrylamide gel electrophoresis and transferred onto a nitrocellulose membrane.
For determining plasma adiponectin and tissue AMPK levels, nitrocellulose membranes with transferred protein were incubated with primary antibody (Table 1) overnight at 4°C, washed, and probed with horseradish peroxidase–tagged secondary antibody raised against the species in which primary antibody was generated. Proteins were detected by electrochemiluminescent reaction using either Kodak X-OMAT film (Fisher Scientific) or the ProteinSimple FluorChem E system (San Jose, CA). The levels of each protein, as well as the corresponding loading control (glyceraldehyde 3-phosphate dehydrogenase), were determined in the same membrane after stripping and reblotting. Band densities were determined using ImageJ software.
Table 1.
Antibodies Used
| Peptide/Protein Target | Antigen Sequence (if Known) | Name of Antibody | Manufacturer, Catalog Number, and/or Name of Individual Providing the Antibody | Species Raised in; Monoclonal or Polyclonal | Dilution Used | RRID |
|---|---|---|---|---|---|---|
| Bovine Adiponectin | Bovine antiadiponectin | Dr. Helga Sauerwein (University of Bonn, Germany) | Rabbit; polyclonal | WB 1:1K | AB_2650604 | |
| p-AMPK | Phospho-AMPKα (Thr172) (D79.5E) | Cell Signaling, 4182 | Rabbit; monoclonal | WB 1:1K | AB_2169396 | |
| AMPK | AMPKα (D63G4) | Cell Signaling, 5832 | Rabbit; monoclonal | WB 1:1K | AB_10624867 | |
| GAPDH | GAPDH (14C10) | Cell Signaling, 3683 | Rabbit; monoclonal | WB 1:1K | AB_1642205 |
Abbreviations: GAPDH, glyceraldehyde 3-phosphate dehydrogenase; RRID, research resource identifier; WB, Western blot.
Oxidative stress measures
As markers of oxidative stress, levels of protein-bound oxidized tyrosine moieties [3-nitrotyrosine (NY); o, o'-dityrosine (DY); and 3-chlorotyrosine (ClY)] were quantified by isotope dilution liquid chromatography electrospray ionization tandem mass spectrometry as described previously (41) in plasma and in tissue extracts from VAT, SAT, muscle, and liver. Briefly, the plasma and tissue proteins were precipitated with ice-cold trichloroacetic acid (10% vol/vol) and then delipidated with the mixture containing water, methanol, and water-washed diethyl ether (1:3:7; vol/vol/vol). Tissues were homogenized before precipitation of proteins and delipidation. Known amounts of isotopically labeled internal standards 13C6-Y 13C6-NY, 13C6-ClY, and 13C12-o, o'-DY were added, and precipitated proteins were hydrolyzed at 110°C for 24 hours in 4 M methanesulfonic acid solution saturated with 1% benzoic acid. Samples were then subjected to solid-phase extraction, and the amount of oxidized amino acids was determined by isotope dilution liquid chromatography electrospray ionization tandem mass spectrometry. Multiple reactions were monitored by integrating peak areas of the labeled standards and the analytes. The levels of the oxidized amino acids in each sample were then normalized to the amino acid tyrosine content in the respective samples and expressed as the ratio of the oxidized product over the total tyrosine. Intra-assay coefficients of variation for NY, DY, and ClY were 8.47%, 8.16%, and 12.98%, respectively.
Assessment of ectopic lipid accumulation
Lipid accumulation in liver and muscle were assessed by Oil Red O staining of tissue cryosections as well as hematoxylin and eosin (H&E) staining of paraffin-embedded tissue sections. In addition, tissue triglyceride content in both liver and muscle was measured using a commercially available assay kit. For Oil Red O staining, frozen sections mounted in optimum cutting temperature medium were sectioned at 5 μm on a Leica CM3050S cryostat (Leica Microsystems, Germany), and the cryosections were fixed in neutral buffered formalin (20 minutes) and washed twice with tap water (5 minutes) and 60% isopropanol (5 minutes) prior to staining with Oil Red O (Sigma-Aldrich) for 15 minutes. Slides were washed in 60% isopropanol (5 minutes), counterstained with Mayer’s hematoxylin, and cover slipped with an aqueous mounting medium (Fisher Scientific). For H&E staining, paraffin-embedded tissue sections were stained following a standard protocol using Gill’s hematoxylin (42). For both Oil Red O and H&E staining, three slides containing sections chosen 50 μm apart were used. Five regions corresponding to the four corners and center of each section were imaged for determining the Oil Red O–positive area. The ratio of Oil Red O–positive stain area to the total area of the imaged section was calculated using the Image Pro-Plus 3.0.1 system (Media Cybernetics, Rockville, MD) using a well-validated densitometrical method (43) as described previously (44). The distribution of lipid deposits did not allow quantitative estimation to be performed on the muscle sections.
To assess the tissue triglyceride content, 100 mg of the tissue was homogenized in 1 mL of phosphate-buffered saline, and tissue lipids were extracted using the Bligh and Dyer method (45) with slight modifications. Briefly, the tissue homogenate was placed into a borosilicate glass tube containing 3.75 ml of 1:2 (v/v) chloroform/methanol, 1.25 mL chloroform, and 1.25 mL distilled water, vortexed, and centrifuged for 5 minutes at room temperature. The bottom phase was carefully recovered, air dried overnight, and reconstituted in 200 µL isopropyl alcohol for assessment of triglyceride content using the Wako L-Type TG M kit (Wako Diagnostics, Mountain View, CA) as per the manufacturer’s recommendations. Each sample was assayed in duplicate, and the intra- and interassay coefficients of variance were 3.32 ± 0.57% and 5.2 ± 0.73%, respectively. Plasma triglyceride content was assessed using a colorimetric assay kit (Cayman Chemicals, Ann Arbor, MI) as per the manufacturer’s recommendation. The intra- and interassay coefficients of variance were 2.14% and 6.71%, respectively.
Statistical analysis
Heterogeneity of variance was tested with Bartlett χ2 test, and when required data were log-transformed. Changes in gene expression, markers of oxidative stress, and triglyceride content were analyzed using one-way analysis of variance (ANOVA) followed by Tukey post hoc test using Prism 6 software (GraphPad, La Jolla, CA), and the threshold for significance was set as P ≤ 0.05. The prenatal and postnatal treatment effects were analyzed separately. Cohen effect size analysis (35, 46, 47) was also used to determine the magnitude of differences between the control and prenatal T–treated and the intervention groups vs the prenatal T–treated group. A computed Cohen d value of ≥0.5 indicates medium large effect size differences, and a value of ≥0.8 and above indicates large effect size differences (46, 47).
Results
Effect of prenatal interventions
Adiponectin
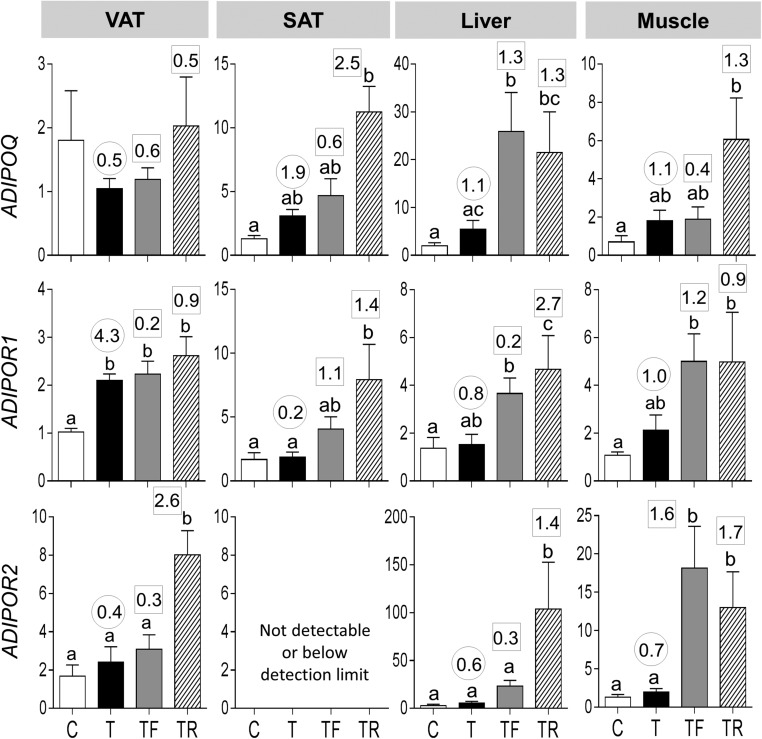
Effect size analysis found medium-sized effects of prenatal T treatment in decreasing mRNA expression of ADIPOQ in VAT and large-sized effects in increasing expression in SAT, liver, and muscle (Fig. 2). Prenatal T treatment increased mRNA expression of ADIPOR1 in VAT. Effect size analysis also revealed large effects in increasing the ADIPOR1 mRNA expression in VAT as well as muscle and a medium-sized effect in ADIPOR2 expression in liver and muscle. Prenatal intervention with androgen antagonist or insulin sensitizer did not alter prenatal T treatment–induced changes.
Figure 2.
mRNA expression of ADIPOQ (top panels), ADIPOR1 (middle panels), and ADIPOR2 (bottom panels) in the VAT, SAT, liver, and muscle tissues of C, T, TF, and TR groups. Data are presented as the mean ± standard error of the mean of the fold change in mRNA levels. Differing letters above the histogram indicate significant changes by ANOVA. Numerical superscripts are Cohen d values comparing (1) C vs T (within the circle) and (2) TF and TR vs T (within the square box).
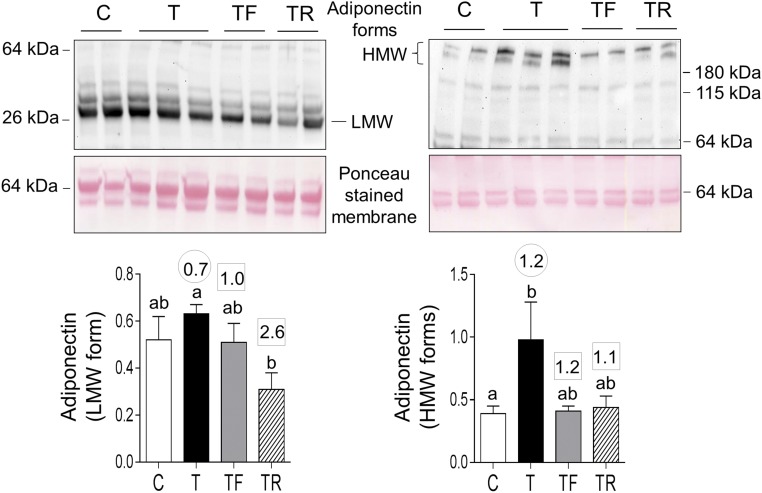
Prenatal T treatment increased HMW forms of ADIPOQ in the plasma. Effect size analysis, in addition to revealing large effects of prenatal T treatment in increasing HMW forms, revealed a medium-sized effect in increasing LMW forms. Effect size analysis showed large effects of insulin sensitizer in preventing prenatal T–induced increase in both LMW and HMW forms and androgen antagonist in preventing the increase in HMW forms (Fig. 3).
Figure 3.
Plasma levels of LMW and HMW forms of adiponectin in C, T, TF, and TR groups. Top panels show representative blots under reducing conditions (left, LMW) and nonreducing conditions (right, HMW forms) along with Ponceau staining for protein loading. Bottom panels show mean ± standard error of the mean of density ratios between LMW (bottom left) and HMW (bottom right) forms of adiponectin with the 64-kDa protein from the Ponceau-stained membrane. Differing letters above the histogram indicate significant changes by ANOVA. Numerical superscripts are Cohen d values comparing (1) C vs T (within the circle) and (2) TF and TR vs T (within the square box).
At the tissue level, prenatal T excess increased phosphorylation of AMPK, a molecule activated by adiponectin (48) in the liver (Supplemental Fig. 1 (1.1MB, TIF) ). In addition, effect size analysis showed large effects in prenatal T treatment–induced increases in AMPK phosphorylation not only in the liver but also in the muscle and showed a decrease in pAMPK in VAT. Both prenatal interventions prevented the effects of prenatal T excess in liver but not in muscle and VAT (Supplemental Fig. 1 (1.1MB, TIF) ).
Proinflammatory cytokines
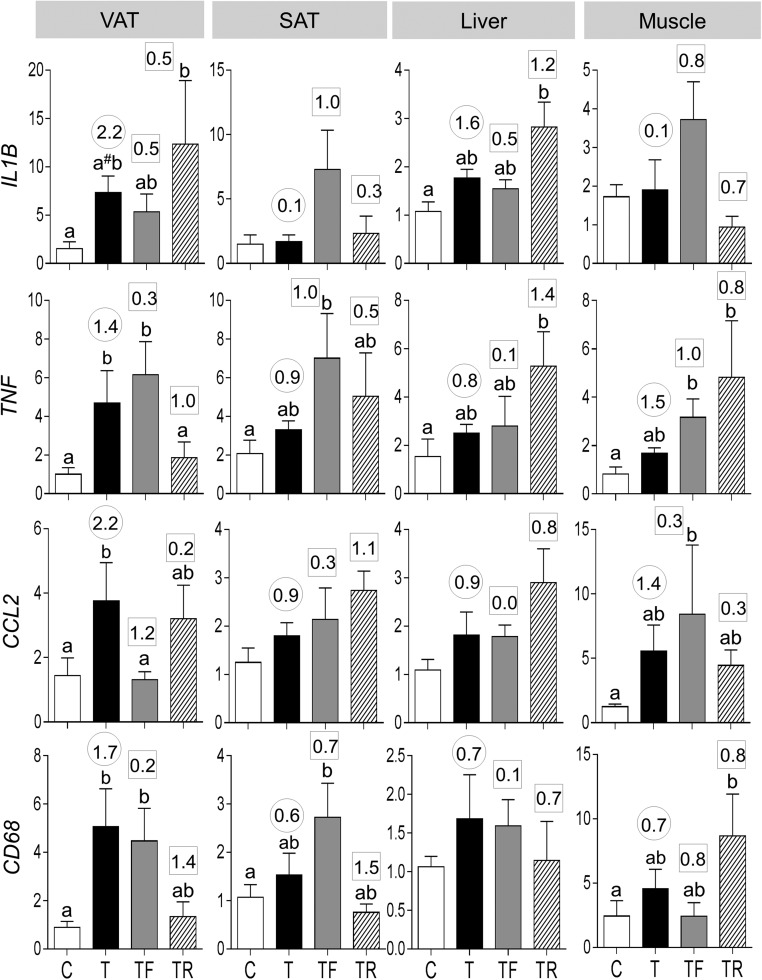
Prenatal T treatment increased mRNA expression of cytokines, tumor necrosis factor alpha (TNF), and chemokine (C-C) ligand 2 (CCL2) and trended (P = 0.06) to increase interleukin 1 beta (IL1B) in VAT (Fig. 4). Effect size analysis also revealed large effects of prenatal T treatment in inducing increases in all cytokines not only in VAT but also in liver and TNF and CCL2 only in SAT and muscle. Prenatal T treatment also increased the expression of macrophage marker CD68 in VAT, in addition to having a medium-sized effect in increasing CD68 in SAT, liver, and muscle.
Figure 4.
Proinflammatory cytokines (mRNA expression of IL1B, TNF, and CCL2) and macrophage marker (CD68) expression in C, T, TF, and TR groups (mean ± standard error of the mean). Differing letters above the histogram indicate significant changes by ANOVA. Numerical superscripts are Cohen d values comparing (1) C vs T (within the circle) and (2) TF and TR vs T (within the square box). #Indicates a significant difference between C and T groups as determined by Student t test.
Prenatal intervention with an androgen antagonist did not prevent the prenatal T–induced increase in IL1B, TNF, and CD68 but blocked the increase in CCL2 expression in VAT. In contrast, prenatal intervention with insulin sensitizer blocked the prenatal T–induced increase in TNF and partially prevented the increase in CD68 expression in the VAT. Neither intervention prevented the impact of prenatal T on any proinflammatory cytokines evident through effect size analyses in SAT, liver, and muscle. However, flutamide intervention partially prevented the effects of prenatal T treatment on CD68 in muscle, whereas rosiglitazone intervention fully prevented its effects on CD68 in SAT.
Oxidative stress markers
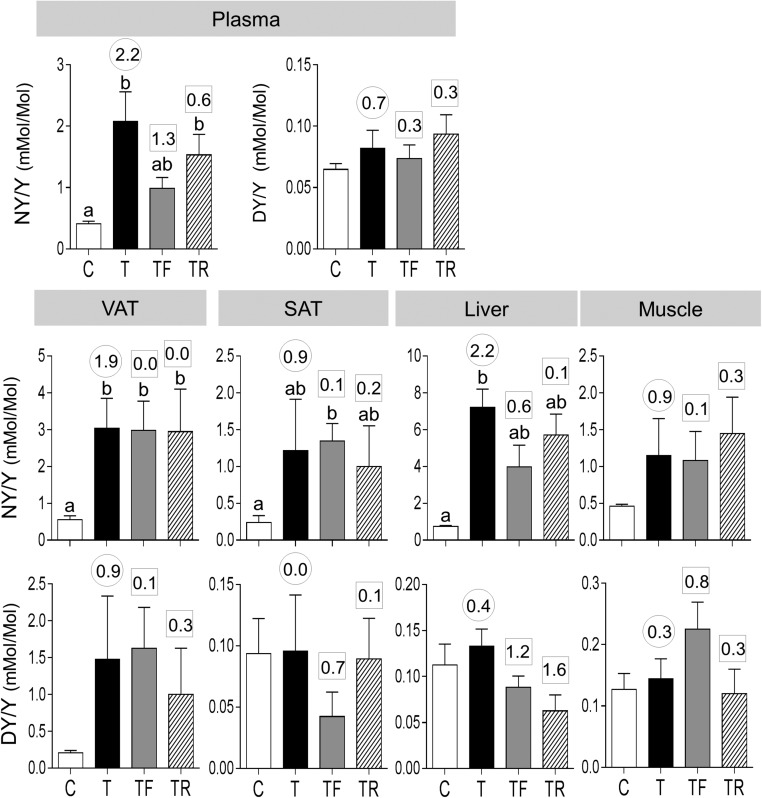
Exposure to gestational T excess increased plasma concentrations of NY but not DY (Fig. 5). Effect size analyses also found a large-magnitude difference between control and prenatal T–treated female sheep in plasma NY levels (d = 2.2) and only a marginal difference in plasma DY levels (d = 0.7). Androgen antagonist intervention but not insulin sensitizer treatment partially prevented the increase in plasma NY (TF not different from C or T; effect size Cohen d = 1.3 T vs TF).
Figure 5.
Plasma and tissue oxidized tyrosine concentrations in C, T, TF, and TR groups (mean ± standard error of the mean). The concentrations of NY and DY are expressed as the ratio of oxidized tyrosine to total tyrosine in plasma (top panels) and NY (middle panel) and DY (bottom panel) in the VAT, SAT, liver, and muscle. Differing letters above the histogram indicate significant changes by ANOVA. Numerical superscripts are Cohen d values comparing (1) C vs T (within the circle) and (2) TF and TR vs T (within the square box).
Concentrations of NY were also significantly increased in VAT and liver. Effect size analyses found large size differences in prenatal T–induced increases in NY in VAT and liver as well as in SAT and muscle. Effect size analyses also found large size increases in DY concentrations in VAT of prenatal T–treated animals. In both SAT and muscle, effect size analysis also showed marginal increases in NY and not DY content. ClY was below detection limit in the plasma and in all tissues examined. Both interventions failed to prevent prenatal T–induced increases in NY level in all tissues.
Antioxidant gene expression
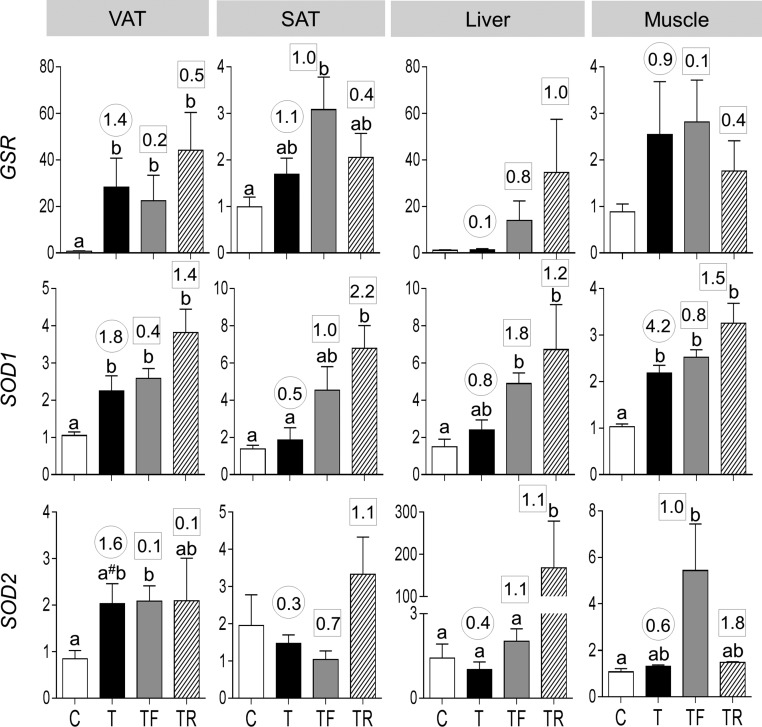
Prenatal T treatment increased mRNA expression of GSR and SOD1 and tended to increase (P = 0.06) SOD2 in VAT (Fig. 6). Prenatal T treatment also increased SOD1 in muscle. Effect size analysis also found large-magnitude differences between control and prenatal T–treated female sheep in all three antioxidants in VAT and SOD1 in muscle. In addition, effect size analyses found large-magnitude increases in GSR and SOD1 in muscle, GSR in SAT, and SOD1 in liver. Neither intervention prevented prenatal T–induced increases in GSR, SOD1, and SOD2 in any of the tissues studied. The interventions magnified the amplitude of differences with levels being higher in the intervention groups compared with prenatal T–treated groups.
Figure 6.
Antioxidant [GSR (top panels), SOD1 (middle panels), and SOD2 (bottom panels)] expression in the VAT, SAT, liver, and muscle tissues of C, T, TF, and TR groups (mean ± standard error of the mean). Differing letters above the histogram indicate significant changes by ANOVA. Numerical superscripts are Cohen d values comparing (1) C vs T (within the circle) and (2) TF and TR vs T (within the square box). #Indicates significant difference between C and T groups as determined by Student t test.
Plasma triglycerides
Plasma triglyceride content was significantly elevated by prenatal T treatment, with neither intervention preventing this increase (Supplemental Fig. 3 (559.7KB, TIF) ).
Ectopic lipid accumulation
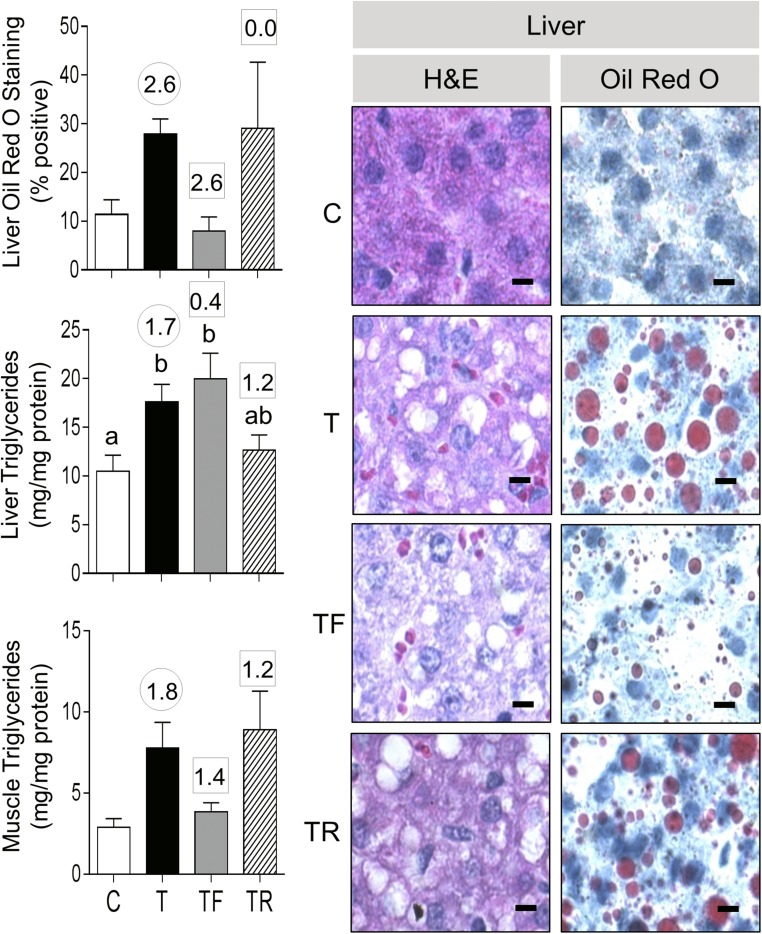
Prenatal T treatment significantly increased the liver triglyceride content, and effect size analysis also showed large effects of prenatal T treatment in increasing liver lipid content, as evident from Oil Red O staining and a clear area in H&E-stained sections (Fig. 7). Although effect size analysis also revealed large effects of prenatal T treatment in increasing muscle triglyceride content, the lipid content in muscle after Oil Red O staining while appearing to be increased was not quantifiable (Supplemental Fig. 4 (24.5KB, doc) ). Neither intervention affected the liver triglyceride content. However, effect size analysis found that androgen antagonist prevented the large effects of prenatal T treatment in liver lipid content (Oil Red O staining). Effect size analyses also found that androgen antagonist treatment prevented the increase in muscle triglyceride content.
Figure 7.
Ectopic lipid accumulation in liver from C, T, TF, and TR groups. Photomicrographs of histochemical analysis by H&E staining of paraffin-embedded and Oil Red O staining in cryosections from liver is shown in the right panels (bar = 25 μm). On the left are shown mean ± standard error of the mean of the percent staining of Oil Red O in liver (top left) and triglyceride content in liver (left middle) and muscle (left bottom). Differing letters above the histogram indicate significant changes by ANOVA. Numerical superscripts are Cohen d values comparing (1) C vs T (within the circle) and (2) TF and TR vs T (within the square box).
Effect of postnatal treatments
Assessment of the effect of postnatal intervention with androgen receptor antagonist or insulin sensitizer was restricted to variables affected by prenatal T treatment. These included adiponectin, NY and triglyceride content in plasma, ADIPOR1, proinflammatory cytokines, NY content and antioxidants in the VAT, pAMPK, NY and lipid content in liver, and pAMPK and lipid content in muscle.
Adiponectin
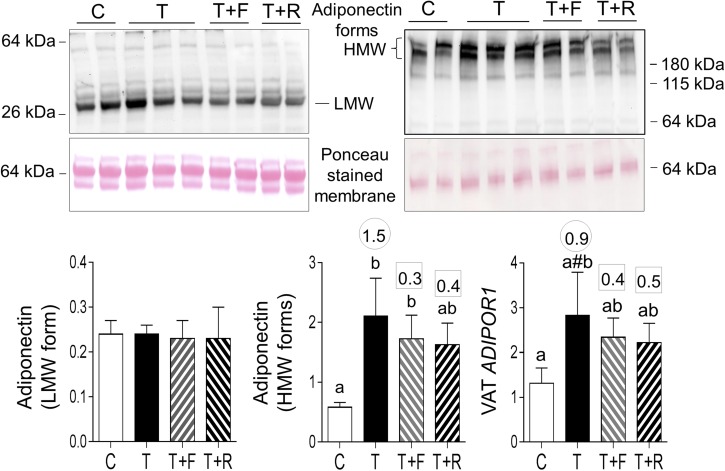
Neither postnatal intervention had an effect in reversing the prenatal T treatment–induced increase in HMW adiponectin forms or ADIPOR1 in VAT or pAMPK in the liver (Fig. 8; Supplemental Fig. 2 (991.2KB, TIF) ).
Figure 8.
Plasma levels of LMW and HMW forms of adiponectin and mRNA expression of ADIPOR1 in VAT in C, T, T+F, and T+R groups. Top panels show representative blots under reducing conditions (left: LMW) and nonreducing conditions (right: HMW forms) along with Ponceau staining to depict protein loading. Bottom panels show mean ± standard error of the mean of density ratios between LMW (bottom left) and HMW (bottom middle) of adiponectin with the 64-kDa protein from the Ponceau-stained membrane. Bottom right shows mRNA expression levels of ADIPOR1. Differing letters above the histogram indicate significant changes by ANOVA. Numerical superscripts are Cohen d values comparing (1) C vs T (within the circle) and (2) T+F and T+R vs T (within the square box). #Indicates significant difference between C and T groups as determined by Student t test.
Proinflammatory cytokines
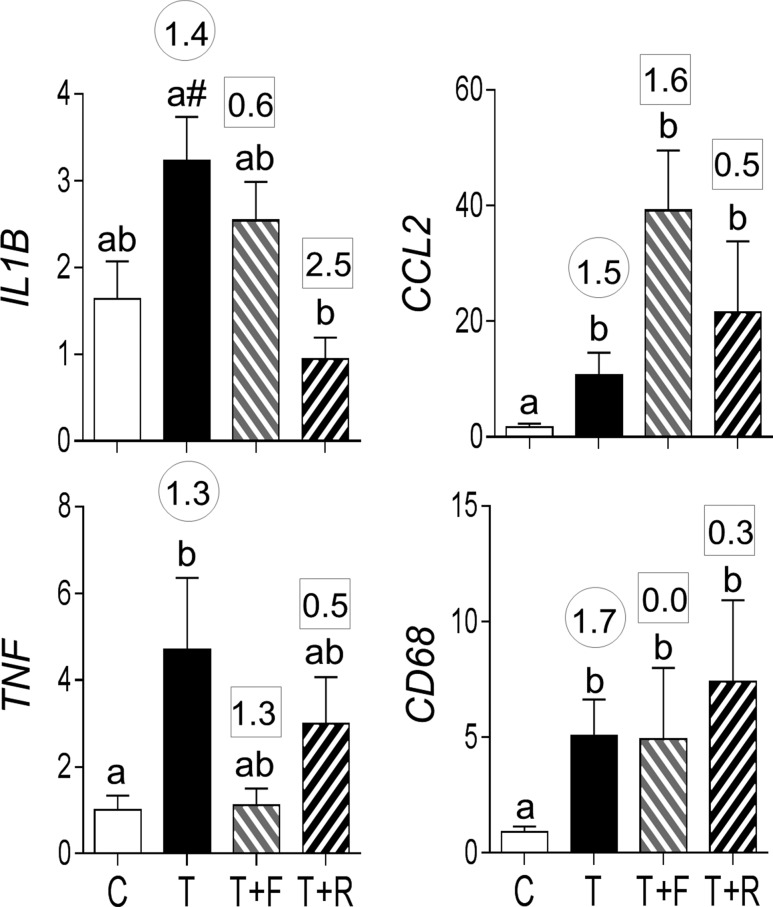
Postnatal insulin sensitizer but not antiandrogen treatment reversed the trend in increased expression of IL1B induced by prenatal T treatment (Fig. 9). Effect size analysis revealed that antiandrogen and insulin sensitizer treatment also had large- and medium-sized effects, respectively, in reversing the prenatal T–induced increase in TNF. Prenatal T treatment induced increases in CCL2 and CD68 expression in the VAT were not reversed by either treatment.
Figure 9.
Proinflammatory cytokines (mRNA expression of IL1B, TNF, and CCL2) and macrophage marker (CD68) expression in C, T, T+F, and T+R groups (mean ± standard error of the mean). Differing letters above the histogram indicate significant changes by ANOVA. Numerical superscripts are Cohen d values comparing (1) C vs T (within the circle) and (2) T+F and T+R vs T (within the square box). #Indicates significant difference between C and T groups as determined by Student t test.
Oxidative stress measures
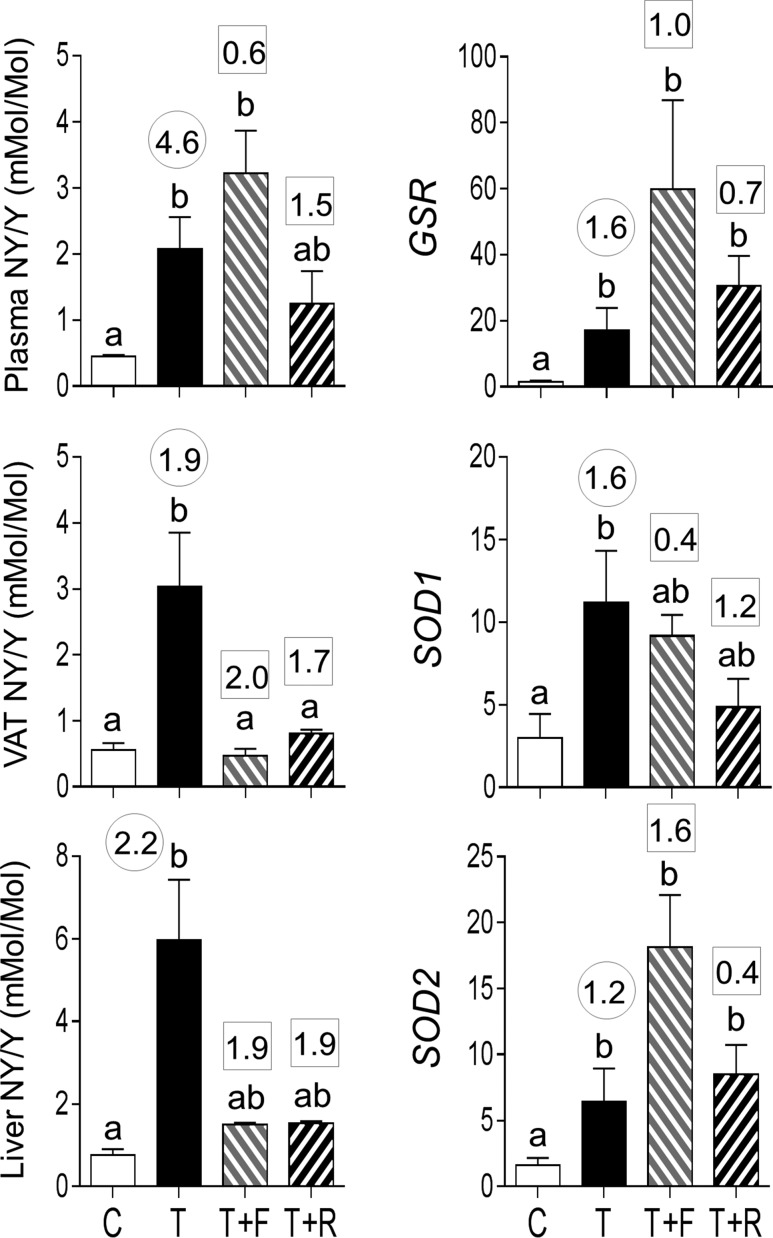
Both postnatal interventions completely reversed the NY increase in VAT but had a partial effect in the liver (Fig. 10, left panels). Whereas antiandrogen treatment had no effect on plasma NY levels, insulin sensitizer treatment partially reversed the effect of prenatal T treatment.
Figure 10.
Plasma and tissue oxidized tyrosine concentrations and mRNA expression of antioxidants (GSR, SOD1, and SOD2) in C, T, T+F, and T+R groups (mean ± standard error of the mean). The concentrations of NY are expressed as ratio of oxidized tyrosine to total tyrosine in plasma (top left), VAT (middle left), and liver (bottom left). Differing letters above the histogram indicate significant changes by ANOVA. Numerical superscripts are Cohen d values comparing (1) C vs T (within the circle) and (2) T+F and T+R vs T (within the square box).
Antioxidant gene expression
Neither treatment reversed the increase in antioxidants GSR and SOD2 induced by prenatal T excess in the VAT (Fig. 10, right panels). Effect size analysis revealed reversal of SOD1 with insulin sensitizer but not antiandrogen intervention. Effect size analysis revealed large-magnitude differences with antiandrogen intervention for GSR and SOD2, evidenced as further amplification rather than amelioration of prenatal T treatment effect.
Plasma triglycerides
Effect size analysis showed large effects of antiandrogen intervention in partially reversing the prenatal T treatment–induced increase in plasma triglyceride content (Supplemental Fig. 3 (559.7KB, TIF) ).
Ectopic lipid accumulation
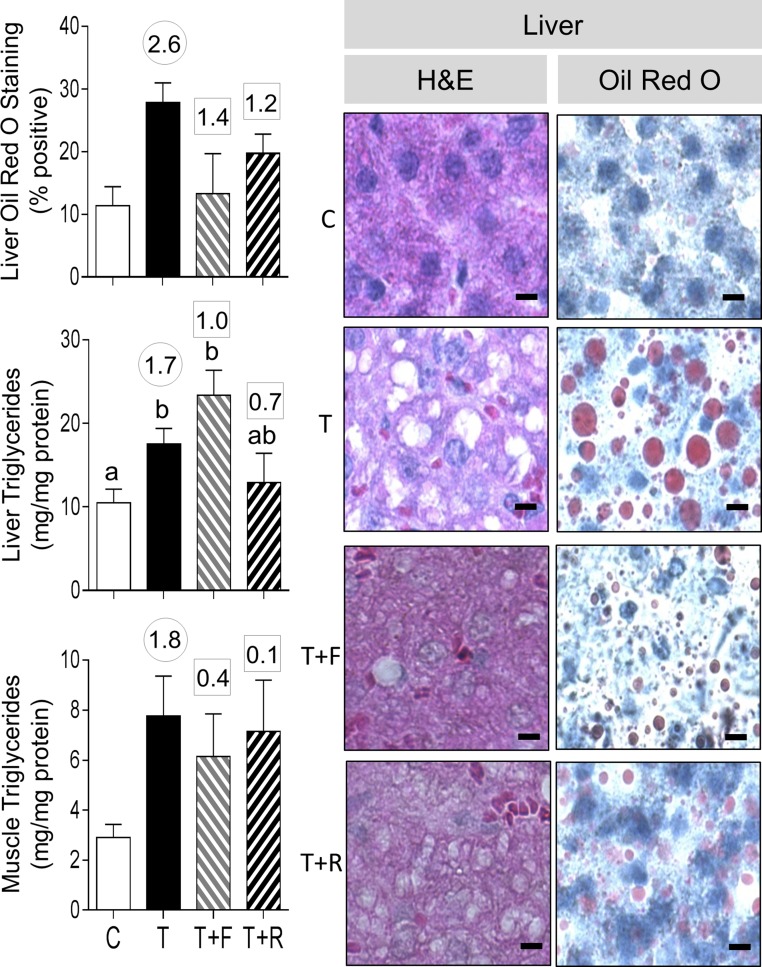
Effect size analysis revealed large effects of antiandrogen as well as insulin sensitizer in reversing the effects of prenatal T treatment in increasing liver Oil Red O staining (Fig. 11). Insulin sensitizer intervention had a medium-sized effect in partially reversing the liver triglyceride content (T+R group not different from control or T). Neither treatment reversed the effects of a prenatal T treatment–induced increase in muscle triglyceride content.
Figure 11.
Ectopic lipid accumulation in liver from C, T, T+F, and T+R groups. Photomicrographs of histochemical analysis by both H&E staining of paraffin-embedded and Oil Red O staining in cryosections from liver are shown in the right panels (bar = 25 μm). On the left are shown mean ± standard error of the mean of the percent staining of Oil Red O in liver (top left) and triglyceride content in liver (left middle) and muscle (left bottom). Differing letters above the histogram indicate significant changes by ANOVA. Numerical superscripts are Cohen d values comparing (1) C vs T (within the circle) and (2) T+F and T+R vs T (within the square box).
Discussion
The findings from this study indicate that an increase in lipotoxicity underlies programming of compromised insulin sensitivity in the liver and muscle of prenatal T–treated sheep, with an increase in antioxidants offsetting the increase in oxidative stress and proinflammatory cytokines in the VAT, thus preserving its insulin sensitivity. The significance of these findings and the involvement of androgenic and metabolic pathways in programming these defects (organizational effects) and the postnatal contribution of these pathways (activational effects) in their manifestation are discussed below.
Effects of prenatal T treatment on modulators of insulin sensitivity
Mediators of peripheral insulin sensitivity
The dyslipidemic state of prenatal T–treated sheep manifested as increased triglyceride content is consistent with the reduced adipocyte size reported in the same cohort of animals (11) and is suggestive of reduced lipid storage capacity (49). Similarly, the elevated NY level in prenatal T–treated sheep, which is indicative of oxidative stress, is in agreement with the premise that an increase in plasma lipids contributes to the development of oxidative stress (20). Considering that oxidative stress (50) and dyslipidemia (51) can negatively affect insulin signaling, the increased NY and triglyceride content of the prenatal T–treated animals are likely contributors to their insulin resistant state (10, 12, 52).
In contrast, the increased plasma levels of HMW adiponectin, a biological active form that sensitizes tissues to insulin action (30), is inconsistent with the insulin-resistant state of the prenatal T–treated animals, considering that hypoadiponectinemia is a feature of various animal models and patients with IR (30) and women with PCOS (53). The reasons for the increased expression of HMW adiponectin is not clear and may reflect a compensatory response to overcome the hyperlipidemic and oxidative stress status of these animals.
Mediators of adipose tissue insulin sensitivity
The increased proinflammatory cytokines and CD68 expression and NY content in VAT from prenatal T–treated sheep support manifestation of inflammatory and oxidative stress state associated with infiltration of macrophages in the VAT. This observation is consistent with earlier reports that small adipocytes are associated with increased inflammatory cytokine expression (54, 55). However, these findings are inconsistent with the insulin-sensitive status of VAT reported in this cohort of animals (14) and the view that chronic inflammation characterized by infiltration of immune cells and elevated oxidative stress in the adipose tissues underlies the pathogenesis of IR (17, 18, 50). Preservation of insulin sensitivity in the VAT in this scenario may be due to the increased expression of antioxidant enzymes (GSR, SOD1, and SOD2) that counter the oxidative stress response. This premise is supported by observations that antioxidant administration alleviates IR in various animal models and clinical trials (56, 57).
In contrast to VAT, SAT manifested marginal increases of proinflammatory cytokines (TNF and CCL2) and NY. An inflammatory state was expected in this depot (55) due to the small adipocyte size (11). Differences in inflammatory and oxidative stress markers between VAT and SAT emphasize depot-specific regulation of adipocyte function (58, 59) and are consistent with the observation that VAT depots in mice manifest increased expression of proinflammatory cytokines than SAT (60).
Mediators of liver and muscle insulin sensitivity
Because prenatal T treatment resulted in insulin resistance in the liver and muscle (14), we expected to see an elevation in negative (inflammatory markers, oxidative stress, and lipotoxicity) and/or a decrease in positive (adiponectin) mediators of insulin sensitivity in these tissues. Contrary to our expectations, only marginal, if any, changes in inflammatory (CCL2) or oxidative stress (NY) markers, the negative regulators of insulin sensitivity, were evidenced in the muscle of prenatal T–treated animals. In contrast, prenatal T treatment induced a substantial increase in oxidative stress (evidenced by an increase in NY content) in the liver, with marginal changes in all inflammatory marker studied (assessed by effect size analysis). However, both these insulin target tissues manifested ectopic lipid accumulation, consistent with the idea that hyperlipidemia predisposes ectopic lipid accumulation and hepatic steatosis (61).
Paradoxically, but consistent with the elevated plasma HMW adiponectin, increased activation of AMPK that promotes insulin sensitizing effects by reducing inflammation and oxidative stress and increasing glucose transport and fatty acid oxidation (62) was a common feature of both the liver and muscle. Taking the changes in negative and positive regulators on insulin sensitivity into account, lipotoxicity induced by accumulation of lipids, which can negatively affect insulin signaling (23), may have overridden the insulin-sensitizing effects of adiponectin/AMPK, thus shifting the balance toward manifestation of the insulin-resistant state in both liver and muscle. Ectopic lipid accumulation was also a feature of T-treated female sheep at fetal days 62 to 102 (63), suggesting the programming window for inducing lipotoxicity resides between days 62 and 90 of gestation. Our findings and the findings of others (63) in prenatal T–treated sheep, where hepatic steatosis is evident in the face of their lean body composition (11), suggest that prenatal T excess predisposes development of ectopic lipid accumulation or hepatic steatosis. In women with PCOS, the characteristics of which the prenatal T–treated sheep mimic, the steatosis appear to occur both associated with (64) or independent of obesity (65).
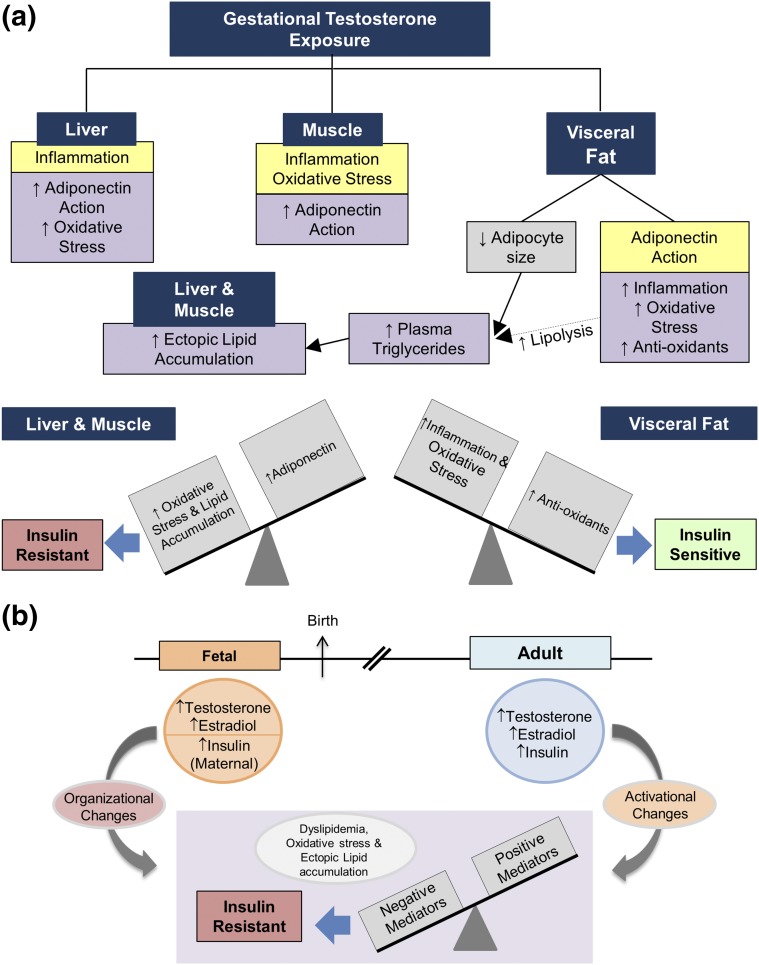
Taking all the above findings into consideration, the IR in prenatal T–treated sheep may result from a defect at the level of adipose tissue with decreased adipocyte size, leading to reduced lipid storage capability and consequent dyslipidemia [Fig. 12(a)]. In addition, infiltration of immune cells, as evident from the increase in macrophage markers, can promote lipolysis, causing dyslipidemia (18). The dyslipidemia in turn may contribute to the development of IR by interfering with insulin action in other organs (21–23), thereby also contributing to the peripheral IR in the prenatal T–treated sheep. The circulating lipids are also ectopically deposited in the liver and muscle, where they overcome the insulin-sensitizing effects of adiponectin/AMPK to promote IR in these tissues. In contrast, preservation of insulin sensitivity in adipose tissue is potentially maintained through elevated expression of antioxidants, which overcomes the detrimental effects of inflammation and oxidative stress [Fig. 12(a)].
Figure 12.
Model integrating the changes in the mediators of insulin sensitivity induced by prenatal T excess in the metabolic tissues as it relates to target site–specific insulin sensitivity along with the intermediaries that participate in their regulation. (a) Observed changes in the mediators of insulin sensitivity in liver, muscle, and visceral fat. How the changes in mediators of insulin sensitivity might integrate in the development of the insulin resistant state in liver and muscle and the insulin-sensitive state of visceral fat are shown. (b) Steroidal and metabolic components involved in organizing and maintaining (through activational effects) the positive and negative mediators of insulin sensitivity.
Steroidal or metabolic programming of mediators of insulin sensitivity
Mediators of peripheral insulin sensitivity
The finding that plasma concentrations of triglycerides and oxidative stress are not prevented by cotreatment with androgen antagonist or insulin sensitizer is consistent with our earlier observations that neither intervention is able to overcome the prenatal T treatment–induced reduction in adipocyte size (11). Because prenatal T treatment also elevates fetal estradiol levels (33), these disruptions may be mediated via estrogenic programming. Several studies support a role for estradiol in adipocyte differentiation (66, 67). In contrast, the prevention of an increase in HMW adiponectin by flutamide and rosiglitazone cotreatments suggests that both androgenic and metabolic pathways are involved in programming the post-translational modification of adiponectin.
Mediators of adipose tissue insulin sensitivity
The finding that neither prenatal intervention prevented the prenatal T treatment–induced increase in oxidative stress or antioxidant gene expression suggests that these changes are not programmed by androgenic or metabolic pathways and may involve estrogenic pathways. In contrast, prevention of the increase in CCL2 by antiandrogen and TNF by insulin sensitizer suggests that androgenic and metabolic pathways synergize in regulating the inflammatory process. Studies involving cotreatment with estrogen antagonists are required to assess the extent to which estrogenic pathways are also involved.
Mediators of liver and muscle insulin sensitivity
Partial prevention of increase in triglyceride content but not total neutral lipids (assessed by Oil Red O) in liver by insulin sensitizer cotreatment may be a function of the lipid types measured by the two approaches. Oil Red O stains most hydrophobic and neutral lipids, such as diacylglycerols and cholesterol esters along with triglycerides (68). Prevention of the prenatal T–induced increase in liver total neutral lipids and muscle triglyceride by antiandrogen cotreatment is indicative of fine tuning of this tissue-specific regulation. The observation of reduced hepatic steatosis in the dihydrotestosterone-treated androgen receptor knockout mouse supports a role for androgens in inducing this defect, although this study does not help distinguish whether it is a prenatal effect or the result of continuous absence of androgen action (69). The differential effects of rosiglitazone on liver and muscle triglyceride content are also supportive of tissue-specific effects (70). Functionally, reduced liver triglyceride content may underlie the improvement in peripheral insulin sensitivity observed in the prenatal T–treated female sheep cotreated with rosiglitazone (11). The premise that insulin sensitizer intervention can overcome programmed alteration by prenatal exposures is supported by the observation that rosiglitazone coadministration overcame epigenetic alterations induced by in utero exposure to nicotine in the rat (71).
Impact of postnatal antiandrogen and insulin sensitizer treatment on mediators of insulin sensitivity
As opposed to involvement of steroidal and metabolic pathways in prenatal T programming of regulators of insulin resistance, postnatal steroidal and metabolic milieu appear to also play a role in the maintenance of the insulin-resistant status of prenatal T–treated female sheep. Evidence indicates that the postnatal milieu plays an activational role in unmasking or amplifying the changes programmed by prenatal insults (72, 73). This concept is supported by the observation that postnatal overfeeding amplifies the reproductive and metabolic defects in prenatal T–treated sheep (52, 74).
Mediators of peripheral insulin sensitivity
A lack of reversal of plasma HMW adiponectin with either postnatal intervention and a partial reversal of the increase in plasma NY by rosiglitzone are consistent with the reports that rosiglitzone treatment increases HMW adiponectin (75) and that thiazolidinedione treatment improves insulin sensitivity by reducing inflammation (76) and consequently reducing the oxidative stress state (77). The improvement in the oxidative stress state of rosiglitazone-treated animals may underlie the improvement in insulin sensitivity that follows postpubertal rosiglitazone treatment (37). The reduction in plasma triglyceride by antiandrogen treatment is also consistent with the similar reduction with flutamide treatment in women with PCOS (78). This reduction in plasma triglyceride may contribute to the reduced plasma NY observed in the prenatal T–treated animals.
Mediators of tissue-specific insulin sensitivity
That metabolic and androgenic pathways synergize in controlling the different components of the inflammatory and oxidative stress process in the VAT is evident from 1) the reversal of IL1B increase by insulin sensitizer intervention, 2) the partial reversal of TNF increase by antiandrogen treatment, and 3) the reversal of the increase in NY content by both treatments. The ability of rosiglitazone in reversing inflammation, and therefore oxidative stress (77) in VAT, aligns with previous reports (76). Similarly, the finding that treatment with both an androgen antagonist and an insulin sensitizer reverses total lipids and NY content in liver suggests involvement of a common mediator. The improvement in peripheral insulin sensitivity of prenatal T–treated animals achieved with rosiglitazone treatment (37) may relate to the reduced hepatic lipid content and oxidative stress, a premise that is consistent with the effects of rosiglitazone in subjects with type 2 diabetes (79). The lack of an effect of either treatment on muscle triglyceride content suggests the potential involvement of the estrogenic pathway.
Taking the impacts of prenatal and postnatal interventions into consideration, it appears that the gestational T excess–induced changes in adiponectin, proinflammatory cytokines, oxidative stress, and lipotoxicity—the mediators of insulin sensitivity—are developmentally programmed by androgenic, metabolic, and potentially estrogenic pathways working in concert [Fig. 12(b)]. Furthermore, the findings from postnatal interventions indicate that androgenic, metabolic, and potentially estrogenic pathways are involved in the phenotypic expression of these tissue-specific and peripheral effects on mediators of IR through activational effects [Fig. 12(b)].
Translational relevance and conclusions
The findings from this study may be of translational significance because prenatal T–treated sheep manifest reproductive and metabolic defects that are similar to those observed in women with PCOS (80). The elevated circulating triglycerides and oxidative stress markers found in prenatal T–treated sheep is also a feature of lean and obese women with PCOS (81). The increase in oxidative stress markers evidenced in VAT of prenatal T–treated sheep is also seen in obese women with PCOS (82), raising the possibility that the increased oxidative stress in PCOS may be independent of obesity. Whereas an increase in SOD mRNA expression is seen in VAT of prenatal T–treated sheep, a reduction in SOD activity characterized the omental fat from women with PCOS (83). Whether a similar increase in SOD activity occurs in prenatal T–treated sheep and whether the increase in SOD mRNA reflects a compensatory response remains to be ascertained. Another parallel between prenatal T–treated sheep and women with PCOS relates to the lipid accumulation in the muscle: an increase in muscle lipid content has also been observed in women with PCOS (84). The increased lipid accumulation in liver of prenatal T–treated sheep is also consistent with the increased incidence of nonalcoholic fatty liver disease in women with PCOS, where it was reported to correlate with hyperandrogenism but was independent of their obesity (65).
In summary, the findings from this study provide evidence that prenatal exposure to excess T leads to tissue-specific changes in negative and positive regulators of insulin sensitivity, consistent with the insulin sensitivity status of these tissues, namely IR in muscle and liver and a lack of IR in adipose tissue. These findings indicate that androgenic, metabolic, and potentially estrogenic pathways synergize in organizing the developmental trajectory of organ systems involved in establishing insulin sensitivity and act as activational agents in the manifestation and maintenance of pathophysiology. In addition, the similarities observed between the prenatal T–treated sheep and women with PCOS raise the possibility that ectopic lipid accumulation is a major contributor in the development of insulin resistance in both these scenarios.
Acknowledgments
We thank Douglas Doop and Gary McCalla for valuable assistance in breeding, lambing, and careful animal care; Dr. Almudena Veiga-Lopez, Dr. Bachir Abi Salloum, Evan Beckett, Carol Herkimer, and the Undergraduate Research Opportunity Program (University of Michigan) students for help with administration of treatments and tissue collection; and Jacob D. Martin for help with tissue sectioning and image analysis.
Acknowledgments
This work was supported by National Institutes of Health Grant P01 HD44232.
Disclosure Summary: The authors have nothing to disclose.
Footnotes
- AMPK
- 5′ AMP-activated protein kinase
- ANOVA
- analysis of variance
- C
- Control
- ClY
- 3-chlorotyrosine
- DY
- o, o′-dityrosine
- GSR
- glutathione reductase
- H&E
- hematoxylin and eosin
- HMW
- high molecular weight
- IR
- insulin resistance
- LMW
- low molecular weight
- MMW
- middle molecular weight
- mRNA
- messenger RNA
- NY
- 3-nitrotyrosine
- PCOS
- polycystic ovary syndrome
- SAT
- subcutaneous adipose tissue
- SOD
- superoxide dismutase
- T
- testosterone
- TF
- cotreatment with testosterone and flutamide
- TR
- cotreatment with testosterone and rosiglitazone
- T+F
- prenatal testosterone and postnatal flutamide
- T+R
- prenatal testosterone and postnatal rosiglitazone
- VAT
- visceral adipose tissue.
References
- 1.DeFronzo RA, Ferrannini E. Insulin resistance: a multifaceted syndrome responsible for NIDDM, obesity, hypertension, dyslipidemia, and atherosclerotic cardiovascular disease. Diabetes Care. 1991;14(3):173–194. [DOI] [PubMed] [Google Scholar]
- 2.Sowers JR. Insulin resistance, hyperinsulinemia, dyslipidemia, hypertension, and accelerated atherosclerosis. J Clin Pharmacol. 1992;32(6):529–535. [DOI] [PubMed] [Google Scholar]
- 3.Yusuf S, Reddy S, Ôunpuu S, Anand S. Global burden of cardiovascular diseases: part I: general considerations, the epidemiologic transition, risk factors, and impact of urbanization. Circulation. 2001;104(22):2746–2753. [DOI] [PubMed] [Google Scholar]
- 4.Bruce KD, Hanson MA. The developmental origins, mechanisms, and implications of metabolic syndrome. J Nutr. 2010;140(3):648–652. [DOI] [PubMed] [Google Scholar]
- 5.Diamanti-Kandarakis E, Dunaif A. Insulin resistance and the polycystic ovary syndrome revisited: an update on mechanisms and implications. Endocr Rev. 2012;33(6):981–1030. [DOI] [PMC free article] [PubMed] [Google Scholar]
- 6.Chevalier N, Fénichel P. Endocrine disruptors: new players in the pathophysiology of type 2 diabetes? Diabetes Metab. 2015;41(2):107–115. [DOI] [PubMed] [Google Scholar]
- 7.Padmanabhan V, Sarma HN, Savabieasfahani M, Steckler TL, Veiga-Lopez A. Developmental reprogramming of reproductive and metabolic dysfunction in sheep: native steroids vs. environmental steroid receptor modulators. Int J Androl. 2010;33(2):394–404. [DOI] [PMC free article] [PubMed] [Google Scholar]
- 8.Padmanabhan V, Veiga-Lopez A. Animal models of the polycystic ovary syndrome phenotype. Steroids. 2013;78(8):734–740. [DOI] [PMC free article] [PubMed] [Google Scholar]
- 9.Abbott DH, Zhou R, Bird IM, Dumesic DA, Conley AJ. Fetal programming of adrenal androgen excess: lessons from a nonhuman primate model of polycystic ovary syndrome. Endocr Dev. 2008;13:145–158. [DOI] [PMC free article] [PubMed] [Google Scholar]
- 10.Cardoso RC, Puttabyatappa M, Padmanabhan V. Steroidogenic versus metabolic programming of reproductive neuroendocrine, ovarian and metabolic dysfunctions. Neuroendocrinology. 2015;102(3):226–237. [DOI] [PMC free article] [PubMed] [Google Scholar]
- 11.Cardoso RC, Veiga-Lopez A, Moeller J, Beckett E, Pease A, Keller E, Madrigal V, Chazenbalk G, Dumesic D, Padmanabhan V. Developmental programming: impact of gestational steroid and metabolic milieus on adiposity and insulin sensitivity in prenatal testosterone-treated female sheep. Endocrinology. 2016;157(2):522–535. [DOI] [PMC free article] [PubMed] [Google Scholar]
- 12.Veiga-Lopez A, Moeller J, Patel D, Ye W, Pease A, Kinns J, Padmanabhan V. Developmental programming: impact of prenatal testosterone excess on insulin sensitivity, adiposity, and free fatty acid profile in postpubertal female sheep. Endocrinology. 2013;154(5):1731–1742. [DOI] [PMC free article] [PubMed] [Google Scholar]
- 13.Nada SE, Thompson RC, Padmanabhan V. Developmental programming: differential effects of prenatal testosterone excess on insulin target tissues. Endocrinology. 2010;151(11):5165–5173. [DOI] [PMC free article] [PubMed] [Google Scholar]
- 14.Lu C, Cardoso RC, Puttabyatappa M, Padmanabhan V. Developmental programming: prenatal testosterone excess and insulin signaling disruptions in female sheep. Biol Reprod. 2016;94(5):113. [DOI] [PMC free article] [PubMed] [Google Scholar]
- 15.Demissie M, Lazic M, Foecking EM, Aird F, Dunaif A, Levine JE. Transient prenatal androgen exposure produces metabolic syndrome in adult female rats. Am J Physiol Endocrinol Metab. 2008;295(2):E262–E268. [DOI] [PMC free article] [PubMed] [Google Scholar]
- 16.Liu W, Baker RD, Bhatia T, Zhu L, Baker SS. Pathogenesis of nonalcoholic steatohepatitis. Cell Mol Life Sci. 2016;73(10):1969–1987. [DOI] [PMC free article] [PubMed] [Google Scholar]
- 17.Esser N, Legrand-Poels S, Piette J, Scheen AJ, Paquot N. Inflammation as a link between obesity, metabolic syndrome and type 2 diabetes. Diabetes Res Clin Pract. 2014;105(2):141–150. [DOI] [PubMed] [Google Scholar]
- 18.Verdile G, Keane KN, Cruzat VF, Medic S, Sabale M, Rowles J, Wijesekara N, Martins RN, Fraser PE, Newsholme P. Inflammation and oxidative stress: the molecular connectivity between insulin resistance, obesity, and alzheimer's disease. Mediators Inflamm. 2015;2015:105828 [DOI] [PMC free article] [PubMed] [Google Scholar]
- 19.Lee BC, Lee J. Cellular and molecular players in adipose tissue inflammation in the development of obesity-induced insulin resistance. Biochim Biophysica acta. 2014;1842:446–462. [DOI] [PMC free article] [PubMed] [Google Scholar]
- 20.Rani V, Deep G, Singh RK, Palle K, Yadav UC. Oxidative stress and metabolic disorders: pathogenesis and therapeutic strategies. Life Sci. 2016;148:183–193. [DOI] [PubMed] [Google Scholar]
- 21.Unger RH, Orci L. Lipotoxic diseases of nonadipose tissues in obesity. Int J Obes Relat Metab Disord. 2000;24(Suppl 4):S28–S32. [DOI] [PubMed] [Google Scholar]
- 22.Jacob S, Machann J, Rett K, Brechtel K, Volk A, Renn W, Maerker E, Matthaei S, Schick F, Claussen CD, Häring HU. Association of increased intramyocellular lipid content with insulin resistance in lean nondiabetic offspring of type 2 diabetic subjects. Diabetes. 1999;48(5):1113–1119. [DOI] [PubMed] [Google Scholar]
- 23.Shulman GI. Ectopic fat in insulin resistance, dyslipidemia, and cardiometabolic disease. N Engl J Med. 2014;371(12):1131–1141. [DOI] [PubMed] [Google Scholar]
- 24.Liu Y, Sweeney G. Adiponectin action in skeletal muscle. Best Pract Res Clin Endocrinol Metab. 2014;28(1):33–41. [DOI] [PubMed] [Google Scholar]
- 25.Kadowaki T, Yamauchi T. Adiponectin and adiponectin receptors. Endocr Rev. 2005;26(3):439–451. [DOI] [PubMed] [Google Scholar]
- 26.Yamauchi T, Kadowaki T. Physiological and pathophysiological roles of adiponectin and adiponectin receptors in the integrated regulation of metabolic and cardiovascular diseases. Int J Obes. 2008;32(Suppl 7):S13–S18. [DOI] [PubMed] [Google Scholar]
- 27.Fu Y. Adiponectin signaling and metabolic syndrome. Prog Mol Biol Transl Sci. 2014;121:293–319. [DOI] [PubMed] [Google Scholar]
- 28.Hu E, Liang P, Spiegelman BM. AdipoQ is a novel adipose-specific gene dysregulated in obesity. J Biol Chem. 1996;271(18):10697–10703. [DOI] [PubMed] [Google Scholar]
- 29.Matsushita K, Yatsuya H, Tamakoshi K, Wada K, Otsuka R, Takefuji S, Sugiura K, Kondo T, Murohara T, Toyoshima H. Comparison of circulating adiponectin and proinflammatory markers regarding their association with metabolic syndrome in Japanese men. Arterioscler Thromb Vasc Biol. 2006;26(4):871–876. [DOI] [PubMed] [Google Scholar]
- 30.Caselli C. Role of adiponectin system in insulin resistance. Mol Genet Metab. 2014;113(3):155–160. [DOI] [PubMed] [Google Scholar]
- 31.Styskal J, Van Remmen H, Richardson A, Salmon AB. Oxidative stress and diabetes: what can we learn about insulin resistance from antioxidant mutant mouse models? Free Radic Biol Med. 2012;52(1):46–58. [DOI] [PMC free article] [PubMed] [Google Scholar]
- 32.Veiga-Lopez A, Steckler TL, Abbott DH, Welch KB, MohanKumar PS, Phillips DJ, Refsal K, Padmanabhan V. Developmental programming: impact of excess prenatal testosterone on intrauterine fetal endocrine milieu and growth in sheep. Biol Reprod. 2011;84(1):87–96. [DOI] [PMC free article] [PubMed] [Google Scholar]
- 33.Abi Salloum B, Veiga-Lopez A, Abbott DH, Burant CF, Padmanabhan V. Developmental programming: exposure to testosterone excess disrupts steroidal and metabolic environment in pregnant sheep. Endocrinology. 2015;156(6):2323–2337. [DOI] [PMC free article] [PubMed] [Google Scholar]
- 34.Manikkam M, Crespi EJ, Doop DD, Herkimer C, Lee JS, Yu S, Brown MB, Foster DL, Padmanabhan V. Fetal programming: prenatal testosterone excess leads to fetal growth retardation and postnatal catch-up growth in sheep. Endocrinology. 2004;145(2):790–798. [DOI] [PubMed] [Google Scholar]
- 35.Padmanabhan V, Veiga-Lopez A, Herkimer C, Abi Salloum B, Moeller J, Beckett E, Sreedharan R. Developmental programming: prenatal and postnatal androgen antagonist and insulin sensitizer interventions prevent advancement of puberty and improve LH surge dynamics in prenatal testosterone-treated sheep. Endocrinology. 2015;156(7):2678–2692. [DOI] [PMC free article] [PubMed] [Google Scholar]
- 36.Jackson LM, Timmer KM, Foster DL. Sexual differentiation of the external genitalia and the timing of puberty in the presence of an antiandrogen in sheep. Endocrinology. 2008;149(8):4200–4208. [DOI] [PMC free article] [PubMed] [Google Scholar]
- 37.Veiga-Lopez A, Lee JS, Padmanabhan V. Developmental programming: insulin sensitizer treatment improves reproductive function in prenatal testosterone-treated female sheep. Endocrinology. 2010;151(8):4007–4017. [DOI] [PMC free article] [PubMed] [Google Scholar]
- 38.Abi Salloum B, Herkimer C, Lee JS, Veiga-Lopez A, Padmanabhan V. Developmental programming: prenatal and postnatal contribution of androgens and insulin in the reprogramming of estradiol positive feedback disruptions in prenatal testosterone-treated sheep. Endocrinology. 2012;153(6):2813–2822. [DOI] [PMC free article] [PubMed] [Google Scholar]
- 39.Goodman RL, Legan SJ, Ryan KD, Foster DL, Karsch FJ. Importance of variations in behavioural and feedback actions of oestradiol to the control of seasonal breeding in the ewe. J Endocrinol. 1981;89(2):229–240. [DOI] [PubMed] [Google Scholar]
- 40.Mielenz M, Mielenz B, Singh SP, Kopp C, Heinz J, Häussler S, Sauerwein H. Development, validation, and pilot application of a semiquantitative Western blot analysis and an ELISA for bovine adiponectin. Domest Anim Endocrinol. 2013;44(3):121–130. [DOI] [PubMed] [Google Scholar]
- 41.Vivekanandan-Giri A, Byun J, Pennathur S. Quantitative analysis of amino acid oxidation markers by tandem mass spectrometry. Methods Enzymol. 2011;491:73–89. [DOI] [PMC free article] [PubMed] [Google Scholar]
- 42.Bancroft JD, Cook HC. Manual of histological techniques. New York: Churchill Livingstone. [Google Scholar]
- 43.Lejeune M, Jaén J, Pons L, López C, Salvadó MT, Bosch R, García M, Escrivà P, Baucells J, Cugat X, Alvaro T. Quantification of diverse subcellular immunohistochemical markers with clinicobiological relevancies: validation of a new computer-assisted image analysis procedure. J Anat. 2008;212(6):868–878. [DOI] [PMC free article] [PubMed] [Google Scholar]
- 44.Ortega HH, Salvetti NR, Padmanabhan V. Developmental programming: prenatal androgen excess disrupts ovarian steroid receptor balance. Reproduction. 2009;137(5):865–877. [DOI] [PMC free article] [PubMed] [Google Scholar]
- 45.Bligh EG, Dyer WJ. A rapid method of total lipid extraction and purification. Can J Biochem Physiol. 1959;37(8):911–917. [DOI] [PubMed] [Google Scholar]
- 46.Cohen J. A power primer. Psychol Bull. 1992;112(1):155–159. [DOI] [PubMed] [Google Scholar]
- 47.Nakagawa S, Cuthill IC. Effect size, confidence interval and statistical significance: a practical guide for biologists. Biol Rev Camb Philos Soc. 2007;82(4):591–605. [DOI] [PubMed] [Google Scholar]
- 48.Ruan H, Dong LQ. Adiponectin signaling and function in insulin target tissues. J Mol Cell Biol. 2016;8(2):101–109. [DOI] [PMC free article] [PubMed] [Google Scholar]
- 49.Müller G. Let’s shift lipid burden: from large to small adipocytes. Eur J Pharmacol. 2011;656(1-3):1–4. [DOI] [PubMed] [Google Scholar]
- 50.Evans JL, Goldfine ID, Maddux BA, Grodsky GM. Are oxidative stress-activated signaling pathways mediators of insulin resistance and beta-cell dysfunction? Diabetes. 2003;52(1):1–8. [DOI] [PubMed] [Google Scholar]
- 51.Sanders F, McNally B, Griffin JL. Blood triacylglycerols: a lipidomic window on diet and disease. Biochem Soc Trans. 2016;44(2):638–644. [DOI] [PubMed] [Google Scholar]
- 52.Padmanabhan V, Veiga-Lopez A, Abbott DH, Recabarren SE, Herkimer C. Developmental programming: impact of prenatal testosterone excess and postnatal weight gain on insulin sensitivity index and transfer of traits to offspring of overweight females. Endocrinology. 2010;151(2):595–605. [DOI] [PMC free article] [PubMed] [Google Scholar]
- 53.O’Connor A, Phelan N, Tun TK, Boran G, Gibney J, Roche HM. High-molecular-weight adiponectin is selectively reduced in women with polycystic ovary syndrome independent of body mass index and severity of insulin resistance. J Clin Endocrinol Metab. 2010;95(3):1378–1385. [DOI] [PubMed] [Google Scholar]
- 54.Liu A, Sonmez A, Yee G, Bazuine M, Arroyo M, Sherman A, McLaughlin T, Reaven G, Cushman S, Tsao P. Differential adipogenic and inflammatory properties of small adipocytes in Zucker obese and lean rats. Diab Vasc Dis Res. 2010;7(4):311–318. [DOI] [PMC free article] [PubMed] [Google Scholar]
- 55.McLaughlin T, Deng A, Yee G, Lamendola C, Reaven G, Tsao PS, Cushman SW, Sherman A. Inflammation in subcutaneous adipose tissue: relationship to adipose cell size. Diabetologia. 2010;53(2):369–377. [DOI] [PMC free article] [PubMed] [Google Scholar]
- 56.Evans JL, Maddux BA, Goldfine ID. The molecular basis for oxidative stress-induced insulin resistance. Antioxid Redox Signal. 2005;7(7-8):1040–1052. [DOI] [PubMed] [Google Scholar]
- 57.Cappelli V, Di Sabatino A, Musacchio MC, De Leo V. Evaluation of a new association between insulin-sensitizers and α-lipoic acid in obese women affected by PCOS[ in Italian]. Minerva Ginecol. 2013;65(4):425–433. [PubMed] [Google Scholar]
- 58.Kwok KH, Lam KS, Xu A. Heterogeneity of white adipose tissue: molecular basis and clinical implications. Exp Mol Med. 2016;48:e215. [DOI] [PMC free article] [PubMed] [Google Scholar]
- 59.Wronska A, Kmiec Z. Structural and biochemical characteristics of various white adipose tissue depots. Acta Physiol (Oxf). 2012;205(2):194–208. [DOI] [PubMed] [Google Scholar]
- 60.Hocking SL, Wu LE, Guilhaus M, Chisholm DJ, James DE. Intrinsic depot-specific differences in the secretome of adipose tissue, preadipocytes, and adipose tissue-derived microvascular endothelial cells. Diabetes. 2010;59(12):3008–3016. [DOI] [PMC free article] [PubMed] [Google Scholar]
- 61.Kaikkonen JE, Würtz P, Suomela E, Lehtovirta M, Kangas AJ, Jula A, Mikkilä V, Viikari JS, Juonala M, Rönnemaa T, Hutri-Kähönen N, Kähönen M, Lehtimäki T, Soininen P, Ala-Korpela M, Raitakari OT. Metabolic profiling of fatty liver in young and middle-aged adults: cross-sectional and prospective analyses of the Young Finns Study. Hepatology. 2017;65(2):491–500. [DOI] [PMC free article] [PubMed] [Google Scholar]
- 62.Ruderman NB, Carling D, Prentki M, Cacicedo JM. AMPK, insulin resistance, and the metabolic syndrome. J Clin Invest. 2013;123(7):2764–2772. [DOI] [PMC free article] [PubMed] [Google Scholar]
- 63.Hogg K, Wood C, McNeilly AS, Duncan WC. The in utero programming effect of increased maternal androgens and a direct fetal intervention on liver and metabolic function in adult sheep. PLoS One. 2011;6(9):e24877. [DOI] [PMC free article] [PubMed] [Google Scholar]
- 64.Vassilatou E, Lafoyianni S, Vryonidou A, Ioannidis D, Kosma L, Katsoulis K, Papavassiliou E, Tzavara I. Increased androgen bioavailability is associated with non-alcoholic fatty liver disease in women with polycystic ovary syndrome. Hum Reprod. 2010;25(1):212–220. [DOI] [PubMed] [Google Scholar]
- 65.Jones H, Sprung VS, Pugh CJ, Daousi C, Irwin A, Aziz N, Adams VL, Thomas EL, Bell JD, Kemp GJ, Cuthbertson DJ. Polycystic ovary syndrome with hyperandrogenism is characterized by an increased risk of hepatic steatosis compared to nonhyperandrogenic PCOS phenotypes and healthy controls, independent of obesity and insulin resistance. J Clin Endocrinol Metab. 2012;97(10):3709–3716. [DOI] [PubMed] [Google Scholar]
- 66.Cooke PS, Naaz A. Role of estrogens in adipocyte development and function. Exp Biol Med (Maywood). 2004;229(11):1127–1135. [DOI] [PubMed] [Google Scholar]
- 67.Okazaki R, Inoue D, Shibata M, Saika M, Kido S, Ooka H, Tomiyama H, Sakamoto Y, Matsumoto T. Estrogen promotes early osteoblast differentiation and inhibits adipocyte differentiation in mouse bone marrow stromal cell lines that express estrogen receptor (ER) alpha or beta. Endocrinology. 2002;143(6):2349–2356. [DOI] [PubMed] [Google Scholar]
- 68.Mehlem A, Hagberg CE, Muhl L, Eriksson U, Falkevall A. Imaging of neutral lipids by oil red O for analyzing the metabolic status in health and disease. Nat Protoc. 2013;8(6):1149–1154. [DOI] [PubMed] [Google Scholar]
- 69.Caldwell ASL, Edwards MC, Desai R, Jimenez M, Gilchrist RB, Handelsman DJ, Walters KA. Neuroendocrine androgen action is a key extraovarian mediator in the development of polycystic ovary syndrome. Proc Natl Acad Sci USA. 2017;114(16):E3334–E3343. [DOI] [PMC free article] [PubMed] [Google Scholar]
- 70.Lessard SJ, Rivas DA, Chen ZP, Bonen A, Febbraio MA, Reeder DW, Kemp BE, Yaspelkis BB III, Hawley JA. Tissue-specific effects of rosiglitazone and exercise in the treatment of lipid-induced insulin resistance. Diabetes. 2007;56(7):1856–1864. [DOI] [PubMed] [Google Scholar]
- 71.Rehan VK, Liu J, Naeem E, Tian J, Sakurai R, Kwong K, Akbari O, Torday JS. Perinatal nicotine exposure induces asthma in second generation offspring. BMC Med. 2012;10:129. [DOI] [PMC free article] [PubMed] [Google Scholar]
- 72.Bayer TA, Falkai P, Maier W. Genetic and non-genetic vulnerability factors in schizophrenia: the basis of the “two hit hypothesis”. J Psychiatr Res. 1999;33(6):543–548. [DOI] [PubMed] [Google Scholar]
- 73.Puttabyatappa M, Cardoso RC, Padmanabhan V. Effect of maternal PCOS and PCOS-like phenotype on the offspring’s health. Mol Cell Endocrinol. 2015. In press. [DOI] [PMC free article] [PubMed]
- 74.Steckler TL, Herkimer C, Dumesic DA, Padmanabhan V. Developmental programming: excess weight gain amplifies the effects of prenatal testosterone excess on reproductive cyclicity: implication for polycystic ovary syndrome. Endocrinology. 2009;150(3):1456–1465. [DOI] [PMC free article] [PubMed] [Google Scholar]
- 75.Pajvani UB, Hawkins M, Combs TP, Rajala MW, Doebber T, Berger JP, Wagner JA, Wu M, Knopps A, Xiang AH, Utzschneider KM, Kahn SE, Olefsky JM, Buchanan TA, Scherer PE. Complex distribution, not absolute amount of adiponectin, correlates with thiazolidinedione-mediated improvement in insulin sensitivity. J Biol Chem. 2004;279(13):12152–12162. [DOI] [PubMed] [Google Scholar]
- 76.Shoelson SE, Lee J, Goldfine AB. Inflammation and insulin resistance. J Clin Invest. 2006;116(7):1793–1801. [DOI] [PMC free article] [PubMed] [Google Scholar]
- 77.Rains JL, Jain SK. Oxidative stress, insulin signaling, and diabetes. Free Radic Biol Med. 2011;50(5):567–575. [DOI] [PMC free article] [PubMed] [Google Scholar]
- 78.Diamanti-Kandarakis E, Mitrakou A, Raptis S, Tolis G, Duleba AJ. The effect of a pure antiandrogen receptor blocker, flutamide, on the lipid profile in the polycystic ovary syndrome. J Clin Endocrinol Metab. 1998;83(8):2699–2705. [DOI] [PubMed] [Google Scholar]
- 79.Mayerson AB, Hundal RS, Dufour S, Lebon V, Befroy D, Cline GW, Enocksson S, Inzucchi SE, Shulman GI, Petersen KF. The effects of rosiglitazone on insulin sensitivity, lipolysis, and hepatic and skeletal muscle triglyceride content in patients with type 2 diabetes. Diabetes. 2002;51(3):797–802. [DOI] [PMC free article] [PubMed] [Google Scholar]
- 80.Padmanabhan V, Veiga-Lopez A. Sheep models of polycystic ovary syndrome phenotype. Mol Cell Endocrinol. 2013;373(1-2):8–20. [DOI] [PMC free article] [PubMed] [Google Scholar]
- 81.Macut D, Bjekić-Macut J, Savić-Radojević A. Dyslipidemia and oxidative stress in PCOS. Front Horm Res. 2013;40:51–63. [DOI] [PubMed] [Google Scholar]
- 82.Cortón M, Botella-Carretero JI, Benguría A, Villuendas G, Zaballos A, San Millán JL, Escobar-Morreale HF, Peral B. Differential gene expression profile in omental adipose tissue in women with polycystic ovary syndrome. J Clin Endocrinol Metab. 2007;92(1):328–337. [DOI] [PubMed] [Google Scholar]
- 83.Chen L, Xu WM, Zhang D. Association of abdominal obesity, insulin resistance, and oxidative stress in adipose tissue in women with polycystic ovary syndrome [published correction appears in Fertil Steril. 2014 Nov;102(5):1499]. Fertil Steril. 2014;102:1167–1174.e4. [DOI] [PubMed] [Google Scholar]
- 84.Venkatesan AM, Dunaif A, Corbould A. Insulin resistance in polycystic ovary syndrome: progress and paradoxes. Recent Prog Horm Res. 2001;56:295–308. [DOI] [PubMed] [Google Scholar]


