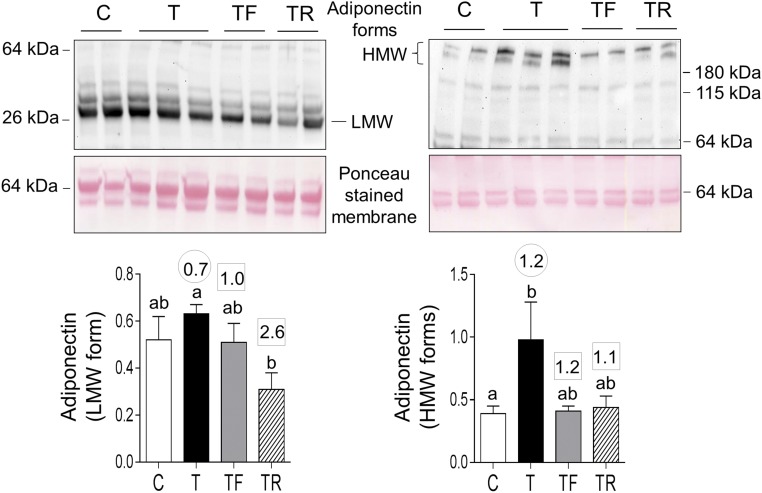
Figure 3.
Plasma levels of LMW and HMW forms of adiponectin in C, T, TF, and TR groups. Top panels show representative blots under reducing conditions (left, LMW) and nonreducing conditions (right, HMW forms) along with Ponceau staining for protein loading. Bottom panels show mean ± standard error of the mean of density ratios between LMW (bottom left) and HMW (bottom right) forms of adiponectin with the 64-kDa protein from the Ponceau-stained membrane. Differing letters above the histogram indicate significant changes by ANOVA. Numerical superscripts are Cohen d values comparing (1) C vs T (within the circle) and (2) TF and TR vs T (within the square box).

