Abstract
Previous studies with continuous glucose monitoring in mice have been limited to several days or weeks, with the mouse's physical attachment to the equipment affecting behavior and measurements. In the current study, we measured blood glucose and body temperature at 10-second intervals for 12 weeks in a cohort of NOD/ShiLtJ female mice using wireless telemetry. This allowed us to obtain a high-resolution profile of the circadian rhythm of these two parameters and the onset of hyperglycemic development in real time. The most striking observations were the elevated nocturnal concentrations of glucose into the diabetic range days before elevations in diurnal glucose (when glucose concentrations are historically measured) and the strong, negative correlation between elevated blood glucose concentrations and body temperature with a steady decline of the body temperature with diabetes development. Taken together, this technological advancement provides improved resolution in the study of the disease trajectory of diabetes in mouse models, including relevant translatability to the current technologies of continuous glucose monitoring now regularly used in patients.
This study measured blood glucose and body temperature at 10-second intervals for 12 weeks in NOD/ShiLtJ female mice by using wireless telemetry and showed a negative correlation between the two parameters.
Blood glucose concentrations show a daily rhythm in mammals, including humans and rodents. Previous studies aimed at monitoring the circadian rhythm of glucose in mice have been limited by restrictions in the sampling frequency and changes in behavior due to restraint required for sample collection. Previously reported continuous glucose monitoring in mice used different approaches, including repeated blood collections and the use of glucose sensors that are tethered to a commutator by a cable (1). These studies have been valuable in providing more insight in the changes over time and spontaneous type 1 diabetes development in the nonobese diabetic (NOD) mouse but have been limited by the resolution (time between measurements) or the equipment impairing the normal behavior of the mouse.
Wireless telemetry to measure glucose concentrations is the latest technology being used in humans and has now been recently reported for rats (2). In rodents, the implanted device consists of an electrochemical glucose oxidase sensor and a housing unit containing the battery and electronics to convert and transmit the signal. Temperature is measured within the telemetry housing. This device has recently been adapted to make it suitable for implantation in mice with body weights >19 g.
The purpose of this longitudinal study was to test the device in a mouse model for diabetes and compare the high-resolution measurements with previously obtained longitudinal data for this model using standard methods. In this study, we implanted these telemetry devices into 10 prediabetic NOD/ShiLtJ 7-week-old female mice and continuously monitored blood glucose and body temperature for 12 weeks. This strain is intensively studied as a model of autoimmune-mediated type 1 diabetes, with most females transitioning from prediabetes to diabetes between 10 and 30 weeks of age (3).
Materials and Methods
Animals and housing
Ten female NOD/ShiLtJ mice (JR001976; The Jackson Laboratory, Bar Harbor, ME) were housed in a research vivarium at The Jackson Laboratory, which is accredited by the American Association for Accreditation of Laboratory Animal Care. Mice were kept at a 12-hour (6 am–6 pm) light/dark cycle with a room temperature between 68°F and 72°F (20°C to 22°C) and were provided ad libitum access to a standard rodent diet (5K52; LabDiet, St. Louis, MO) and acidified drinking water. Animal studies were approved by The Jackson Laboratory's Institutional Animal Care and Use Committee.
Telemetry
At 7 weeks of age, mice surgically received an HD-XG blood glucose implant [Data Sciences International (DSI), St. Paul, MN] such that the sensor was located in the aortic arch and the transmitter body was located subcutaneously in the right flank. The implant was prepared as per manufacturer instructions. The body weight of the mice at the time of device implantation was between 19 and 23 g. The mice were anesthetized with an intraperitoneal injection of tribromoethanol (400 mg/kg) and carprofen was administered (5 mg/kg) subcutaneously. Supplemental heat was provided throughout the surgical and recovery periods. Fur was removed from the surgical site and the skin disinfected with sequential applications of 70% ethanol and 2% chlorhexidine. A ventral, paramedian skin incision was made over the left carotid artery, and the soft tissues were bluntly dissected to expose the artery. A piece of 6-0 nonabsorbable suture was placed at the bifurcation of the left common carotid to permanently ligate the artery, and a temporary occlusion suture was placed several millimeters caudal to the ligation. The artery was incised and the sensor was inserted caudally and advanced until the sensor tip was approximately 2 mm into the aortic arch. The occlusion suture was tightened around the sensor, and an additional ligature was placed to hold the sensor within the artery. The transmitter was placed in a subcutaneous pocket in the right flank. Bupivacaine (1%) was applied to the incision site and closed with 5-0 nonabsorbable suture. Mice were given 1 mL of warmed sterile saline and buprenorphine (0.05 mg/kg) subcutaneously during the anesthesia recovery period.
Mice were singly housed and, after a 1-week recovery, each mouse was individually housed in a cage that was placed on top of an RPC-1 receiver (DSI). Throughout the experiment, signals were collected at 1 Hz and saved as 10-second moving averages by a PC desktop running Dataquest A.R.T. 4.36 software (DSI). Although the battery life of the device has a threshold of 28 days, most of our devices measured between 80 and 90 days continuously.
Glucose tolerance test and glucose measurements
A glucose tolerance test was performed to calibrate the sensor at 10 and 14 weeks of age. Glucose, 2 mg/g body weight (G8769; Sigma-Aldrich, St. Louis, MO) was injected into the intraperitoneal cavity, and two drops of blood (∼50 μL) from the tail vein were collected at the time of injection. The real-time signal was concurrently monitored for changes in blood glucose; 5 minutes after the peak was reached, an additional two drops of blood were obtained from the tail vein (∼50 µL). Glucose concentrations were measured in duplicate for each time point by using a NovaStatStrip Xpress (Nova Biomedical, Waltham, MA). In addition to the glucose tolerance test, two drops of blood (∼50 µL) from the tail vein were collected and measured twice weekly and used to calibrate the device and adjust from any drift of the signal. Consistent with historical data, glucose concentrations <150 mg/dL were considered normal and concentrations >250 mg/dL were considered diabetic.
Statistical analysis
All data were plotted and analyzed by using JMP software, version 11 (SAS Institute, Cary, NC). To reduce noise, we calculated the averages for glucose and temperature for each 5-minute interval over the 12-week period for each animal. Correlations between glucose concentration and temperature were determined by linear regression.
Results
Circadian rhythm of glucose concentrations and body temperature
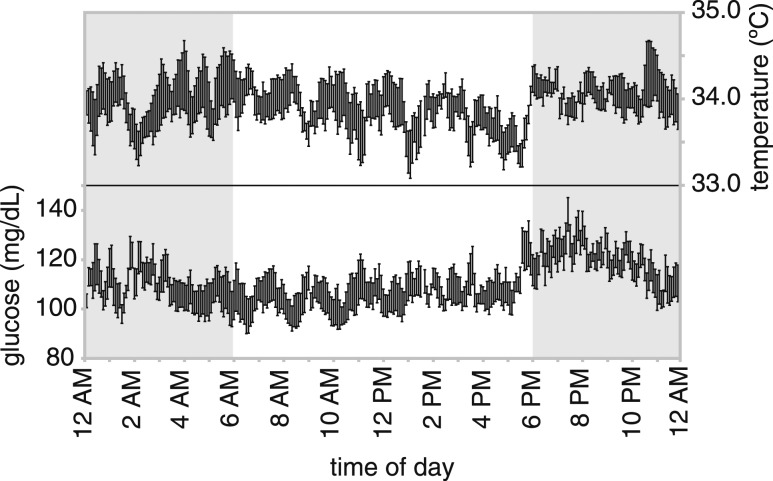
Figure 1 shows blood glucose concentrations at 5-minute intervals as the mean ± standard error the mean for each time point from 5 consecutive days of an 8-week female NOD mouse. As the mouse increases activity and food consumption around the start of the dark period (6 pm), we see an increase in blood glucose concentrations in the first 2 hours of the dark period, followed by a slow decline during the rest of the dark period and a relatively constant level during the day. Within this pattern there seems to be a 1.5- to 2-hour cycle in which glucose fluctuates by 10 mg/dL. We observed this pattern in all other mice (data not shown). Because the telemetry device measures body temperature at the same time, it allows us to study the relationship between glucose concentrations and body temperature. Interestingly, there was an inverse relationship with body temperature and glucose concentrations, with temperature decreasing when glucose concentration is increasing (Fig. 1).
Figure 1.
Mean and standard error of the mean of the body temperature and blood glucose concentrations within a 24-hour period (measurements collected over 5 consecutive days) from a single prediabetic 8-week-old NOD female. In addition to a circadian rhythm, there appear to be a 1.5- to 2-hour cycle and a mirroring between glucose concentrations and body temperatures. Data points are the averages of the 10-second measurements over a 5-minute period.
Diabetes development
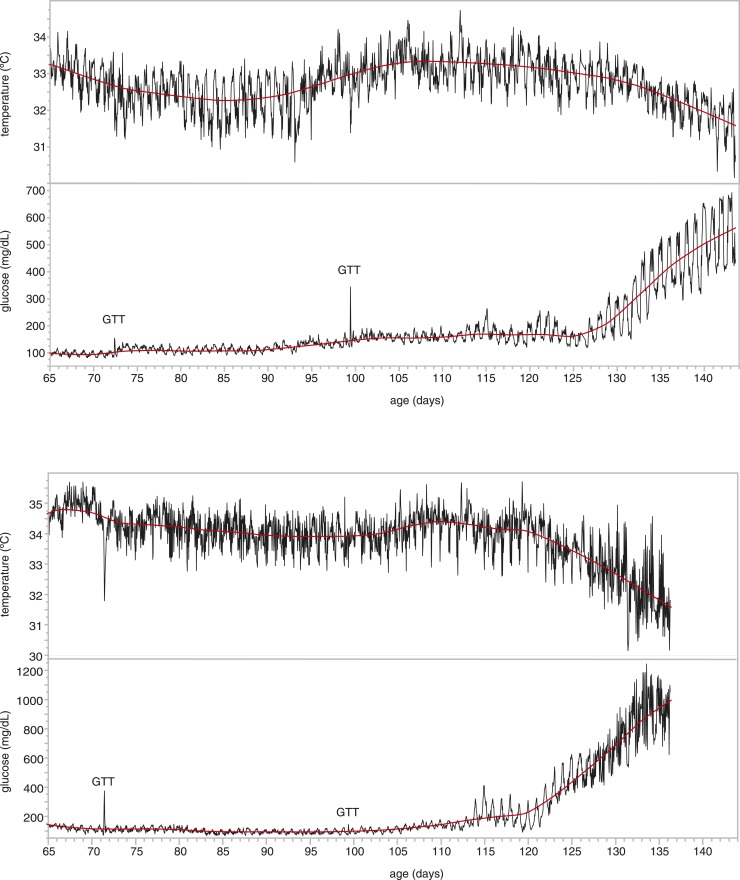
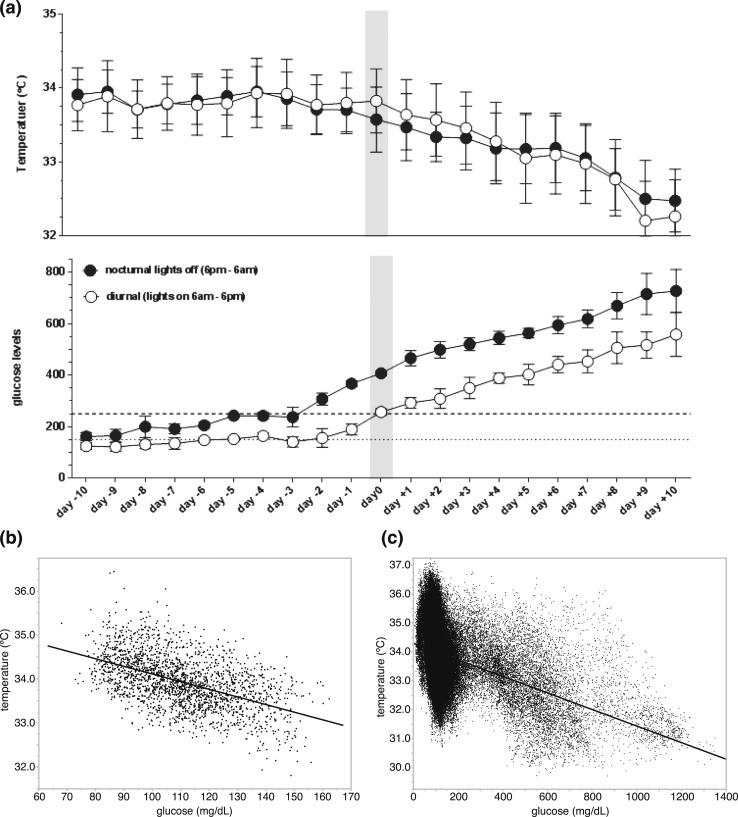
The progressive increase in blood glucose concentrations in NOD females developing diabetes has been shown before at a low resolution (4). That study showed the increase in glucose from a low (nondiabetic) level to a high (diabetic) level within 1 or 2 days. To get a better insight into this development, we analyzed the data of the mice in our cohort that became diabetic within the time frame of our study. Depending on several environmental factors (such as health status and stress), most NOD females become diabetic between 14 and 30 weeks of age. Within the current study (between 8 and 20 weeks of age), four animals became diabetic. Figure 2 illustrates the blood glucose concentrations during the entire 12-week monitoring period for two of the animals (other animals are shown in Supplemental Fig. 1 (206.6KB, pdf) ). Interestingly, several days before we observed diurnal glucose concentrations > 250 mg/dL, which would indicate diabetes, nocturnal glucose concentrations exceeded 250 mg/dL but returned to lower concentrations during the daytime period. Furthermore, in line with the timeframe during which the mice become diabetic, body temperature decreased sharply. These patterns were consistent in all four animals that became diabetic, as is shown when we plot glucose levels and temperature on a time scale where day 0 is the day when the mice reached an average diurnal glucose level of 250 mg/dL [Fig. 3(a)].
Figure 2.
Development of diabetes over a 12-week period for two NOD females, showing the increase in amplitude of the circadian rhythm before the average daily glucose concentrations increase. As the glucose concentrations increase with the development of diabetes, the body temperature decreases. Temperature decreases are also clearly observed during the glucose tolerance tests (GTT). Data points are the averages of the 10-second measurements over a 60-minute period.
Figure 3.
Relationship between blood glucose concentrations and body temperature. (a) Glucose levels and temperature at each time point for the four mice that became diabetic, using a time scale where day 0 is the day when the mice reached an average diurnal glucose level of 250 mg/dL (data presented as mean ± standard error of the mean; n = 4 per time point). (b) Correlation in an 8-week-old nondiabetic mouse measured over a 5-day period. (c) Correlation of all the data from the 10 females over the 12-week period.
Correlation between blood glucose concentrations and body temperature
Because of the observation that the body temperature in the mice inversely mirrors the blood glucose concentrations, we examined the correlation between these two parameters. First, we took the data from the 5-day period of the young, nondiabetic mouse (Fig. 1) and determined a strong negative correlation (R2 = 0.262; P < 0.0001) [Fig. 3(b)]. To see whether this correlation was present over the whole range, we included the data from the whole cohort during the entire 12-week period (218,767 data points) and saw a similar relationship (R2 = 0.167; P < 0.0001) [Fig. 3(c)].
Discussion
Continuous glucose monitoring in mouse models of diabetes has been performed in the past but not at such high resolution (10-second intervals) for such a long period (12 weeks) as in this study. In addition, because of the wireless nature of telemetry, the mice were not restricted in their behavior during the study period. The purpose of this study was to test this device in a mouse model for diabetes and compare the measurements with previously reported longitudinal data for this mouse model using standard methods (4). The obtained data set, with more than 7 million data points (a measurement every 10 seconds during a 12-week interval for 10 animals), allows us to study the changes in blood glucose concentrations in real time with substantial detail.
The circadian rhythm in the blood glucose mostly follows what we expected. Interestingly, glucose concentrations start to increase 30 minutes before the start of the dark period (6 pm), which is likely typical for animals entrained to a consistent circadian period. In the absence of continuous video tracking, we cannot fully explain the 1.5- to 2-hour cycle in the glucose concentrations; however, this may likely be related to the food intake pattern. It would be interesting to combine the glucose telemetry with continuously monitored behavioral tracking by using, for example, the EthoVision system (Noldus) to see whether a behavior tracks with the glucose pattern.
The number of animals becoming diabetic in the study period (from 8 to 20 weeks of age) is lower than expected. Historically, most NOD females become diabetic between 14 and 30 weeks of age under group caging conditions (3). In our study, only four individually housed NOD females became diabetic. The incidence of diabetes in NOD mice is affected by multiple variables, including health status and stress. As far as we are aware, the health status in the room in which the experiment was performed is not different from that in other rooms at The Jackson Laboratory that house group-caged NOD females and where there is a higher incidence of diabetes. However, there were two potential sources of stress that might have affected diabetes onset. Single housing of NOD mice leads to stress and negatively affects diabetes development (5). In the current study, single housing was mandated to prevent interference between telemetry devices. Additionally, we cannot exclude that the stress effect of surgery affected diabetes development. Some of these questions could be answered by adding nonimplanted littermates in future studies. Finally, nearby construction that included blasting of a ledge during the study period may have compounded the stresses of single caging and surgery, although vibration and noise were continuously monitored in the housing room, and no data indicated relationships between glucose and temperature data with any of the construction-related activities.
In the mice that do become diabetic, we first see an increase in the amplitude of the circadian rhythm, with nightly glucose concentrations in the diabetic range and daily concentrations (when glucose is usually measured) in the normal range, before we see the daily concentrations increase (Fig. 2). To our knowledge, this prediabetic stage has not been previously observed and could be of interest for future studies in demonstrating early prediction of diabetes onset.
The most surprising observation in this study is the inverse relation of the body temperature with glucose concentration. It is not clear what mechanism connects these two parameters, and more in-depth studies are needed. However, the fact that we see a drop in the body temperature within minutes of the glucose injection during the glucose tolerance test (Supplemental Fig. 2 (93.3KB, pdf) ) suggest that the changes in body temperature are a consequence of the changes in glucose concentration.
In conclusion, the continuous glucose monitoring system that we used in the current study uncovered several interesting details in female NOD mice, such as a 1.5- to 2-hour glucose cycle, a prediabetic period in which mice show diabetic glucose concentrations at night and normal concentrations during the day, and the inverse correlation between glucose concentrations and body temperature. These observations are not possible with the standard methods, such as those used in the longitudinal study of NOD mice by Ize-Ludlow et al. (4), because of limitations in the frequency of blood collection and the effect of blood collection on the mouse. Using the glucose telemetry devices in combination with other monitoring systems will allow deeper insight into these observations.
Acknowledgments
We thank Drs. Ed Leiter and David Serreze for advice and critical review of the manuscript.
Acknowledgments
This work was supported in part by The Jackson Laboratory Center for Precision Genetics–National Institutes of Health, Office of the Director, U54OD020351, and The Jackson Laboratory Center for Biometric Analysis. The HD-XG blood glucose devices were provided by Data Sciences International at no cost, and results were shared with DSI. However, DSI employees were not involved in study design, experimental execution, or manuscript preparation.
Disclosure Summary: The authors have nothing to disclose.
Footnotes
Abbreviations:
- DSI
- Data Sciences International
- NOD
- nonobese diabetic.
References
- 1.Klueh U, Liu Z, Cho B, Ouyang T, Feldman B, Henning TP, Kaur M, Kreutzer D. Continuous glucose monitoringb in normal mice and mice with prediabetes and diabetes. Diabetes Technol Ther. 2006;8(3):402–412. [DOI] [PubMed] [Google Scholar]
- 2.Brockway R, Tiesma S, Bogie H, White K, Fine M, O’Farrell L, Michael M, Cox A, Coskun T. Fully implantable arterial blood glucose device for metabolic research applications in rats for two months. J Diabetes Sci Technol. 2015;9(4):771–781. [DOI] [PMC free article] [PubMed] [Google Scholar]
- 3.Leiter EH. The NOD mouse: a model for insulin-dependent diabetes mellitus. Curr Protoc Immunol. 2001;Ch15:Unit 15.9. [DOI] [PubMed]
- 4.Ize-Ludlow D, Lightfoot YL, Parker M, Xue S, Wasserfall C, Haller MJ, Schatz D, Becker DJ, Atkinson MA, Mathews CE. Progressive erosion of β-cell function precedes the onset of hyperglycemia in the NOD mouse model of type 1 diabetes. Diabetes. 2011;60(8):2086–2091. [DOI] [PMC free article] [PubMed] [Google Scholar]
- 5.Ader DN, Johnson SB, Huang SW, Riley WJ. Group size, cage shelf level, and emotionality in non-obese diabetic mice: impact on onset and incidence of IDDM. Psychosom Med. 1991;53(3):313–321. [DOI] [PubMed] [Google Scholar]


