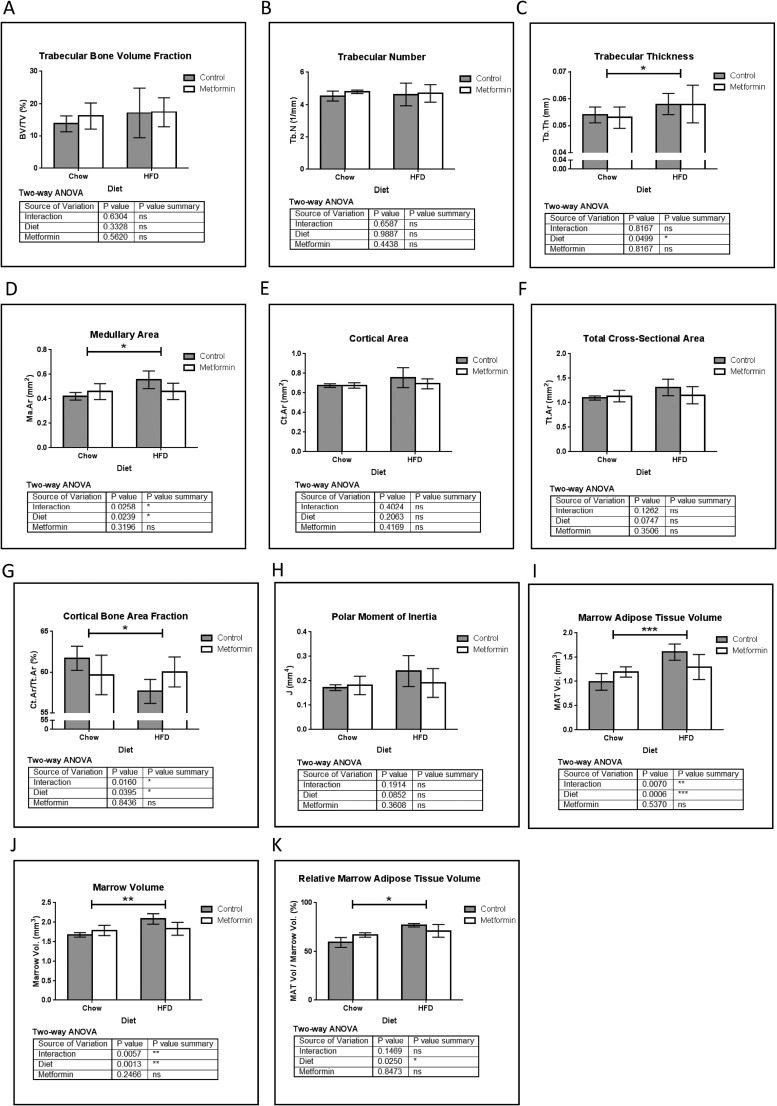
Figure 2.
μCT analysis of tibia. (A) Trabecular bone volume fraction (BV/TV). (B) Trabecular number (Tb.N). (C) Trabecular thickness (Tb.Th). (D) Medullary area (Ma.Ar) was significantly increased by HFD, and a substantial interaction effect was observed whereby metformin tended to normalize this result. (E) Cortical area (Ct.Ar) and (F) total cross-sectional area (Tt.Ar). (G) Cortical bone area fraction decreased in HFD; metformin tended to normalize this bone phenotype with a substantial interaction effect observed. (H) Changes in cortical bone result in a trend of a net increase in the polar moment of inertia (J) in mice on HFD, which is negated upon treatment with metformin. Using OsO4 μCT analysis of tibial MAT, both (I) marrow adipose tissue volume and (J) marrow volume were increased by HFD vs chow and showed a substantial interaction effect between metformin and HFD. (K) Relative MAT volume was significantly increased by HFD, and this was partially reversed with metformin. Data represent mean ± SD analyzed with two-way ANOVA, n = 5 mice for all groups.

