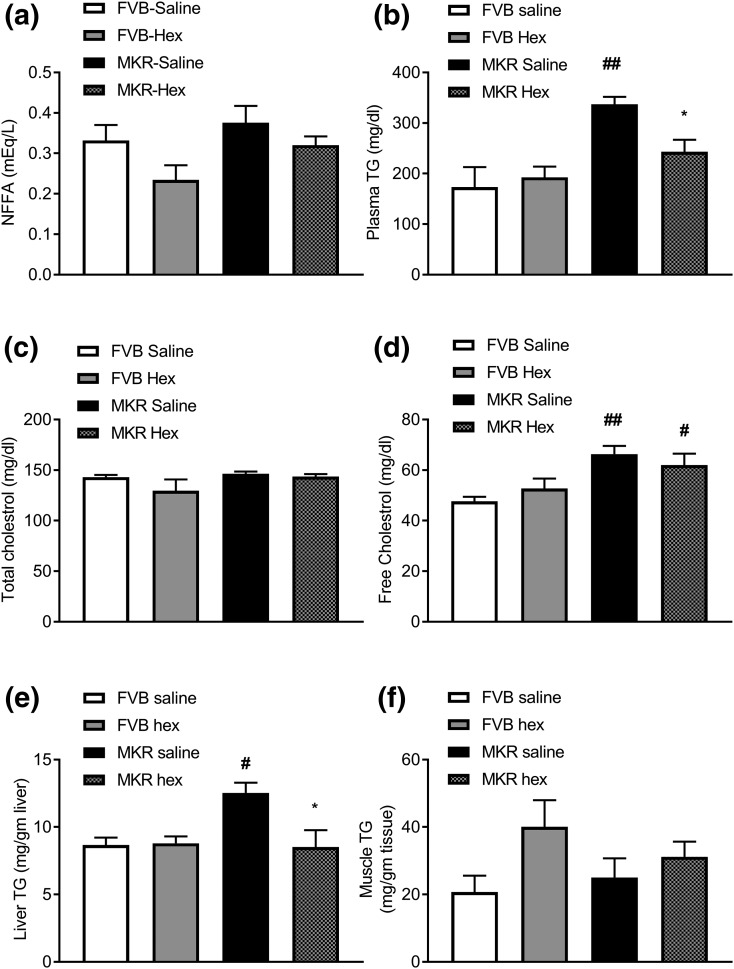
Figure 5.
Effects of hexarelin treatment on (a) plasma FFAs, (b) plasma TGs, (c) plasma total cholesterol, and (d) plasma free cholesterol. Quantitative analyses of TGs in (e) liver and (f) muscles. Data are expressed as mean ± SEM (n = 4 to 7 per group). *P < 0.05 vs MKR saline group; #P < 0.05, ##P < 0.01 vs FVB saline group.

