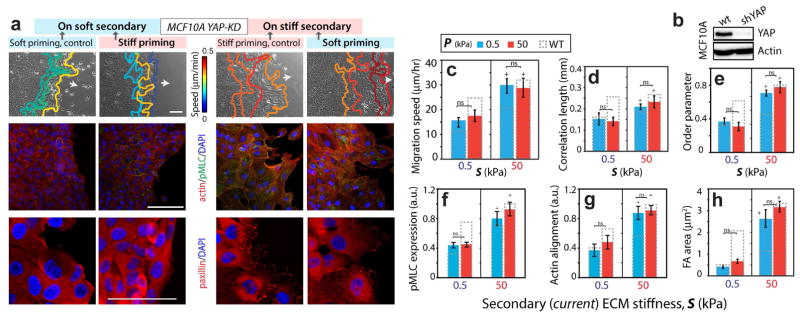
Figure 7. Memory-independent collective migration of YAP-depleted MCF10A cells.
(a) Leading edge tracks of monolayer of YAP-depleted MCF10A cells are plotted at 3 h interval during their post-priming migration on secondary ECMs. Immunofluorescent staining for F-actin (red), pMLC (green), paxillin (red), and DAPI (blue). Scale bars = 100 μm. (b) MCF10A cells expressing either shSCRM (wt) or shYAP RNAi were lysed and subjected to Western blotting with anti-YAP and anti-Actin antibodies. Average (c) leading edge migration speed, (d) correlation length, and (e) order parameter, N>15, and normalized (f) pMLC expression and (g) actin alignment, N>40, and (h) FA area, N>20, for varying ECM configurations. Columns with dashed outline represent corresponding values for wildtype MCF10A cells. Horizontal brackets denote statistical significance (p<0.05). ns=no significant difference. Error bars = SEM.

