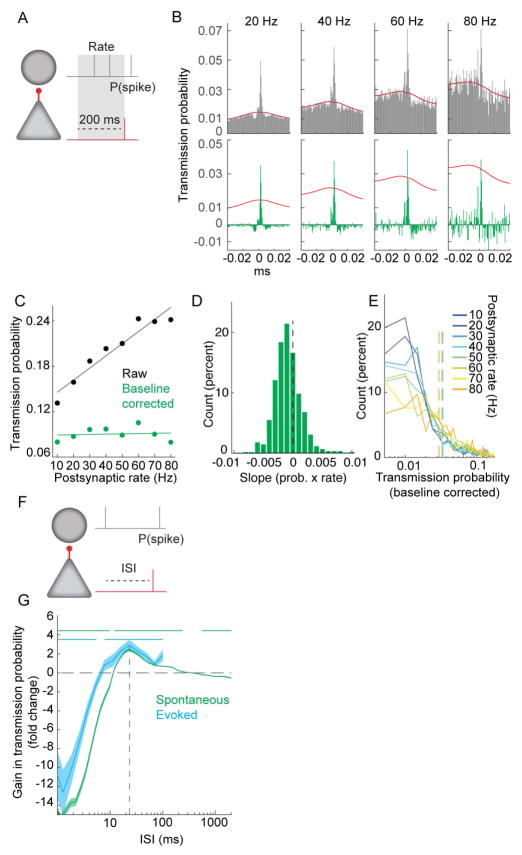
Figure 7. Postsynaptic interneuron spike timing affects spike transmission more than rate.
A. Schematic of analysis for B–E, examining effect of postsynaptic rate on transmission probability. B. Top. CCGs from an example pair for which the firing rate of the postsynaptic neuron during the preceding 200 ms was 10 – 80 Hz. Bottom. Same as in B, but with baseline correction applied. Red lines are baseline (see Methods). C. Transmission probability versus postsynaptic rate for the example pair in B. D. Distribution of baseline corrected slopes (as shown in C) for the population (sign test, p = 7.0−8, N = 621). E. Distribution of baseline corrected transmission probabilities at each postsynaptic rate for all neurons (N = 621). Vertical dashed lines are mean transmission probability for that postsynaptic rate. F. Schematic of analysis for assessing the effect of the interval of the last postsynaptic spike prior to the presynaptic spike on the transmission probability. G. Gain in transmission probability at different ISIs for postsynaptic spikes preceding the presynaptic spike for spontaneous (green) and optogenetically induced postsynaptic spikes (blue; N = 2 PV::ChR2 mice). Horizontal lines denote significant difference from zero Wilcoxon paired sign test p< 0.00125. Dashed line at 24 ms denotes the ISI with the greatest boost in transmission efficacy. Shaded area is SEM.

