Abstract
Tissue specific stem cells are indispensable contributors to adult tissue maintenance, repair, and regeneration. In skeletal muscle, satellite cells (SCs) are the resident muscle stem cell population and are required to maintain skeletal muscle homeostasis throughout life. Increasing evidence suggests that SCs are a heterogeneous cell population with substantial biochemical and functional diversity. A major limitation in the field is an incomplete understanding of the nature and extent of this cellular heterogeneity. Single cell analyses are well suited to addressing this issue, especially when coupled to unbiased profiling paradigms such as high throughout RNA sequencing. We performed single cell RNA sequencing (scRNA-seq) on freshly isolated muscle satellite cells and found a surprising degree of heterogeneity at multiple levels, from muscle-specific transcripts to the broader SC transcriptome. We leveraged several comparative bioinformatics techniques and found that individual SCs enrich for unique transcript clusters. We propose that these gene expression “fingerprints” may contribute to observed functional SC diversity. Overall, these studies underscore the importance of several established SC signaling pathways/processes on a single cell level, implicate novel regulators of SC heterogeneity, and lay the groundwork for further investigation into SC heterogeneity in health and disease.
Keywords: single cell, transcriptome, scRNA-seq, satellite cell, muscle stem cell, heterogeneity
1. Introduction
Satellite cells (SCs) are tissue specific stem cells located between the myofiber sarcolemma and the basal lamina. This cell population supports postnatal skeletal muscle growth and adult skeletal muscle maintenance, hypertrophy and regeneration. Satellite cell loss or functional impairment results in regeneration deficits following skeletal muscle injury (Murphy et al., 2011; Fry et al., 2015), blunted muscle hypertrophy (Egner et al., 2016), and diminished skeletal muscle function (Jackson et al., 2015). Normally, satellite cells exit quiescence in response to activation/injury, proliferate extensively as myoblasts, differentiate, and fuse into existing myofibers or with each other to form myotubes that eventually mature into myofibers. Additionally, a subset of skeletal muscle SCs undergoes self-renewal to maintain the stem cell pool for future activation/regenerative requirements. Importantly, the total number of satellite cells remains relatively constant over time, excluding pathological insults or advanced age. This implies that satellite cell self-renewal is a tightly regulated process. How satellite cells balance self-renewal capacity with an ability to differentiate is a long-standing question in the muscle stem cell field and has significant implications for stem cell-focused regenerative medicine.
Recent findings suggest that satellite cells exist as a functionally heterogeneous population with variable capacities to activate, divide, and self-renew (Kuang et al., 2007; Tanaka et al., 2009; Rocheteau et al., 2012; Chapman et al., 2013). In adult muscle, SCs are characterized by expression of the paired homeobox transcription factor Pax7, which is one of the best molecular markers of this adult stem cell population. Within the Pax7+ SC population, however, expression of other myogenic factors is heterogeneous. For example, the myogenic basic helix-loop-helix (bHLH) transcription factors MyoD and Myf5 can mark SC subsets with differing activation and self-renewal potential (Olguin and Olwin, 2004; Zammit et al., 2004; Kuang et al., 2007). Cell surface markers can further stratify Pax7+ SCs and include Syndecan-3/4 (Cornelison et al., 2001), a7-integrin (Gnocchi et al., 2009), CD34 (Beauchamp et al., 2000), M-cadherin (Beauchamp et al., 2000), c-met (Allen et al., 1995; Wozniak et al., 2003), and VCAM-1 (Maesner et al., 2016). Despite a wealth of knowledge about these SC markers and how they individually contribute to differences in SC function, little is known regarding the full extent of transcriptional diversity between individual SCs.
High content molecular analyses of single skeletal muscle SCs are limited. In one study, several SC activation states were defined based on combinatorial expression of a small (~6–7) myogenic factor subset from manually isolated SCs (Cornelison and Wold, 1997). Microfludic advancements subsequently permitted direct isolation of single myofiber associated SCs and concomitant cell surface marker (<10) profiling (Chapman et al., 2013). In a recent development, proteomics-based technology (CyTOF) adapted to single cells identified previously unrecognized SC sub-populations during SC activation based on novel cell surface marker (CD9, CD104) expression (Porpiglia et al., 2017). In the present study, we use single cell RNA-sequencing (scRNA-seq) to study the transcriptional diversity of freshly isolated skeletal muscle satellite cells. Leveraging the unbiased nature of sequencing-based transcriptomics, we report extensive transcriptional heterogeneity between individual SCs and identify cell-specific expression “fingerprints” that may provide insight into the functional diversity of this essential adult stem cell population.
2. Results and Discussion
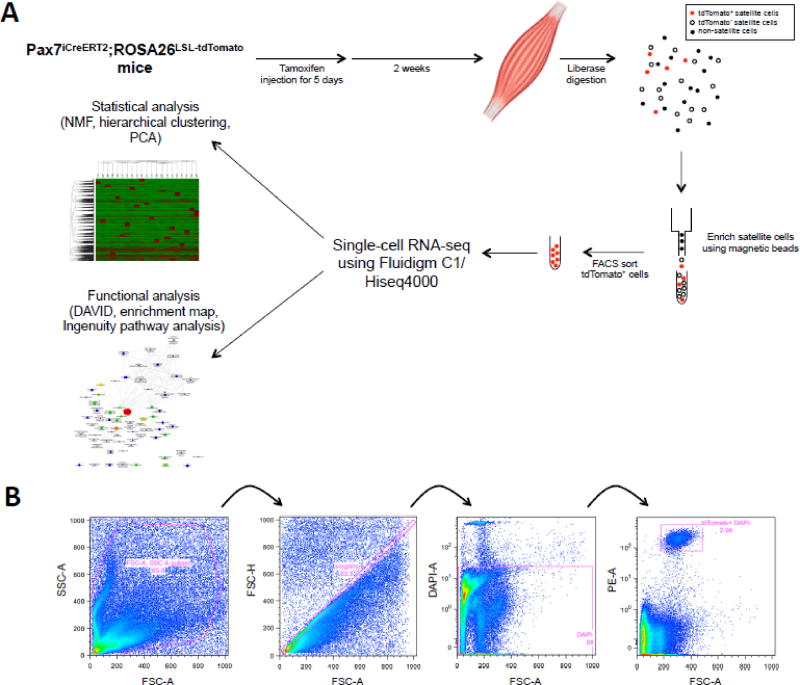
Muscle satellite cells (SCs) exhibit substantial molecular, functional, and overall phenotypic heterogeneity (Pavlath et al., 1998; Rocheteau et al., 2012; Collins et al., 2005). Given the role of transcriptional regulation of population heterogeneity in other cell types (Janich et al., 2011; Janich et al., 2013; Treutlein et al., 2014; Kumar et al., 2014), we sought to explore the underpinnings of SC functional heterogeneity by performing single-cell transcriptomic analyses of purified, primary murine SCs. To facilitate rapid, antibody-free isolation of a pure SC population, we utilized a genetic, fluorescence-based lineage labeling strategy, whereby Pax7 positive SCs are indelibly marked with a red tdTomato fluoraphore upon tamoxifen-mediated Cre recombinase activation, and isolated labeled cells via flow cytometry (Figure 1). Importantly, this Pax7iCreERT2;ROSA26LSL-tdTomato model has been previously used to label, track, and analyze Pax7 positive SCs in vivo (Pawlikowski et al., 2015). Using a Fluidigm C1 cell capture platform, we successfully captured 40 viable single SCs, from which we able to generate 21 cDNA libraries for high-throughput RNA-sequencing analysis. We normalized sequencing data using the fragments per kilobase of transcript per million mapped reads (FPKM) method (Trapnell et al., 2010). For all subsequent analyses, we applied a stringent FPKM >5 threshold to ensure a low false discovery rate (Ramsköld et al., 2009).
Figure 1.
Preparation of Pax7-tdTomato+ cells from mice. (A) Experimental flowchart. Briefly, Pax7iCreERT2;ROSA26LSLtdTomato mice were injected with tamoxifen to label Pax7+ SCs. Single FACS isolated SCs were captured and subjected to RNA-sequencing. Comparative bioinformatics analyses were performed using single cell transcriptomes. (B) Gating strategy for isolation of Pax7-tdTomato+ SCs by flow cytometry.
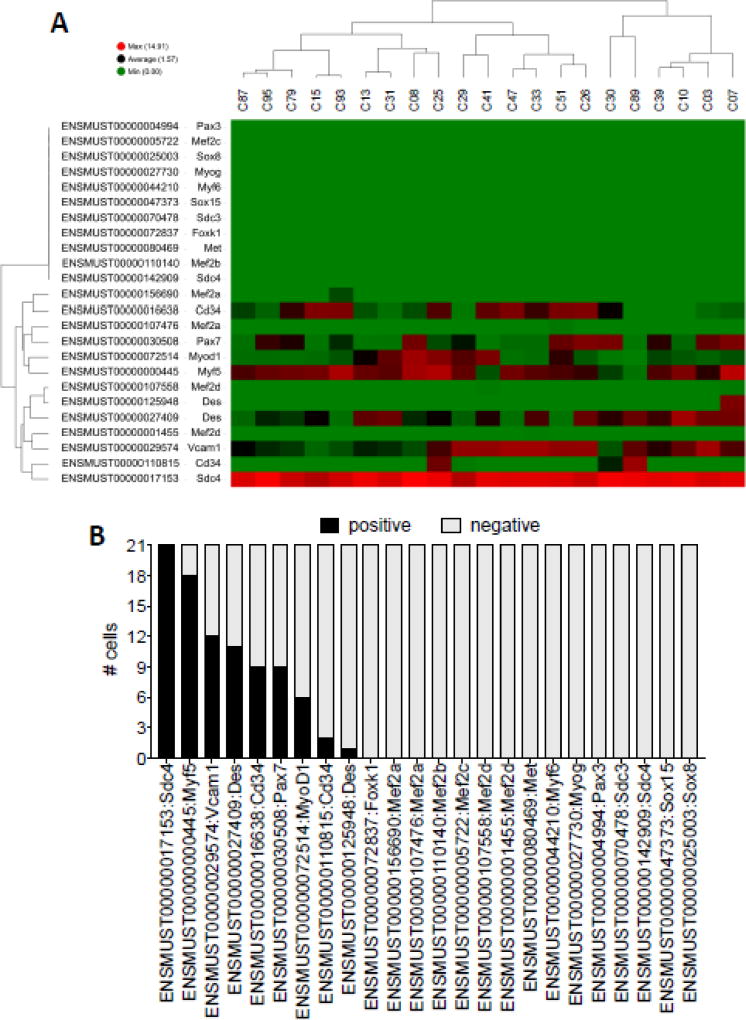
Visual inspection of 24 manually curated myogenic transcripts revealed several surprising findings. First, Pax7 expression was highly variable across individual cells (Figure 2A). This result suggests that although these labeled SCs once expressed Pax7 in order to remove the stop codon preventing expression of tdTomato, sustained Pax7 transcript expression may not be a continuous requirement throughout myogenesis. Importantly, 20/21 cells expressed Pax7, MyoD1, or Myf5 (or some combination thereof), thus confirming their myogenic identity (Figure 2A,B). The one cell (C89) in which we did not detect Pax7, MyoD1 or Myf5 expressed other markers reported as enriched in satellite cells, including Cd34, Vcam-1, and Syndecan-4 (Cornelison and Wold, 1997; Beauchamp et al., 2000; Cornelison et al., 2001; Fukada et al., 2007) (Figure 2A). Furthermore, C89 also expressed the transcript encoding for the muscle-specific protein Desmin, confirming that we exclusively captured and profiled myogenic cells.
Figure 2.
Selected myogenic gene expression signature across individual SCs. (A) Heatmap of selected myogenic transcripts. Transcripts are arranged top to bottom, and individual SCs clustered left to right. Green=lower expression, red=higher expression. (B) Bar graph depicting the number of single SCs positive and negative (FPKM cutoff=5) for the indicated myogenic transcript (x-axis).
The second notable finding was that 21/21 profiled cells expressed high levels of Syndecan-4 transcript (Figure 2A,B). Syndecan-4, a cell-surface transmembrane heparan sulfate proteoglycan (HSPG), is implicated in fibroblast growth factor (FGF) signaling (Zimmermann and David, 1999), satellite cell/muscle differentiation (Cornelison et al., 2001), and is required for normal satellite cell activation and muscle regeneration (Cornelison et al., 2004; Pisconti et al., 2012). Indeed, Syndecan-4 deficient SCs fail to respond appropriately to injury stimuli and cannot reconstitute injured muscle (Cornelison et al., 2004). High levels of Syndecan-4 thus underscore the fact that heparan sulfate/HSPG-mediated regulation of FGF signaling, particularly FGF-2, is a universally indispensable feature of satellite cell maintenance and myogenic progression (Rapraeger et al., 1991; Yayon et al., 1991). Lastly, our analyses of these 24 myogenic transcripts revealed that 0/21 SCs expressed the late myogenesis markers myogenin or Mef2-d (Figure 2A,B). This result was surprising given the two-week tamoxifen chase period preceding cell collection. These data suggest that SCs either a) progress through myogenesis and turn over infrequently, which is unlikely given the results of a recent study using the same Pax7iCreERT2.;ROSA26LSL-tdTomato model that reported incorporation of tdTomato (the result of SC fusion into myofibers) into ~20% of adult (>12 week old) hindlimb myofibers after an identical two-week chase period (Pawlikowski et al., 2015), b) exist in small enough numbers in non-injured muscle thereby eluding our analyses, or c) once fully activated in non-injury contexts in vivo, transit rapidly through later stages of myogenesis. Additional experiments, including analyses of a greater number of single SCs are needed to further test these hypotheses.
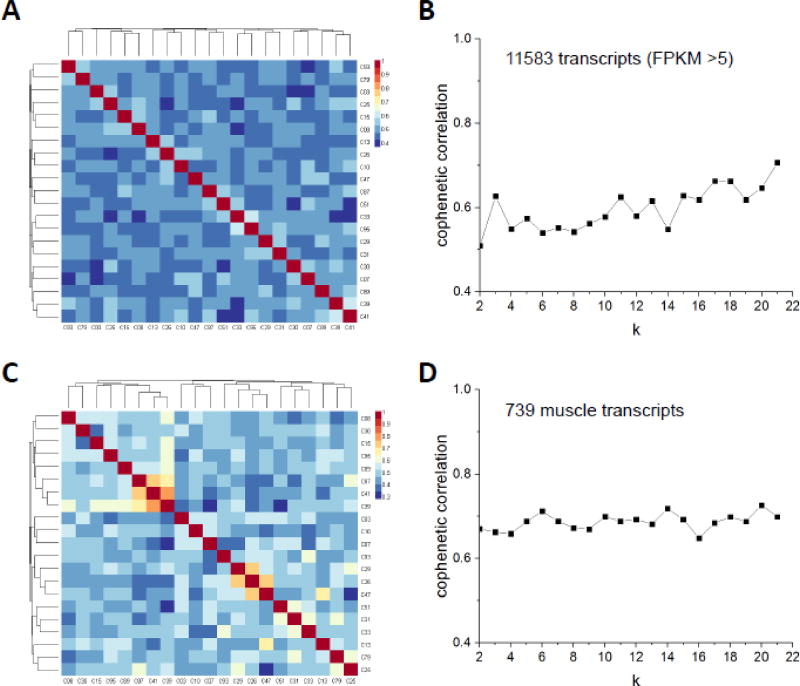
Bioinformatics techniques to evaluate transcriptome-wide single-cell RNA sequencing (scRNA-seq) data are continuously evolving. Unsupervised clustering methodologies, including K-means, hierarchical, and non-negative matrix factorization (NMF), are generally considered the most appropriate for analyzing scRNA-seq data, with NMF gaining popularity as a method best suited for accurately separating similar groups (Zhu et al., 2017). We therefore used NMF to evaluate potential transcriptional heterogeneity in our scRNA-seq dataset. Our initial analysis included 11583 transcripts utilizing a FPKM >5 in at least one sample/cell cutoff (Figure 3A, Supplementary Figure S1). A major consideration when using NMF is the optimal cluster number or “k” that best fits the data. The cophenetic correlation coefficient is a widely accepted criterion for defining the most appropriate cluster number in NMF analyses (Brunet et al., 2004), where the objective is to elucidate the “k” associated with the highest cophenetic correlation coefficient (ranging from 0–1). We calculated the cophenetic correlation coefficient from k=2 to k=21 and did not observe any iterations where this value exceeded 0.7 (Figure 3A,B). These data indicate that based on global transcript expression, our SCs do not fall into well-defined clusters, underscoring the unique nature of each profiled SC.
Figure 3.
Nonnegative matrix factorization (NMF) analyses on single-cell transcriptomes of Pax7-tdTomato+ cells. (A) NMF was performed on 11583 transcripts with an FPKM intensity greater than 5 in at least one sample. Shown are the results using k=2. (B) A line graph depicting cophenetic correlation coefficients calculated from k=2 to k=21. (C) NMF result using 739 muscle related transcripts with k =2. (D) A line graph depicting cophenetic correlation coefficients from k=2 to k=21 for NMF on 739 muscle related transcripts.
Although NMF is reported to be less prone to the influence of scRNA-seq “noise” and thus able to detect gene groups that differentiate single cell subpopulations (Zhu et al., 2017), we next asked whether a focused gene set would be better suited as an input to detect SC heterogeneity using NMF. Using a set of 739 muscle-related transcripts, we observed higher overall cophenetic correlation coefficient values, yet distinct clusters still failed to emerge (Figure 3C,D, Supplementary Figure S2). Together with the unbiased NMF dataset, we interpret this result to mean that single SCs exhibit sufficient transcriptional heterogeneity to preclude robust clustering analyses. Assuming that we sampled a random SC cohort, our data therefore suggest that SCs may exist along an activation continuum in vivo, as opposed to transitioning from one discrete cell state to another. We do, however, acknowledge that a greater number of SCs is needed to rigorously test this hypothesis. Furthermore, our data only represent basal (uninjured) SC activation dynamics in adult mice (Pawlikowski et al., 2015; Keefe et al., 2015) and do not represent injury, age, or disease-associated cell/tissue activation states.
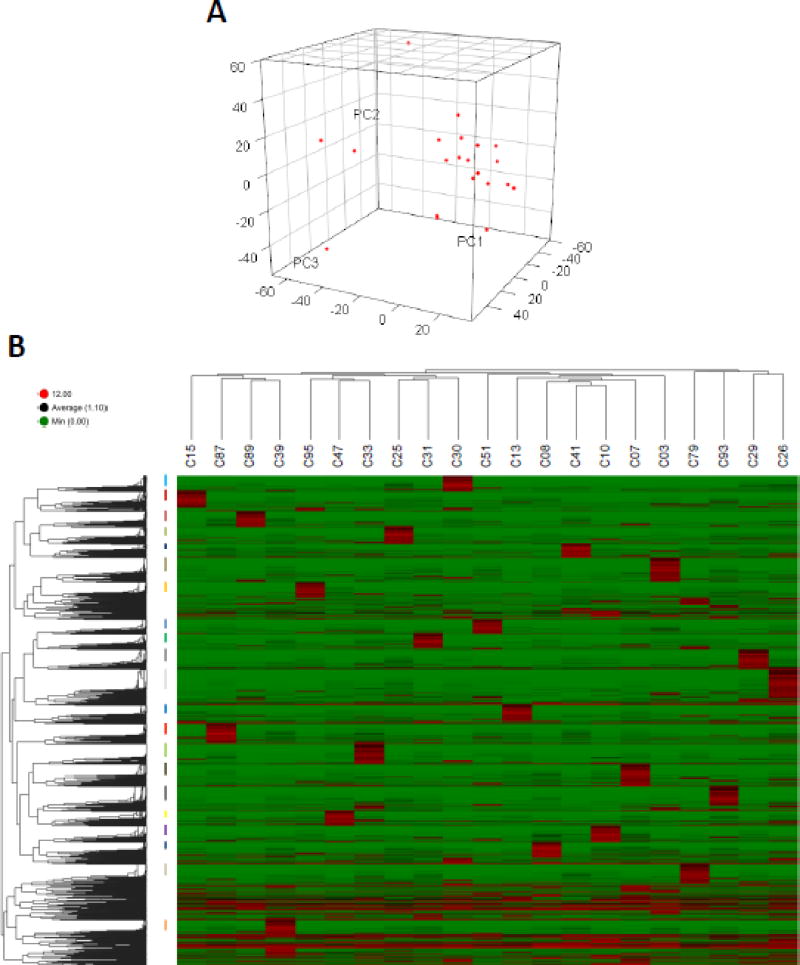
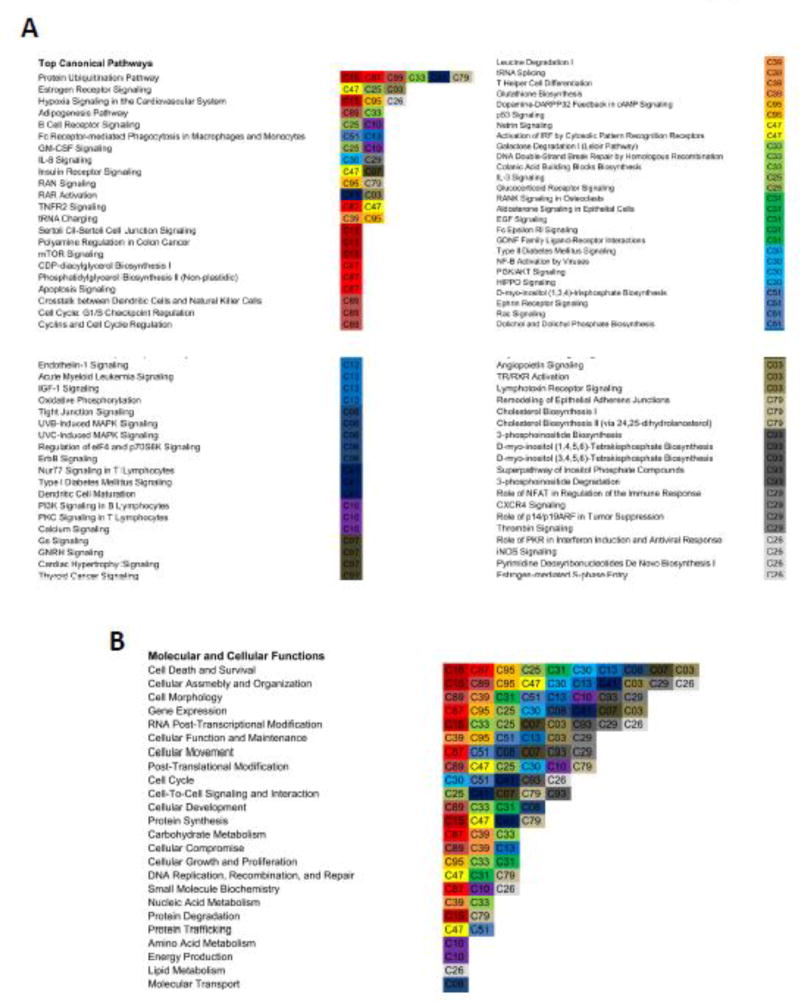
Hierarchical clustering and principal component analyses (PCA) can not only identify similarly behaving samples, but can also reveal how samples are uniquely dissimilar from each other. PCA of our scRNA-seq data corroborated the NMF analyses and revealed little similarity between individual SCs (Figure 4A). Interestingly, when we performed hierarchical clustering analyses, while we saw little statistical connection between individual cells (dendrogram, Figure 4B), we observed distinct enriched transcript clusters unique to individual SCs (colored bars, Figure 4B, Supplementary Figure S3). We then performed gene ontology (GO) analyses on the enriched transcript clusters for each cell and compiled these data to identify any potential functional overlap between single cell clusters (Figure 5, Supplementary Figure S4). In an effort to mitigate the effect of individual pathways/processes being errantly enriched in a given cell due to single cell sequencing “noise”, we took the top 5 enriched pathways in each cell for aggregate pathway analyses of our entire single cell dataset. “Canonical pathways” analyses yielded several noteworthy observations. First, “protein ubiquitination” enriched in 6/21 SCs and was the most common enriched canonical pathway in our dataset (Figure 5A). While protein ubiqutination is most frequently associated with skeletal muscle atrophy and muscle protein breakdown in mature myofibers, several studies suggest that ubiquitination plays an important role in stem/progenitor cell biology, including regulation of c-fos in osteoclast progenitors (Ito et al., 2005) and the let-7/Lin-41 axis in embryonic stem cells (Rybak et al., 2009). Additionally, a recent study highlighted the relevance of protein ubiquitination in SCs by showing that Pax7 protein levels are directly regulated by the ubiquitin-ligase Nedd4 (Bustos et al., 2015).
Figure 4.
Unsupervised hierarchical clustering of single-cell transcriptomes of Pax7-tdTomato+ cells. (A) Principal component analysis of single SCs. (B) Unsupervised hierarchical clustering was performed on individual SCs (top dendrogram) and on transcripts (dendrogram to the left). Log2 FPKM values are represented in a colored heatmap (green=lower expression, red=higher expression). Clusters of genes exclusively highly expressed in each sample are labeled with colored bars to the left of the heatmap.
Figure 5.
Gene ontology (GO) analyses. Transcripts exclusively highly expressed in each cell were subjected to GO analyses. The top 5 functional classes for each cell were identified and compiled for all 21 SCs. (A) A diagram depicting the number and identity of each cell associated with a given “canonical pathway” GO term. (B) A diagram depicting the number and identity of each cell associated with a given “molecular and cellular function” GO term.
Second, the majority of the enriched “canonical pathways” were not shared between SCs, but were rather unique to each SC (Figure 5A), an observation that, on its own, could reflect single cell transcriptional noise. Closer examination of individual pathways, however, pointed to broader underlying commonalities only evident when looking at the aggregated data. For example, within the top 10 consensus pathways identified, “estrogen receptor signaling” (C47, C25, C03), “interleukin-8 signaling” (C30, C29), and “insulin receptor signaling” (C47, C07) all converge on two main signal transduction pathways: MEK/ERK and PI3K/AKT, both of which are established myogenic regulatory pathways (Jones et al., 2005; Schiaffino and Mammucari, 2011). One interpretation of this observation is that in uninjured muscle, multiple individual inputs are required to fully engage a particular signal transduction pathway and drive myogenic progression. A requirement for multiple independent stimuli to activate key pathways could have evolved in order to limit precocious activation in the absence of injury, thus enforcing population heterogeneity based on how individual cells sense, integrate, and respond to extracellular cues.
We next queried “molecular and cellular function” terms and noted several emerging themes in our data. First was the enrichment of several macromolecule metabolism processes, including “carbohydrate metabolism” (C87, C39, C33), “nucleic acid metabolism” (C39, C33), “amino acid metabolism” (C10), and “lipid metabolism” (C26) (Figure 5B). Mounting evidence suggests that SC activation and myogenic progression involves transitioning metabolic states, including mitochondria remodeling and fuel source shifts (Csete et al., 2001; Liu et al., 2012; Cerletti et al., 2012; Ryall et al., 2015). That individual cells can up-regulate distinct metabolic pathways raises several possibilities. First, SC subpopulations may exist that are metabolically poised to activate and respond to certain stimuli. Along those lines, a given metabolic state may also limit erroneous activation. Such a mechanism driving population heterogeneity could be advantageous in skeletal muscle where a precise response to diverse activation stimuli is required. Alternatively, a spectrum of metabolic states could simply reflect an activation continuum, whereby cellular metabolism defines states of activation competency. At a minimum, our data reveal distinct transcriptional signatures that point to substantial metabolic heterogeneity within the SC population.
In addition to metabolic pathways, the second notable observation from the molecular and cellular function GO analysis was that 8/21 SCs had “RNA post-transcriptional modification” as one of the top 5 enriched processes (Figure 5B). Recent reports suggest that RNA post-transcriptional dynamics control the SC quiescence-to-activation switch by regulating 1) RNA stability via RNA decay and stabilizing proteins (Farina et al., 2012; Hausburg et al., 2015), 2) microRNA-mediated RNA stability (Cheung et al., 2012; Farina et al., 2012), and 3) mRNA translation control (Crist et al., 2012; Cheung et al., 2012). Our finding that over one-third of our single cells enrich for transcripts associated with RNA post-transcriptional modification supports the hypothesis that RNA homeostasis is a significant regulator of SC identity and function.
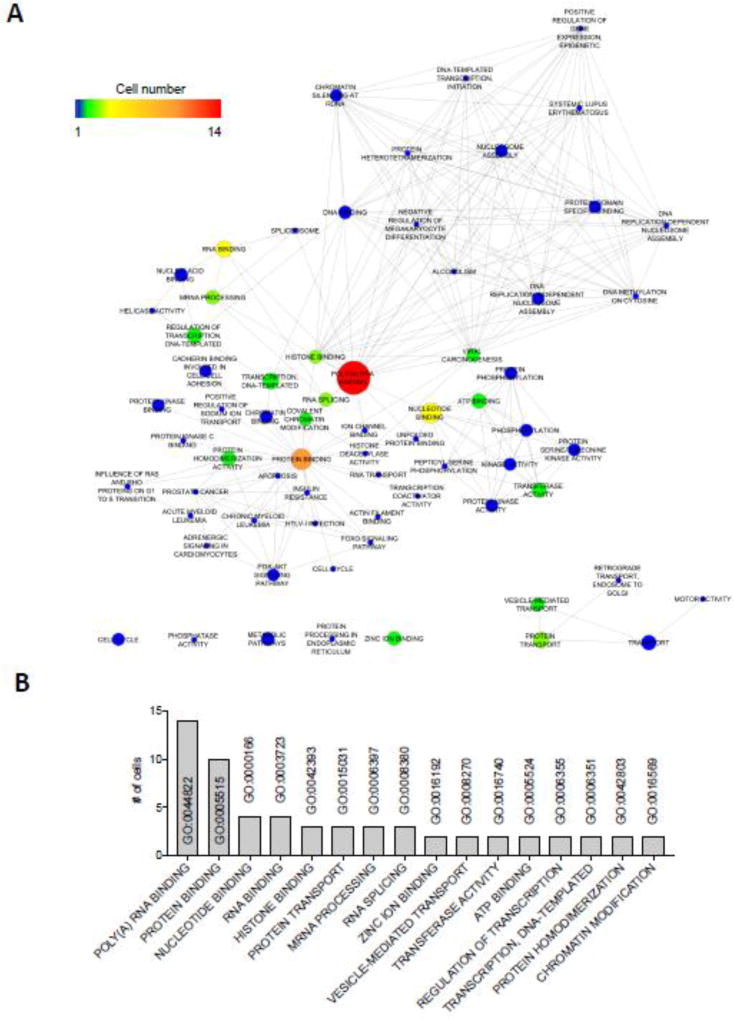
To complement our individual GO analyses, we next applied a network-based gene set enrichment and visualization approach to our single cell dataset (Merico et al., 2010). This approach permitted 1) identification of functional pathways statistically over-represented in each cell, 2) organization of these pathways into a visual network, where each gene set was represented as a node and edges represent gene overlap between the gene sets, 3) grouping of these nodes into network clusters, and 4) integration of these networks into a single enrichment map for the entire SC dataset. Using functional annotation results from DAVID (Database for Annotation, Visualization and Integrated Discovery) analyses as source data, we identified “Poly(A) RNA binding” (14 cells) as the largest and most overrepresented network node (gene cluster) in our 21 cell transcript network (Figure 6, Supplementary Figure S5). Strikingly, processes related to RNA processing and/or stability occupied 5 of the top 10 overrepresented network nodes (Figure 6B). Considered along with the individual cell GO analyses, these data highlight the importance of RNA homeostasis, or “ribostasis”, as a regulator of SC biology and function.
Figure 6.
Enrichment map based on the genes exclusively expressed in individual SCs. (A) Cytoscape enrichment map created using DAVID functional annotation results on the genes exclusively expressed in each cell. Color scale represents the number of cells associated with each node. Node size represents the total number of genes that contribute to each node. See Supplementary Figure S5 for the enrichment map associated with each individual SC. (B) Graph depicting the number of SCs enriching for the indicated GO annotation.
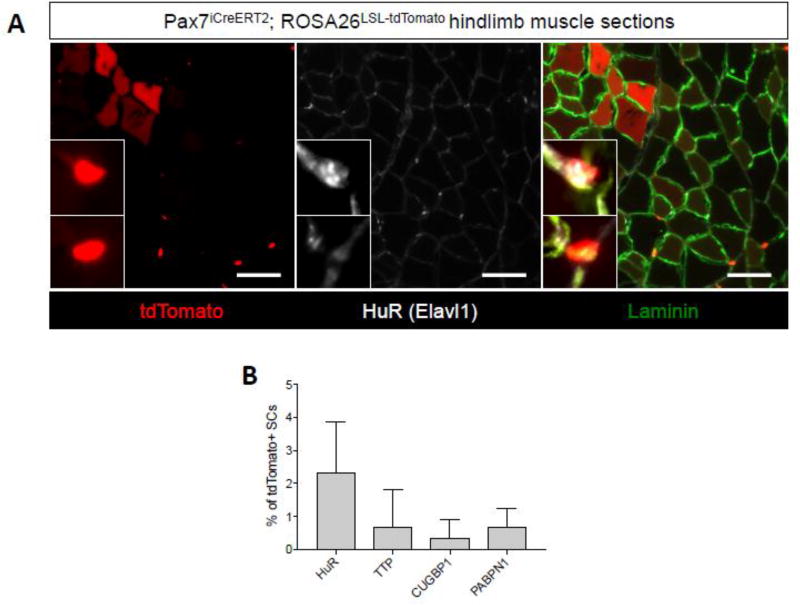
Given the prominent enrichment of RNA regulatory pathways using two independent pathway analysis strategies, we next evaluated the expression patterns of well-known RNA binding proteins (RNABPs) in Pax7+/tdTomato+ skeletal muscle SCs. We stained fresh frozen Pax7iCreERT2;ROSA26LSL-tdTomato tibilais anterior muscle sections with antibodies targeting several RNABPs including HuR (Elavl1), TTP (Zfp36), Celf1 (CUGBP1), and PABPN1. Overall, we detected variably low numbers of cells (<5%) staining positive for each RNABP, observations consistent with heterogeneous RNA biology-associated transcript expression in profiled SCs (Figure 7). In light of recent reports implicating mRNA post-transcriptional gene regulation in SC activation (Crist et al., 2012; Cheung et al., 2012; Hausburg et al., 2015; Zismanov et al., 2015), it is tempting to speculate that heterogeneous SC activation is regulated at the level of mRNA stability or by other post-transcriptional gene regulatory mechanisms such as translation control. Further work, including single cell studies of in vivo activated SCs, is needed to determine the extent to which RNA regulation contributes to SC maintenance and muscle regeneration.
Figure 7.
Heterogeneous RNA binding protein expression in muscle SCs. (A) Representative immunofluorescence images of TA muscle tissue sections from tamoxifen treated Pax7iCreERT2;ROSA26LSL-tdTomato mice stained with an antibody targeting HuR (white). Laminin is shown in green, nuclei are labeled with DAPI (blue) and tdTomato fluorescence is shown in red. Insets are of a tdTomato+::HuR+ cell (top inset) and a tdTomato+::HuR- cell (bottom inset) (B) A graph quantifying the percent positive cells for each indicated RNABP as a fraction of tdTomato+ SCs. Error bars represent SD from n=3 mice.
2.1 Conclusions
Using single cell, sequencing-based gene expression analyses, we demonstrate substantial transcript heterogeneity within the uninjured skeletal muscle SC compartment. Multiple clustering analyses failed to group SCs into clear “clusters” or “sub-populations” suggesting that uninjured SCs may exist along an activation continuum with ill-defined boundaries. We identified several established SC-associated processes/pathways including protein ubiquitination, RNA regulation, and metabolism as potential contributors to SC heterogeneity. Importantly, we acknowledge several study limitations and highlight corresponding opportunities for future work. First, we only analyze the full transcriptome of 21 FACS isolated SCs. Additional analyses of SC heterogeneity using techniques capable of economically profiling hundreds or thousands of single cells (ie. DROP-seq) are likely needed to fully appreciate the cellular heterogeneity of adult muscle SCs. Second, FACS isolation is an inherently disruptive process that could result in transcriptional, activation-associated artifacts. Laser capture microdissection of SCs isolated from flash-frozen skeletal muscle or SC fixation in situ followed by cell isolation and RNA-sequencing are two alternative strategies that could better preserve uninjured SC transcriptional integrity. Despite these limitations, this exploratory study lays the groundwork for future studies aiming to query SC heterogeneity in diverse physiological contexts including muscle development, regeneration, pathology (including muscular dystrophy and cachexia), and aging.
3. Methods
3.1 Preparation of Pax7-tdTomato+ cells
All animal experiments in this study were performed under protocols approved by the Institutional Animal Care and Use Committee at Mayo Clinic. 3–4 month old Pax7iCreERT2;ROSA26LSL-tdTomato mice were used for isolation of Pax7-tdTomato+cells. Pax7iCreERT2;ROSA26LSL-tdTomato mice were injected with 2 mg tamoxifen dissolved in corn oil (Sigma-Aldrich) via intraperitoneal injections for 5 consecutive days. After 2 weeks of final tamoxifen injection, the mice were euthanized, and hindlimb muscles were dissected immediately. The muscle tissues were digested using 0.1 mg/mL liberase (Roche) in 37°C for 90 min and filtered through 100 urn, 70 urn, and 40 urn cell strainer, consecutively. Satellite cells were then enriched using the Satellite Cell Isolation Kit (Miltenyi Biotec) according to the manufacturer’s protocol. The cells were mixed with DAPI at final concentration of 1 ug/mL for viable cell staining. Single SCs (tdTomato-positive and DAPI-negative) were sorted and isolated by flow cytometry in the Mayo Clinic Microscopy Cell Analysis and Flow Cytometry Core Facility.
3.2 Single cell RNA-seq and data processing
Single sorted Pax7-tdTomato+ cells were captured using a Fluidigm C1 capture platform, followed by cDNA library preparation using Nextera XT DNA Library Preparation Kit (lllumina). cDNA libraries were sequenced with paired-end 101 bp reads by HiSeq 4000. All single cell capture, cDNA library preparation, and sequencing was performed in collaboration with the Mayo Clinic Medical Genome Facility (Rochester, MN, USA). Sequencing reads were aligned via TopHat (Kim et al., 2013) to the Mus musculus genome, mm10. Expression intensities were then calculated using Cufflinks (Trapnell et al., 2010), and were represented by fragments per kilobase of transcript per million mapped reads (FPKM).
3.3 RNA-seq data analysis
Transcripts with FPKM intensities greater than 5 in at least one sample were log2 transformed and used for subsequent analyses. Hierarchical clustering was performed using TIBCO Spotfire software. Clusters were formed by complete linkage clustering, and distances were measured by correlation. Sets of transcripts that were exclusively expressed in each cell were defined as clustered transcripts where their measured correlation was greater than 0.8 and that their FPKM intensities were negligible in all other cells. Principal component analysis (PCA) was done on top 400 variant genes using SINGuLAR analysis toolset (Fluidigm). Functional annotation was performed using DAVID (https://david.ncifcrf.gov/). Annotation results from gene ontology for biological process, molecular function, and pathways were used to create a cytoscape enrichment map (Merico et al., 2010). Nonnegative matrix factorization (NMF) analyses (Brunet et al., 2004) were performed using NMF package in R software. Muscle-related genes used for NMF analysis were obtained from Gene Ontology Consortium (http://www.geneontology.org/). Additional pathway analysis and functional analysis were performed using Ingenuity Pathway Analysis (QIAGEN).
3.4 Immunostaining
Tissue sections (8–10um) were post-fixed in 4% paraformaldehyde for 5 minutes at room temperature prior to immunostaining. Fixed tissue sections were permeabilized with 0.5% Triton-X100 in PBS followed by blocking with 3% BSA in PBS. Primary antibody incubations occurred at RT for 90 minutes or overnight at 4 degrees followed by incubation with secondary antibody at RT for 30 minutes in 3% BSA in PBS. The following antibodies were used in this study: HuR (Santa Cruz, sc-5261), TTP (Santa Cruz, sc-8458), CUGBP1 (Santa Cruz, sc-20003), PABPN1 (Abcam, ab75855), and Laminin (Sigma 4HB-2). Secondary antibodies were all Alexa fluorescent conjugates (488, 555, or 647) from Invitrogen or Jackson ImmunoResearch.
Supplementary Material
Highlights.
Single cell analyses of skeletal muscle satellite cells (SCs) reveals substantial variability in muscle transcript expression
Non-negative matrix factorization (NMF) analyses fail to reveal robust SC subpopulations
Unsupervised hierarchical clustering analyses uncover unique transcript clusters in individual SCs
RNA regulatory pathways may play a important role in SC homeostasis
Acknowledgments
The authors wish to thank members of the Doles lab for helpful discussions and manuscript suggestions. J.D. is supported by NIH/NIAMS R00AR66696, Mayo Clinic start-up funds, and a Career Development Award from the Mayo Clinic SPORE in Pancreatic Cancer (NIH/NCI CA102701).
Abbreviations list
- SC
satellite cell
- scRNA-seq
single cell RNA sequencing
- FPKM
fragments per kilobase of transcript per million mapped reads
- HSPG
heparan sulfate proteoglycan
- NMF
non-negative matrix factorization
- PCA
principal component analysis
- RNABP
RNA binding protein
Footnotes
Publisher's Disclaimer: This is a PDF file of an unedited manuscript that has been accepted for publication. As a service to our customers we are providing this early version of the manuscript. The manuscript will undergo copyediting, typesetting, and review of the resulting proof before it is published in its final citable form. Please note that during the production process errors may be discovered which could affect the content, and all legal disclaimers that apply to the journal pertain.
References
- Allen RE, Sheehan SM, Taylor RG, Kendall TL, Rice GM. Hepatocyte growth factor activates quiescent skeletal muscle satellite cells in vitro. J Cell Physiol. 1995;165:307–312. doi: 10.1002/jcp.1041650211. [DOI] [PubMed] [Google Scholar]
- Beauchamp JR, Heslop L, Yu DS, Tajbakhsh S, Kelly RG, Wernig A, Buckingham ME, Partridge TA, Zammit PS. Expression of CD34 and Myf5 defines the majority of quiescent adult skeletal muscle satellite cells. J Cell Biol. 2000;151:1221–234. doi: 10.1083/jcb.151.6.1221. [DOI] [PMC free article] [PubMed] [Google Scholar]
- Brunet JP, Tamayo P, Golub TR, Mesirov JP. Metagenes and molecular pattern discovery using matrix factorization. Proc Natl Acad Sci U S A. 2004;101:4164–69. doi: 10.1073/pnas.0308531101. [DOI] [PMC free article] [PubMed] [Google Scholar]
- Bustos F, de la Vega E, Cabezas F, Thompson J, Cornelison DD, Olwin BB, Yates JR, Olguín HC. NEDD4 Regulates PAX7 Levels Promoting Activation of the Differentiation Program in Skeletal Muscle Precursors. Stem Cells. 2015;33:3138–151. doi: 10.1002/stem.2125. [DOI] [PMC free article] [PubMed] [Google Scholar]
- Cerletti M, Jang YC, Finley LW, Haigis MC, Wagers AJ. Short-term calorie restriction enhances skeletal muscle stem cell function. Cell Stem Cell. 2012;10:515–19. doi: 10.1016/j.stem.2012.04.002. [DOI] [PMC free article] [PubMed] [Google Scholar]
- Chapman MR, Balakrishnan KR, Li J, Conboy MJ, Huang H, Mohanty SK, Jabart E, Hack J, Conboy IM, Sohn LL. Sorting single satellite cells from individual myofibers reveals heterogeneity in cell-surface markers and myogenic capacity. Integr Biol (Camb) 2013;5:692–702. doi: 10.1039/c3ib20290a. [DOI] [PMC free article] [PubMed] [Google Scholar]
- Cheung TH, Quach NL, Charville GW, Liu L, Park L, Edalati A, Yoo B, Hoang P, Rando TA. Maintenance of muscle stem-cell quiescence by microRNA-489. Nature. 2012;482:524–28. doi: 10.1038/nature10834. [DOI] [PMC free article] [PubMed] [Google Scholar]
- Collins CA, Olsen I, Zammit PS, Heslop L, Petrie A, Partridge TA, Morgan JE. Stem cell function, self-renewal, and behavioral heterogeneity of cells from the adult muscle satellite cell niche. Cell. 2005;122:289–301. doi: 10.1016/j.cell.2005.05.010. [DOI] [PubMed] [Google Scholar]
- Cornelison DD, Wold BJ. Single-cell analysis of regulatory gene expression in quiescent and activated mouse skeletal muscle satellite cells. Dev Biol. 1997;191:270–283. doi: 10.1006/dbio.1997.8721. [DOI] [PubMed] [Google Scholar]
- Cornelison DD, Filla MS, Stanley HM, Rapraeger AC, Olwin BB. Syndecan-3 and syndecan-4 specifically mark skeletal muscle satellite cells and are implicated in satellite cell maintenance and muscle regeneration. Dev Biol. 2001;239:79–94. doi: 10.1006/dbio.2001.0416. [DOI] [PubMed] [Google Scholar]
- Cornelison DD, Wilcox-Adelman SA, Goetinck PF, Rauvala H, Rapraeger AC, Olwin BB. Essential and separable roles for Syndecan-3 and Syndecan-4 in skeletal muscle development and regeneration. Genes Dev. 2004;18:2231–36. doi: 10.1101/gad.1214204. [DOI] [PMC free article] [PubMed] [Google Scholar]
- Crist CG, Montarras D, Buckingham M. Muscle satellite cells are primed for myogenesis but maintain quiescence with sequestration of Myf5 mRNA targeted by microRNA-31 in mRNP granules. Cell Stem Cell. 2012;11:118–126. doi: 10.1016/j.stem.2012.03.011. [DOI] [PubMed] [Google Scholar]
- Csete M, Walikonis J, Slawny N, Wei Y, Korsnes S, Doyle JC, Wold B. Oxygen-mediated regulation of skeletal muscle satellite cell proliferation and adipogenesis in culture. J Cell Physiol. 2001;189:189–196. doi: 10.1002/jcp.10016. [DOI] [PubMed] [Google Scholar]
- Egner IM, Bruusgaard JC, Gundersen K. Satellite cell depletion prevents fiber hypertrophy in skeletal muscle. Development. 2016;143:2898–2906. doi: 10.1242/dev.134411. [DOI] [PubMed] [Google Scholar]
- Farina NH, Hausburg M, Dalla Betta N, Pulliam C, Srivastava D, Cornelison DDW, Olwin BB. A role for RNA post-transcriptional regulation in satellite cell activation. Skelet Muscle. 2012;2:21. doi: 10.1186/2044-5040-2-21. [DOI] [PMC free article] [PubMed] [Google Scholar]
- Fry CS, Lee JD, Mula J, Kirby TJ, Jackson JR, Liu F, Yang L, Mendias CL, Dupont-Versteegden EE, et al. Inducible depletion of satellite cells in adult, sedentary mice impairs muscle regenerative capacity without affecting sarcopenia. Nat Med. 2015;21:76–80. doi: 10.1038/nm.3710. [DOI] [PMC free article] [PubMed] [Google Scholar]
- Fukada S, Uezumi A, Ikemoto M, Masuda S, Segawa M, Tanimura N, Yamamoto H, Miyagoe-Suzuki Y, Takeda S. Molecular signature of quiescent satellite cells in adult skeletal muscle. Stem Cells. 2007;25:2448–459. doi: 10.1634/stemcells.2007-0019. [DOI] [PubMed] [Google Scholar]
- Gnocchi VF, White RB, Ono Y, Ellis JA, Zammit PS. Further characterisation of the molecular signature of quiescent and activated mouse muscle satellite cells. PLoS One. 2009;4:e5205. doi: 10.1371/journal.pone.0005205. [DOI] [PMC free article] [PubMed] [Google Scholar]
- Hausburg MA, Doles JD, Clement SL, Cadwallader AB, Hall MN, Blackshear PJ, Lykke-Andersen J, Olwin BB. Post-transcriptional regulation of satellite cell quiescence by TTP-mediated mRNA decay. Elife. 2015;4 doi: 10.7554/eLife.03390. [DOI] [PMC free article] [PubMed] [Google Scholar]
- Ito Y, Inoue D, Kido S, Matsumoto T. c-Fos degradation by the ubiquitin-proteasome proteolytic pathway in osteoclast progenitors. Bone. 2005;37:842–49. doi: 10.1016/j.bone.2005.04.030. [DOI] [PubMed] [Google Scholar]
- Jackson JR, Kirby TJ, Fry CS, Cooper RL, McCarthy JJ, Peterson CA, Dupont-Versteegden EE. Reduced voluntary running performance is associated with impaired coordination as a result of muscle satellite cell depletion in adult mice. Skelet Muscle. 2015;5:41. doi: 10.1186/s13395-015-0065-3. [DOI] [PMC free article] [PubMed] [Google Scholar]
- Janich P, Pascual G, Merlos-Suarez A, Batlle E, Ripperger J, Albrecht U, Cheng HY, Obrietan K, Di Croce L, Benitah SA. The circadian molecular clock creates epidermal stem cell heterogeneity. Nature. 2011;480:209–214. doi: 10.1038/nature10649. [DOI] [PubMed] [Google Scholar]
- Janich P, Toufighi K, Solanas G, Luis NM, Minkwitz S, Serrano L, Lehner B, Benitah SA. Human epidermal stem cell function is regulated by circadian oscillations. Cell Stem Cell. 2013;13:745–753. doi: 10.1016/j.stem.2013.09.004. [DOI] [PubMed] [Google Scholar]
- Jones NC, Tyner KJ, Nibarger L, Stanley HM, Cornelison DD, Fedorov YV, Olwin BB. The p38alpha/beta MAPK functions as a molecular switch to activate the quiescent satellite cell. J Cell Biol. 2005;169:105–116. doi: 10.1083/jcb.200408066. [DOI] [PMC free article] [PubMed] [Google Scholar]
- Keefe AC, Lawson JA, Flygare SD, Fox ZD, Colasanto MP, Mathew SJ, Yandell M, Kardon G. Muscle stem cells contribute to myofibres in sedentary adult mice. Nat Commun. 2015;14(6):7087. doi: 10.1038/ncomms8087. [DOI] [PMC free article] [PubMed] [Google Scholar]
- Kim HJ, Kim NC, Wang YD, Scarborough EA, Moore J, Diaz Z, MacLea KS, Freibaum B, Li S, et al. Mutations in prion-like domains in hnRNPA2B1 and hnRNPA1 cause multisystem proteinopathy and ALS. Nature. 2013;495:467–473. doi: 10.1038/nature11922. [DOI] [PMC free article] [PubMed] [Google Scholar]
- Kuang S, Kuroda K, Le Grand F, Rudnicki MA. Asymmetric self-renewal and commitment of satellite stem cells in muscle. Cell. 2007;129:999–1010. doi: 10.1016/j.cell.2007.03.044. [DOI] [PMC free article] [PubMed] [Google Scholar]
- Kumar RM, Cahan P, Shalek AK, Satija R, DaleyKeyser AJ, Li H, Zhang J, Pardee K, Gennert D, et al. Deconstructing transcriptional heterogeneity in pluripotent stem cells. Nature. 2014;516:56–61. doi: 10.1038/nature13920. [DOI] [PMC free article] [PubMed] [Google Scholar]
- Liu W, Wen Y, Bi P, Lai X, Liu XS, Liu X, Kuang S. Hypoxia promotes satellite cell self-renewal and enhances the efficiency of myoblast transplantation. Development. 2012;139:2857–865. doi: 10.1242/dev.079665. [DOI] [PMC free article] [PubMed] [Google Scholar]
- Maesner CC, Almada AE, Wagers AJ. Established cell surface markers efficiently isolate highly overlapping populations of skeletal muscle satellite cells by fluorescence-activated cell sorting. Skelet Muscle. 2016;6:35. doi: 10.1186/s13395-016-0106-6. [DOI] [PMC free article] [PubMed] [Google Scholar]
- Merico D, Isserlin R, Stueker O, Emili A, Bader GD. Enrichment map: a network-based method for gene-set enrichment visualization and interpretation. PLoS One. 2010;5:e13984. doi: 10.1371/journal.pone.0013984. [DOI] [PMC free article] [PubMed] [Google Scholar]
- Murphy MM, Lawson JA, Mathew SJ, Hutcheson DA, Kardon G. Satellite cells, connective tissue fibroblasts and their interactions are crucial for muscle regeneration. Development. 2011;138:3625–637. doi: 10.1242/dev.064162. [DOI] [PMC free article] [PubMed] [Google Scholar]
- Olguin HC, Olwin BB. Pax-7 up-regulation inhibits myogenesis and cell cycle progression in satellite cells: a potential mechanism for self-renewal. Dev Biol. 2004;275:375–388. doi: 10.1016/j.ydbio.2004.08.015. [DOI] [PMC free article] [PubMed] [Google Scholar]
- Pavlath GK, Thaloor D, Rando TA, Cheong M, English AW, Zheng B. Heterogeneity among muscle precursor cells in adult skeletal muscles with differing regenerative capacities. Dev Dyn. 1998;212:495–508. doi: 10.1002/(SICI)1097-0177(199808)212:4<495::AID-AJA3>3.0.CO;2-C. [DOI] [PubMed] [Google Scholar]
- Pawlikowski B, Pulliam C, Betta ND, Kardon G, Olwin BB. Pervasive satellite cell contribution to uninjured adult muscle fibers. Skelet Muscle. 2015;5:42. doi: 10.1186/s13395-015-0067-1. [DOI] [PMC free article] [PubMed] [Google Scholar]
- Pisconti A, Bernet JD, Olwin BB. Syndecans in skeletal muscle development, regeneration and homeostasis. Muscles Ligaments Tendons J. 2012;2:1–9. [PMC free article] [PubMed] [Google Scholar]
- Porpiglia E, Samusik N, Van Ho AT, Cosgrove BD, Mai T, Davis KL, Jager A, Nolan GP, Bendall SC, et al. High-resolution myogenic lineage mapping by single-cell mass cytometry. Nat Cell Biol. 2017;19:558–567. doi: 10.1038/ncb3507. [DOI] [PMC free article] [PubMed] [Google Scholar]
- Ramsköld D, Wang ET, Burge CB, Sandberg R. An abundance of ubiquitously expressed genes revealed by tissue transcriptome sequence data. PLoS Comput Biol. 2009;5:e1000598. doi: 10.1371/journal.pcbi.1000598. [DOI] [PMC free article] [PubMed] [Google Scholar]
- Rapraeger AC, Krufka A, Olwin BB. Requirement of heparan sulfate for bFGF-mediated fibroblast growth and myoblast differentiation. Science. 1991;252:1705–08. doi: 10.1126/science.1646484. [DOI] [PubMed] [Google Scholar]
- Rocheteau P, Gayraud-Morel B, Siegl-Cachedenier I, Blasco MA, Tajbakhsh S. A subpopulation of adult skeletal muscle stem cells retains all template DNA strands after cell division. Cell. 2012;148:112–125. doi: 10.1016/j.cell.2011.11.049. [DOI] [PubMed] [Google Scholar]
- Ryall JG, Dell’Orso S, Derfoul A, Juan A, Zare H, Feng X, Clermont D, Koulnis M, Gutierrez-Cruz G, et al. The NAD(+)-Dependent SIRT1 Deacetylase Translates a Metabolic Switch into Regulatory Epigenetics in Skeletal Muscle Stem Cells. Cell Stem Cell. 2015;16:171–183. doi: 10.1016/j.stem.2014.12.004. [DOI] [PMC free article] [PubMed] [Google Scholar]
- Rybak A, Fuchs H, Hadian K, Smirnova L, Wulczyn EA, Michel G, Nitsch R, Krappmann D, Wulczyn FG. The let-7 target gene mouse lin-41 is a stem cell specific E3 ubiquitin ligase for the miRNA pathway protein Ago2. Nat Cell Biol. 2009;11:1411–420. doi: 10.1038/ncb1987. [DOI] [PubMed] [Google Scholar]
- Schiaffino S, Mammucari C. Regulation of skeletal muscle growth by the IGF1-Akt/PKB pathway: insights from genetic models. Skelet Muscle. 2011;1:4. doi: 10.1186/2044-5040-1-4. [DOI] [PMC free article] [PubMed] [Google Scholar]
- Tanaka KK, Hall JK, Troy AA, Cornelison DD, Majka SM, Olwin BB. Syndecan-4-expressing muscle progenitor cells in the SP engraft as satellite cells during muscle regeneration. Cell Stem Cell. 2009;4:217–225. doi: 10.1016/j.stem.2009.01.016. [DOI] [PMC free article] [PubMed] [Google Scholar]
- Trapnell C, Williams BA, Pertea G, Mortazavi A, Kwan G, van Baren MJ, Salzberg SL, Wold BJ, Pachter L. Transcript assembly and quantification by RNA-Seq reveals unannotated transcripts and isoform switching during cell differentiation. Nat Biotechnol. 2010;28:511–15. doi: 10.1038/nbt.1621. [DOI] [PMC free article] [PubMed] [Google Scholar]
- Treutlein B, Brownfield DG, Wu AR, Neff NF, Mantalas GL, Espinoza FH, Desai TJ, Krasnow MA, Quake SR. Reconstructing lineage hierarchies of the distal lung epithelium using single-cell RNA-seq. Nature. 2014;509:371–75. doi: 10.1038/nature13173. [DOI] [PMC free article] [PubMed] [Google Scholar]
- Wozniak AC, Pilipowicz O, Yablonka-Reuveni Z, Greenway S, Craven S, Scott E, Anderson JE. C-Met expression and mechanical activation of satellite cells on cultured muscle fibers. J Histochem Cytochem. 2003;51:1437–445. doi: 10.1177/002215540305101104. [DOI] [PMC free article] [PubMed] [Google Scholar]
- Yayon A, Klagsbrun M, Esko JD, Leder P, Ornitz DM. Cell surface, heparin-like molecules are required for binding of basic fibroblast growth factor to its high affinity receptor. Cell. 1991;64:841–48. doi: 10.1016/0092-8674(91)90512-w. [DOI] [PubMed] [Google Scholar]
- Zammit PS, Carvajal JJ, Golding JP, Morgan JE, Summerbell D, Zolnerciks J, Partridge TA, Rigby PW, Beauchamp JR. Myf5 expression in satellite cells and spindles in adult muscle is controlled by separate genetic elements. Dev Biol. 2004;273:454–465. doi: 10.1016/j.ydbio.2004.05.038. [DOI] [PubMed] [Google Scholar]
- Zhu X, Ching T, Pan X, Weissman SM, Garmire L. Detecting heterogeneity in single-cell RNA-Seq data by non-negative matrix factorization. PeerJ. 2017;5:e2888. doi: 10.7717/peerj.2888. [DOI] [PMC free article] [PubMed] [Google Scholar]
- Zimmermann P, David G. The syndecans, tuners of transmembrane signaling. FASEB J. 1999;13(Suppl):S91–S100. doi: 10.1096/fasebj.13.9001.s91. [DOI] [PubMed] [Google Scholar]
- Zismanov V, Chichkov V, Colangelo V, Jamet S, Wang S, Syme A, Koromilas AE, Crist C. Phosphorylation of elF2α Is a Translational Control Mechanism Regulating Muscle Stem Cell Quiescence and Self-Renewal. Cell Stem Cell. 2015 doi: 10.1016/j.stem.2015.09.020. [DOI] [PubMed] [Google Scholar]
Associated Data
This section collects any data citations, data availability statements, or supplementary materials included in this article.


