

Abstract
Background
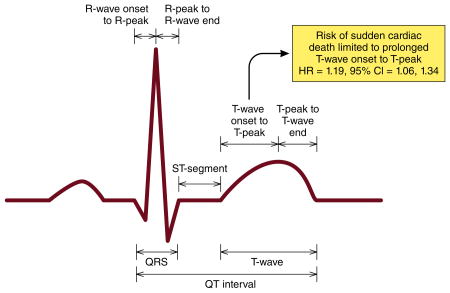
Several reports have demonstrated that prolongation of the QT interval is associated with sudden cardiac death (SCD). However, it is unknown whether any of the components within the QT interval are responsible for its association with SCD.
Methods and Results
We examined the association of the individual QT interval components (R-wave onset to R-peak, R-peak to R-wave end, ST-segment, T-wave onset to T-peak, and T-peak to T-wave end) with SCD in 12,241 participants (54 ± 5.7 years; 26% black; 55% women) from the Atherosclerosis Risk In Communities (ARIC) study. The QT interval and its components were measured at baseline (1987-1989) from 12-lead electrocardiograms. SCD cases were adjudicated by a group of physicians through December 31, 2012. Over a median follow-up of 23.6 years, a total of 346 cases of SCD were identified. While prolongation of the QT interval was associated with a 49% increased risk of SCD (HR=1.49, 95%CI=1.01, 2.18), only the T-wave onset to T-peak component (per 1-SD increase: HR=1.19, 95%CI=1.06, 1.34) was associated with SCD, and not any of the other components in separate models. When all of the QT interval components were included in the same model, T-wave onset to T-peak remained the strongest predictor of SCD (per 1-SD increase: HR=1.21, 95%CI=1.06, 1.37).
Conclusion
The risk of SCD with the QT interval is driven by prolongation of the T-wave onset to T-peak component. This suggests that shifting the focus from the overall QT interval to its individual components will refine SCD prediction in the community.
Keywords: QT interval, electrocardiography; sudden cardiac death; risk
Graphical Abstract
Introduction
The association between QT interval prolongation and sudden cardiac death (SCD) has been reported in several populations.1-3 Although the QT interval is traditionally used as a marker of ventricular repolarization, it encompasses phases 0-3 of the ventricular cardiac action potential, and involves both depolarizing and repolarizing currents.4, 5 Even within the repolarization components of the QT interval, regional differences in electrophysiological properties (e.g., repolarization heterogeneity) and prognostic significance have been reported.6 Accordingly, the precise component within the QT interval that is associated with SCD remains unclear.
To address this gap in knowledge, an in-depth examination of the association between the individual components of the QT interval and SCD is warranted to determine if the risk of SCD is triggered by abnormalities of ventricular depolarization or repolarization. A better understanding of the mechanistic association between the QT interval and SCD may guide the development of novel treatments and facilitate the implementation of effective prediction in individuals who are high risk for developing SCD. Therefore, we examined the association between the individual QT interval components and SCD in the Atherosclerosis Risk In Communities (ARIC) study.
Methods
Study Design and Population
The ARIC study prospectively enrolled 15,792 community-dwelling men and women between 45 and 64 years of age.7 Four field centers across the United States (Washington County, MD; Forsyth County, NC; Jackson, MS; suburban Minneapolis, MN) recruited participants between 1987 and 1989. Participants returned for 4 follow-up examinations (1990-1992, 1993-1995, 1996-1998, and 2011-2013), and continue to be followed via semi-annual telephone calls to ascertain study end points. Endpoints are further ascertained from examination of lists of hospital discharges that include any cardiovascular diagnoses from hospitals in the study communities. For this analysis, we excluded the following participants: 1) participants with major ventricular conduction abnormalities (e.g. complete left or right bundle branch blocks), pacemakers, Wolf-Parkinson–White Syndrome, QRS duration ≥120 ms or with extremes of absolute QT interval duration (>600 or <200 ms); 2) the few ARIC participants with race other than black or white; 3) participants with history of coronary heart disease or heart failure; 4) participants who reported the use of class I or III antiarrhythmic drugs at baseline or QT-prolonging medications. Similar to prior work in ARIC, the small number of black participants from Washington County and Minneapolis were excluded. Participants provided informed consent prior to enrollment, and this study was approved by the institutional review boards at each participating institution.
Baseline Characteristics
Age, sex, and race were self-reported. Tobacco use was defined as current or former cigarette smoking. Diabetes was defined as a fasting glucose level ≥126 mg/dL (or non-fasting glucose ≥200 mg/dL), a self-reported physician diagnosis of diabetes, or the use of diabetes medications. Systolic blood pressure was obtained from each participant using sphygmomanometers to measure 3 readings in the upright position after 5 minutes of rest. The average of the last 2 blood pressure measurements was used as the final reading. Antihypertensive medication use was self-reported. Body mass index was defined as the weight in kilograms divided by the square of the height in meters. Low-density lipoprotein (LDL) cholesterol levels were calculated indirectly using cholesterol values assayed from serum samples obtained at the baseline study visit. Left ventricular hypertrophy was defined by the Cornell criteria (R wave amplitude AVL plus S wave amplitude V3 ≥ 2.8 mV males and ≥ 2.0 mV females) using baseline electrocardiogram data.8
QT Interval Components
Digital 12-lead electrocardiograms (ECG) were obtained at baseline using MAC PC ECG machines (Marquette Electronics, Milwaukee, WI). ECG data were automatically processed in a central ECG laboratory, initially using the Dalhousie Novacode ECG program at the Epidemiology Coordinating and Research Centre (EPICORE) at the University of Alberta (Edmonton, Alberta, Canada), then with the GE Marquette 12-SL program (GE Marquette, Milwaukee, Wisconsin) at the Epidemiological Cardiology Research Center (EPICARE) at the Wake Forest School of Medicine (Winston-Salem, North Carolina, USA). Because of the automatic measurement, the repeatability of all ECG measures was 100%.9 In addition to the automatically calculated QT interval, the median value in all 12 leads for the following individual QT interval components were computed: R-wave onset to R-peak, R-peak to R-wave end, ST-segment, T-wave onset to T-peak, and T-peak to T-wave end. Each component was examined per 1-SD increase to provide comparability among different components. Heart rate was included as a covariate in all models to provide heart rate correction using a linear regression approach as recommended by current ECG guidelines.10 Prolonged QT interval was defined as ≥460 ms for women and ≥450 ms for men using a linear regression-based formula as recommended by the same guidelines,10 and hence we used, the Framingham formula (QT=QT + 0.154*(1-(60/heart rate))).11
Sudden Cardiac Death
The primary outcome of this analysis was physician-adjudicated SCD. The methods for ascertainment of SCD events have been described previously.12 Briefly, SCD was defined as a sudden pulseless condition presumed due to a ventricular tachyarrhythmia in a previously stable individual without evidence of a non-cardiac cause of cardiac arrest. All cardiac arrest events occurred out of the hospital or in an emergency room. To identify SCD cases, fatal cardiovascular death that occurred by December 31, 2012 were reviewed and adjudicated by a committee of electrophysiologists, general cardiologists, and internists in two phases. In the first phase, cardiovascular deaths occurring on or before December 31, 2001 were adjudicated by 5 physicians. In the second phase, cardiovascular deaths occurring between January 1, 2002 and December 31, 2012 were adjudicated by a committee of 11 physicians. All cases of fatal cardiovascular deaths that occurred out of the hospital or in an emergency room were reviewed. In the first phase, all in-hospital cardiovascular deaths also were reviewed. In the second phase, in-hospital deaths were reviewed only if cardiac arrest with cardiopulmonary resuscitation occurred prior to hospitalization. Available data from death certificates, informant interviews, physician questionnaires, coroner reports, prior medical history, and hospital discharge summaries were reviewed. Additionally, circumstances surrounding the event were used to classify cases of SCD. In both phases of SCD adjudication, each event was adjudicated independently by two physicians, and were classified as being definite SCD, possible SCD, definite non-SCD, and unclassifiable. If disagreement existed between the first two reviewers, a third reviewer independently reviewed the event to provide final classification. Cases of SCD included definite and probable cases through December 31, 2012.
Statistical Analysis
Baseline characteristics were compared between those who did and did not develop SCD. Categorical variables were reported as frequency and percentage while continuous variables were recorded as mean ± standard deviation. Differences between groups were tested using the chi-square method for categorical variables and the student's t-test for continuous variables. Follow-up time was defined as time between the baseline exam until SCD, death, loss to follow-up, or end of follow-up. Cox regression was used to examine the association between each QT interval component (per 1-standard deviation (SD) increase) and SCD, separately. Models were constructed as follows: Model 1 adjusted for age, sex, race, and heart rate; Model 2 adjusted for Model 1 covariates plus smoking, systolic blood pressure, diabetes, body mass index, LDL cholesterol, antihypertensive medication use, and left ventricular hypertrophy. We also examined the relationship of each component with SCD using a restricted cubic spline model with knots incorporated at the 5th, 50th, and 95th percentiles, separately.13 A likelihood ratio test was computed to test for linearity regarding the relationship between each QT interval component and SCD. Several sensitivity analyses were performed. A secondary analysis was performed for prolonged QT interval components (>95th percentile versus ≤95th percentile). The correlation of the QT interval and JT interval with T-wave onset to T-peak was examined using Pearson's coefficient (r). A separate analysis was performed using QT interval components computed from lead V5 in isolation. We performed a separate analysis with all QT interval components included in the same model to determine if each component retrained its prognostic significance independent of the other components. Additionally, due to the difficulty in measuring the onset of the T-wave, an analysis was performed using R-wave end to T-peak. In order to adjust for multiple hypothesis testing in the initial set of analyses evaluating the risk of SCD associated with each QT interval component treated as continuous variables, a Bonferroni correction was used corresponding to a p value for significance of 0.05/5 = 0.01. For the remaining analyses, 2-tailed p values < 0.05 were considered statistically significant. The test statistic of Grambsch and Therneau was used to check the proportional hazards assumption,14 and this was not violated in our analysis. SAS version 9.4 (Cary, NC) was used for all analyses.
Results
A total of 12,241 participants (54 ± 5.7 years; 26% black; 55% women) were included in this study. Baseline characteristics stratified by SCD are shown in Table 1. The mean QT interval for the entire cohort was 408 ± 27 ms (median=408 ms, 25th-75th percentiles=390-426). The distribution for the QT interval is shown in Figure 1.
Table 1. Baseline Characteristics (N=12,241).
| Characteristics | SCD (n=346) |
No SCD (n=11,895) |
P-value* |
|---|---|---|---|
| Age, mean (SD), years | 56 ± 5.7 | 54 ± 5.7 | <0.001 |
| Male (%) | 212 (61) | 5,248 (44) | <0.001 |
| Black (%) | 152 (44) | 3,025 (25) | <0.001 |
| Smoking (%) | 138 (40) | 3,051 (26) | <0.001 |
| Diabetes (%) | 86 (25) | 1,130 (10) | <0.001 |
| LDL cholesterol, mean (SD), mg/dL | 145 ± 40 | 137 ± 39 | <0.001 |
| Body mass index, mean (SD), kg/m2 | 29 ± 5.6 | 27 ± 5.2 | <0.001 |
| Systolic blood pressure, mean (SD), mm Hg | 132 ± 22 | 121 ± 18 | <0.001 |
| Antihypertensive medications (%) | 144 (42) | 2,864 (24) | <0.001 |
| Left ventricular hypertrophy (%) | 24 (7) | 321 (3) | <0.001 |
| Heart rate, mean ± SD, bpm | 68 ± 11 | 66 ± 10 | 0.049 |
| QT interval, mean ± SD, ms | 410 ± 30 | 408 ± 27 | 0.33 |
| R-wave onset to R-peak, mean ± SD, ms | 26 ± 5.0 | 25 ± 4.8 | 0.0013 |
| R-peak to R-wave end, mean ± SD, ms | 22 ± 10 | 22 ± 9.8 | 0.64 |
| ST-segment, mean ± SD, ms | 114 ± 19 | 115 ± 18 | 0.10 |
| T-wave onset to T-peak, mean ± SD, ms | 100 ± 23 | 100 ± 21 | 0.84 |
| T-peak to T-wave end, mean ± SD, ms | 96 ± 18 | 96 ± 16 | 0.98 |
Statistical significance for categorical data was tested using the chi-square procedure and continuous data was tested using the student's t-test.
bpm=beats per minute; LDL=low-density lipoprotein; SCD=sudden cardiac death; SD=standard deviation.
Figure 1. Distribution of QT interval.

Over a median follow-up of 23.6 years (25th-75th percentiles=20.4, 24.3), a total of 346 cases of SCD occurred (incidence rate per 1000 person-years=1.3, 95%CI=1.2, 1.5). While prolonged QT interval overall was associated a 49% increased risk of SCD (HR=1.49, 95%CI=1.01, 2.18; p=0.043), only T-wave onset to T-peak (per 1-SD increase: HR=1.19, 95%CI=1.06, 1.34; p=0.0028) was associated with an increased risk of SCD after multivariable adjustment (Table 2). Similar results were observed when we examined the risk of SCD associated with each QT interval component when it exceeded the 95th percentile of the distribution of that component. (Table 2). The QT interval (r=0.41, p<0.001) and JT interval (r=0.57, p<0.001) correlated with T-wave onset to T-peak.
Table 2. Risk of Sudden Cardiac Death associated with QT Interval Components (N=12,241).
| QT Interval Component | Model 1* HR (95%CI) |
P-value | Model 2† HR (95%CI) |
P-value | Model 3‡ HR (95%CI) |
P-value |
|---|---|---|---|---|---|---|
| R-wave onset to R-peak | ||||||
| Per 1-SD increase (5 ms) | 1.11 (1.001, 1.23) | 0.047 | 1.06 (0.96, 1.18) | 0.26 | 1.09 (0.98, 1.21) | 0.13 |
| >95th percentile (34 ms)§ | 1.10 (0.67, 1.79) | 0.70 | 1.04 (0.64, 1.70) | 0.88 | 1.07 (0.65, 1.75) | 0.79 |
| R-peak to R-wave end | ||||||
| Per 1-SD increase (10 ms) | 0.92 (0.83, 1.03) | 0.15 | 0.96 (0.86, 1.07) | 0.45 | 0.95 (0.85, 1.06) | 0.33 |
| >95th percentile (45 ms)§ | 0.74 (0.44, 1.24) | 0.25 | 0.77 (0.46, 1.31) | 0.34 | 0.77 (0.46, 1.31) | 0.34 |
| ST-segment duration | ||||||
| Per 1-SD increase (18 ms) | 1.14 (0.83, 1.57) | 0.41 | 1.02 (0.74, 1.42) | 0.90 | 1.13 (0.81, 1.57) | 0.48 |
| >95th percentile (146 ms)§ | 1.10 (0.63, 1.93) | 0.73 | 1.01 (0.58, 1.77) | 0.96 | 1.04 (0.59, 1.84) | 0.88 |
| T-wave onset to T-peak | ||||||
| Per 1-SD increase (22 ms) | 1.27 (1.13, 1.43) | <0.001 | 1.19 (1.06, 1.34) | 0.0028 | 1.21 (1.06, 1.37) | 0.0038 |
| >95th percentile (134 ms)§ | 1.63 (1.02, 2.61) | 0.043 | 1.37 (0.85, 2.20) | 0.19 | 1.36 (0.85, 2.19) | 0.20 |
| T-peak to T-wave end | ||||||
| Per 1-SD increase (16 ms) | 0.91 (0.81, 1.02) | 0.11 | 0.93 (0.83, 1.04) | 0.18 | 0.99 (0.88, 1.12) | 0.86 |
| >95th percentile (124 ms)§ | 0.99 (0.62, 1.60) | 0.99 | 0.92 (0.57, 1.49) | 0.74 | 0.92 (0.56, 1.50) | 0.73 |
Adjusted for age, sex, race, and heart rate.
Adjusted for Model 1 covariates plus smoking, systolic blood pressure, diabetes, body mass index, low-density lipoprotein cholesterol, antihypertensive medication use, and left ventricular hypertrophy.
Adjusted for Model 2 covariates and all QT interval components were included in the model simultaneously.
Reference group are values ≤95th percentile.
CI=confidence interval; HR=hazard ratio; SD=standard deviation.
The graphical representation of the risk of SCD across each QT interval component are depicted in Figures 2, 3, and 4. As shown, the risk of SCD did not vary across the QRS complex (R-wave onset to R-peak, R-peak to R-wave end; Figure 2) or ST segment (Figure 3). However, the risk of SCD was shown to increase across T-wave onset to T-peak values (Figure 4). T-wave onset to T-peak was the only component that demonstrated a linear relationship with SCD (likelihood ratio test for linearity, p=0.0028).
Figure 2. Risk of Sudden Cardiac Death across QRS duration*.

*Each hazard ratio was computed using a restricted cubic spline model with the median R-wave Onset to R-peak (A) value of 24 ms as the reference, and for R-peak to R-wave End (B), a median value of 18 ms was used as the reference. Models included the following; age, sex, race, heart rate, smoking, systolic blood pressure, diabetes, body mass index, low-density lipoprotein cholesterol, antihypertensive medication use, and left ventricular hypertrophy. Dotted-lines represent the 95% confidence interval.
Figure 3. Risk of Sudden Cardiac Death across ST-segment*.

*Each hazard ratio was computed using a restricted cubic spline model with the median ST-segment value of 114 ms as the reference, and was adjusted for age, sex, race, heart rate, smoking, systolic blood pressure, diabetes, body mass index, low-density lipoprotein cholesterol, antihypertensive medication use, and left ventricular hypertrophy. Dotted-lines represent the 95% confidence interval.
Figure 4. Risk of Sudden Cardiac Death across T-wave*.

*Each hazard ratio was computed using a restricted cubic spline model with the median T-wave Onset to T-peak Duration (A) value of 100 ms as the reference, and for T-peak to T-wave End (B), a median value of 96 ms was used as the reference. Models included the following; age, sex, race, heart rate, smoking, systolic blood pressure, diabetes, body mass index, low-density lipoprotein cholesterol, antihypertensive medication use, and left ventricular hypertrophy. Dotted-lines represent the 95% confidence interval.
The relationship between T-wave onset to T-peak (per 1-SD increase: HR=1.21, 95%CI=1.06, 1.37) and SCD did not depend on the other QT interval components when they were included in the same model (Table 2). Additionally, when we limited the analysis to lead V5, T-wave onset to T-peak (per 1-SD increase: HR=1.15, 95%CI=1.03, 1.27) was the only QT interval component associated with SCD (Supplemental Figure 1). Also, R-wave end to T-peak was associated with SCD (per 1-SD increase: HR=1.27, 95%CI=1.10, 1.46; >95th percentile (262 ms): HR=1.65, 95%CI=1.05, 2.61).
Discussion
In this analysis from ARIC, and similar to prior reports,1-3 prolonged QT interval was associated with an increased risk of SCD. However, we have demonstrated that this association is driven by prolongation of the T-wave onset to T-peak component. Overall, the findings in this report suggest that shifting the focus from the entire QT interval to its individual components will help further refine SCD risk prediction.
Although several studies examined the association between the QT interval and SCD,1-3 to our knowledge, only one report has attempted to determine if any of the QT interval components are associated with SCD in the community. A case-control study from the Oregon Sudden Unexpected Death Study found that T-peak to T-wave end was associated with SCD in persons with and without normal QRS duration.15 In contrast with the current study, we did not find an association with T-peak to T-wave end duration in persons with normal QRS duration. The portion of the T-wave associated with SCD was T-wave onset to T-peak. Explanations for the conflicting results possibly are related to variation in study design (e.g., case-control vs. prospective cohort), and the racially diverse study population of men and women in ARIC. Additionally, QT interval components were measured manually in the Oregon Sudden Unexpected Death Study, and automatically in the ARIC study. Nevertheless, the shared conclusion that could be derived from the Oregon Sudden Unexpected Death Study and the finding of the current report is that repolarization abnormalities (whether T-wave onset to T-peak or T-peak to T-wave end), rather than depolarization abnormalities, are more important markers of SCD risk in the general population. Additionally, the usefulness of the entire QT interval as a marker of increased SCD risk should be reconsidered.
The potential link between ventricular repolarization abnormalities in the general population and SCD remains unclear. Insights have been gained from genetic conditions, such as congenital long QT syndrome, in which these inherited channelopathies are associated with delayed ventricular repolarization due to lengthening of the ventricular action potential.16, 17 Subsequently, early afterdepolarizations generate premature action potentials that lead to fatal ventricular arrhythmias (e.g., polymorphic ventricular tachycardia and ventricular fibrillation). Although T-peak to T-wave end has been implicated as the time when ventricular cells are vulnerable to the occurrence of early afterdepolarizations and development of fatal ventricular arrhythmias,15 the data in this report suggest that prolongation of the T-wave onset to T-peak time is the more important marker of SCD risk. Other explanations are related to delayed epicardial repolarization in which vulnerability to early afterdepolarizations is present.5 This possibly is true for patients without genetic disorders that predispose to fatal ventricular arrhythmias, as abnormalities of T-peak to T-wave end have been associated with these events in persons with hypertrophic cardiomyopathy and congenital long QT syndrome.18, 19 This would suggest that T-peak to T-wave end is a more important marker of SCD risk in persons with the aforementioned inherited conditions, and T-wave onset to T-peak is a more important marker of SCD in the community. However, the hypothesis offered is purely speculative, and further research is needed to understand our findings.
The current analysis should be interpreted in the context of several limitations. Although the ECG measures used in this analysis are not routinely reported on a standard 12-lead tracing, these measures are easily obtained with excellent repeatability for clinical and research purposes.20 Several baseline characteristics were ascertained by self-reported history and potentially subjected our analyses to misclassification bias. Similarly, it is possible that some cases of SCD were missed despite rigorous attempts to identify all events. Additionally, we attempted to limit our analysis to persons who were free of conditions associated with inherent QT interval prolongation. However, it is possible that some participants were included due to incorrect classification of these conditions. Furthermore, although we included several covariates in our multivariable models that likely influenced the development of SCD, we acknowledge that residual confounding is possible. Despite these limitations, this is the first report addressing the contribution of the QT interval components to the risk of SCD in a large community-based population. The physician-adjudicated SCD methodology, long-term follow up, standardized ECG interpretation, and central automated reading at a core laboratory are just a few of the many strengths of our study.
In conclusion, the findings in this analysis demonstrate that the link between the QT interval and SCD is dependent on prolongation of the T-wave onset to T-peak component. This suggests that the focus on the entire QT interval regarding SCD risk should be reconsidered, as individual markers of abnormal repolarization could be useful in refining SCD risk prediction in the community. Further studies are needed to understand the underlying link between abnormal ventricular repolarization and SCD, and if these markers improve SCD risk prediction.
Supplementary Material
What is Known.
Prolongation of the QT interval has been associated with an increased risk for sudden cardiac death in several population-based cohort studies.
What the Study Adds.
Due to heterogeneity in QT interval components (R-wave onset to R-peak, R-peak to R-wave end, ST-segment, T-wave onset to T-peak, and T-peak to T-wave end), the risk of sudden cardiac death was examined for each QT interval component.
The findings of this analysis demonstrated that the association between the QT interval and sudden cardiac death is driven by prolongation of the T-wave onset to T-peak component.
These data provide a better understanding of the mechanistic link between the QT interval and sudden cardiac death, and possibly will improve the prediction of individuals who are high risk for sudden cardiac death in the community.
Acknowledgments
The authors thank the staff and participants of the ARIC study for their important contributions. Additionally, we would like to acknowledge the sudden cardiac death mortality classification committee members: Nona Sotoodehnia (lead), Selcuk Adabag, Sunil Agarwal, Lin Chen, Raj Deo, Leonard Ilkhanoff, Saman Nazarian, Ashleigh Owen, Kris Patton, and Larisa Tereschchenko.
Sources Of Funding: The Atherosclerosis Risk in Communities study is carried out as a collaborative study supported by National Heart, Lung, and Blood Institute contracts (HHSN268201100005C, HHSN268201100006C, HHSN268201100007C, HHSN268201100008C, HHSN268201100009C, HHSN268201100010C, HHSN268201100011C, and HHSN268201100012C). WTO is supported by the National Heart, Lung, And Blood Institute of the National Institutes of Health under award umber F32HL134290. The research reported in this report also was supported under award numbers R01HL116747 and R01HL111089 by the National Heart, Lung, And Blood Institute of the National Institutes of Health. The content is solely the responsibility of the authors and does not necessarily represent the official views of the National Heart, Lung, And Blood Institute or National Institutes of Health.
Footnotes
Discloures: None
References
- 1.Algra A, Tijssen JG, Roelandt JR, Pool J, Lubsen J. QTc prolongation measured by standard 12-lead electrocardiography is an independent risk factor for sudden death due to cardiac arrest. Circulation. 1991;83:1888–94. doi: 10.1161/01.cir.83.6.1888. [DOI] [PubMed] [Google Scholar]
- 2.Straus SM, Kors JA, De Bruin ML, van der Hooft CS, Hofman A, Heeringa J, Deckers JW, Kingma JH, Sturkenboom MC, Stricker BH, Witteman JC. Prolonged QTc interval and risk of sudden cardiac death in a population of older adults. J Am Coll Cardiol. 2006;47:362–7. doi: 10.1016/j.jacc.2005.08.067. [DOI] [PubMed] [Google Scholar]
- 3.Soliman EZ, Prineas RJ, Case LD, Russell G, Rosamond W, Rea T, Sotoodehnia N, Post WS, Siscovick D, Psaty BM, Burke GL. Electrocardiographic and clinical predictors separating atherosclerotic sudden cardiac death from incident coronary heart disease. Heart. 2011;97:1597–601. doi: 10.1136/hrt.2010.215871. [DOI] [PMC free article] [PubMed] [Google Scholar]
- 4.Priest BT, McDermott JS. Cardiac ion channels. Channels (Austin) 2015;9:352–9. doi: 10.1080/19336950.2015.1076597. [DOI] [PMC free article] [PubMed] [Google Scholar]
- 5.Yan GX, Antzelevitch C. Cellular basis for the normal T wave and the electrocardiographic manifestations of the long-QT syndrome. Circulation. 1998;98:1928–36. doi: 10.1161/01.cir.98.18.1928. [DOI] [PubMed] [Google Scholar]
- 6.Prenner SB, Shah SJ, Goldberger JJ, Sauer AJ. Repolarization Heterogeneity: Beyond the QT Interval. J Am Heart Assoc. 2016;5 doi: 10.1161/JAHA.116.003607. [DOI] [PMC free article] [PubMed] [Google Scholar]
- 7.The Atherosclerosis Risk in Communities (ARIC) Study: design and objectives. The ARIC investigators. Am J Epidemiol. 1989;129:687–702. [PubMed] [Google Scholar]
- 8.Devereux RB, Casale PN, Eisenberg RR, Miller DH, Kligfield P. Electrocardiographic detection of left ventricular hypertrophy using echocardiographic determination of left ventricular mass as the reference standard. Comparison of standard criteria, computer diagnosis and physician interpretation. J Am Coll Cardiol. 1984;3:82–7. doi: 10.1016/s0735-1097(84)80433-7. [DOI] [PubMed] [Google Scholar]
- 9.Soliman EZ, Prineas RJ, Case LD, Zhang ZM, Goff DC., Jr Ethnic distribution of ECG predictors of atrial fibrillation and its impact on understanding the ethnic distribution of ischemic stroke in the Atherosclerosis Risk in Communities (ARIC) study. Stroke. 2009;40:1204–11. doi: 10.1161/STROKEAHA.108.534735. [DOI] [PMC free article] [PubMed] [Google Scholar]
- 10.Rautaharju PM, Surawicz B, Gettes LS, Bailey JJ, Childers R, Deal BJ, Gorgels A, Hancock EW, Josephson M, Kligfield P, Kors JA, Macfarlane P, Mason JW, Mirvis DM, Okin P, Pahlm O, van Herpen G, Wagner GS, Wellens H American Heart Association E, Arrhythmias Committee CoCC, American College of Cardiology F, Heart Rhythm S. AHA/ACCF/HRS recommendations for the standardization and interpretation of the electrocardiogram: part IV: the ST segment, T and U waves, and the QT interval: a scientific statement from the American Heart Association Electrocardiography and Arrhythmias Committee, Council on Clinical Cardiology; the American College of Cardiology Foundation; and the Heart Rhythm Society. Endorsed by the International Society for Computerized Electrocardiology. J Am Coll Cardiol. 2009;53:982–91. doi: 10.1016/j.jacc.2008.12.014. [DOI] [PubMed] [Google Scholar]
- 11.Sagie A, Larson MG, Goldberg RJ, Bengtson JR, Levy D. An improved method for adjusting the QT interval for heart rate (the Framingham Heart Study) Am J Cardiol. 1992;70:797–801. doi: 10.1016/0002-9149(92)90562-d. [DOI] [PubMed] [Google Scholar]
- 12.Waks JW, Sitlani CM, Soliman EZ, Kabir M, Ghafoori E, Biggs ML, Henrikson CA, Sotoodehnia N, Biering-Sorensen T, Agarwal SK, Siscovick DS, Post WS, Solomon SD, Buxton AE, Josephson ME, Tereshchenko LG. Global Electric Heterogeneity Risk Score for Prediction of Sudden Cardiac Death in the General Population: The Atherosclerosis Risk in Communities (ARIC) and Cardiovascular Health (CHS) Studies. Circulation. 2016;133:2222–34. doi: 10.1161/CIRCULATIONAHA.116.021306. [DOI] [PMC free article] [PubMed] [Google Scholar]
- 13.Marrie RA, Dawson NV, Garland A. Quantile regression and restricted cubic splines are useful for exploring relationships between continuous variables. J Clin Epidemiol. 2009;62:511–7. doi: 10.1016/j.jclinepi.2008.05.015. [DOI] [PubMed] [Google Scholar]
- 14.Grambsch P, Therneau T. Proportional hazards tests and diagnostics based on weighted residuals. Biometrika. 1994;81:515–526. [Google Scholar]
- 15.Panikkath R, Reinier K, Uy-Evanado A, Teodorescu C, Hattenhauer J, Mariani R, Gunson K, Jui J, Chugh SS. Prolonged Tpeak-to-tend interval on the resting ECG is associated with increased risk of sudden cardiac death. Circ Arrhythm Electrophysiol. 2011;4:441–7. doi: 10.1161/CIRCEP.110.960658. [DOI] [PMC free article] [PubMed] [Google Scholar]
- 16.Ackerman MJ. The long QT syndrome: ion channel diseases of the heart. Mayo Clin Proc. 1998;73:250–69. doi: 10.4065/73.3.250. [DOI] [PubMed] [Google Scholar]
- 17.Moss AJ, Kass RS. Long QT syndrome: from channels to cardiac arrhythmias. J Clin Invest. 2005;115:2018–24. doi: 10.1172/JCI25537. [DOI] [PMC free article] [PubMed] [Google Scholar]
- 18.Shimizu M, Ino H, Okeie K, Yamaguchi M, Nagata M, Hayashi K, Itoh H, Iwaki T, Oe K, Konno T, Mabuchi H. T-peak to T-end interval may be a better predictor of high-risk patients with hypertrophic cardiomyopathy associated with a cardiac troponin I mutation than QT dispersion. Clin Cardiol. 2002;25:335–9. doi: 10.1002/clc.4950250706. [DOI] [PMC free article] [PubMed] [Google Scholar]
- 19.Yamaguchi M, Shimizu M, Ino H, Terai H, Uchiyama K, Oe K, Mabuchi T, Konno T, Kaneda T, Mabuchi H. T wave peak-to-end interval and QT dispersion in acquired long QT syndrome: a new index for arrhythmogenicity. Clin Sci (Lond) 2003;105:671–6. doi: 10.1042/CS20030010. [DOI] [PubMed] [Google Scholar]
- 20.Gellert KS, Rautaharju P, Snyder ML, Whitsel EA, Matsushita K, Heiss G, Soliman EZ. Short-term repeatability of electrocardiographic Tpeak-Tend and QT intervals. J Electrocardiol. 2014;47:356–61. doi: 10.1016/j.jelectrocard.2014.03.002. [DOI] [PMC free article] [PubMed] [Google Scholar]
Associated Data
This section collects any data citations, data availability statements, or supplementary materials included in this article.