

Abstract
Objectives
To describe change in balance confidence, and to identify associated factors and disabling consequences.
Method
Secondary analysis of 2 years of data collected from 272 older women enrolled in a randomized clinical trial of fall prevention. Balance confidence and disability measures were assessed at baseline, after the 12 week intervention, and at 1 and 2 years follow-up. Associated factors were measured at baseline.
Results
Balance confidence varied at baseline and decreased 5% over 2 years, but no variables predicted this decline. Baseline balance confidence was associated with poor physical function and mental health. Decreasing balance confidence was associated with increasing impairments in balance and hip flexion strength, increasing functional limitations in mobility and chair rises, reduced physical activity levels, increased activity restrictions, and decreasing social networks.
Discussion
Decreasing balance confidence plays an important role in disablement. More research is needed to identify predictors of decreasing balance confidence.
Keywords: fear of falling, balance confidence, disability, falls
Fear of falling has emerged as a significant health concern for older adults as it may contribute to falls and disability, two prevalent and costly gerontological health conditions. Fear of falling is common even among nonfallers with a prevalence of 30% to 57% for fallers, and 30% for nonfallers (Scheffer, Schuurmans, van Dijk, van der Hooft, & de Rooij, 2008). Estimated 2-year incidence rates for fear of falling range from 22% to 31% (Lach, 2005; Oh-Park, Xue, Holtzer, & Verghese, 2011). Older women report greater levels of fear of falling and more detrimental effects than men (Arfken, Lach, Birge, & Miller, 1994; Maki, Holliday, & Topper, 1991; McAuley, Mihalko, & Rosengren, 1997; Vellas, Wayne, Romero, Baumgartner, & Garry, 1997). In response to fear of falling, as many as 56% of older adults restrict their activities (Howland et al., 1998). This activity restriction may contribute to physical deconditioning and subsequent deterioration of gait, balance, and mobility, and thus consequently to functional, psychological, and social impairments, and increased levels of disability (Arfken et al., 1994; Cumming, Salkeld, Thomas, & Szonyi, 2000; Maki et al., 1991; McAuley et al., 1997). Fear of falling is associated with a lower quality of life, poor health status, increased psychological distress, depressed mood, and decreased social interaction culminating in an increased risk for nursing home placement (Arfken et al., 1994; Cumming et al., 2000; Howland et al., 1998; Howland et al., 1993; Lachman et al., 1998).
While evidence describing the impact of fear of falling is mounting, it is primarily based on cross-sectional research using multiple definitions of fear of falling. Balance confidence has been defined as a cognitive component of fear of falling where older adults subjectively estimate their ability to avoid a fall or maintain their balance (Hadjistavropoulos, Delbaere, & Fitzgerald, 2011). No studies to date have been published on how balance confidence changes over time, what factors are associated with this change, and how changes are associated with disabling consequences. To guide the selection of predictors and consequences of balance confidence for this study, the evidence from longitudinal studies with randomly selected samples on fear of falling was examined and summarized. Predictors of fear of falling onset that were identified in previous investigative work included older age, female gender, having a history of falling, self-reporting poor health, sedentary lifestyles, mobility limitations, lack of emotional support, obesity, polypharmacy, feeling unsteady, visual impairment, and stroke (Austin, Devine, Dick, Prince, & Bruce, 2007; S. M. Friedman, Munoz, West, Rubin, & Fried, 2002; Lach, 2005; Murphy, Dubin, & Gill, 2003; Oh-Park et al., 2011). Fear of falling consequences identified in previous work included declining physical function, lower activity levels, and limitations with instrumental and basic activities of daily living (Deshpande et al., 2008; Hadjistavropoulos et al., 2007; Mendes de Leon, Seeman, Baker, Richardson, & Tinetti, 1996). In one study, fear of falling was persistent in 28% of participants over 3 years, and 51% never reported fear of falling (Austin et al., 2007).
A better understanding of how balance confidence changes over time and its consequences would help in the design of interventions to reduce the morbidity associated with falls and disability. Therefore, the purpose of this study was to describe change in balance confidence over 2 years and to identify its predictors and associations with disability in a randomly selected sample of community-dwelling older women at risk for falling.
Using the disablement process model (DPM) as the study framework (Verbrugge & Jette, 1994), it was hypothesized that balance confidence was a complex intra-individual factor associated with increasing impairments in balance and leg strength; functional limitations with mobility and transferring; and disabilities in physical activity levels, activity restrictions, and social networks. Predisposing risk factors and pathologies were used to predict change in balance confidence. See Figure 1 for a graphical depiction of the study’s conceptual framework.
Figure 1.
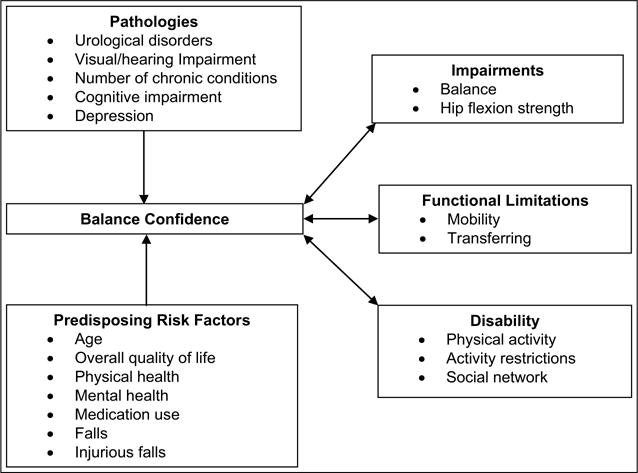
Study conceptual framework modified from the disablement process.
Method
Study Design
This study used 2 years of data collected during a randomized controlled single-blinded trial, the Fall Evaluation and Prevention Program (FEPP), a multifactorial fall prevention intervention including exercise, environmental modifications, and education (Wyman et al., 2007). Data were collected at baseline and post-intervention at 12-weeks, 1 and 2 years. After baseline assessments, participants were randomly assigned to a 12-week fall prevention treatment (n = 137) or health education control group (n = 135). Treatment group assignment did not have a statistically significant association with balance confidence baseline or change scores, so the two groups were combined for the analyses. The protocol was reviewed and approved by a university Institutional Review Board (IRB study number 0612E97849). All participants gave informed consent before data collection.
Study Sample
A sample of 272 community-dwelling women aged 70 years and older with increased fall risk was randomly selected from the population of Medicare beneficiaries living in the Twin Cities metropolitan area. To be included, participants had to be without significant cognitive impairment with a Mini-Mental State Examination (MMSE) score >23, reside outside a nursing home, be able to walk 30 feet without stopping with or without an assistive device, be able to understand and read English, and have a telephone. They also had to be at increased risk for falling by demonstrating postural instability on balance testing and having at least one of the following fall risk factors: orthostatic hypotension, low body mass index, falling in the past year, MMSE score 24–26, arthritis, stroke, two or more chronic illnesses, three or more prescription medications, or urge incontinence. Postural instability was present if participants failed a tandem walk test or if their Berg balance score was less than 45 (Berg, Wood-Dauphinee, Williams, & Maki, 1992). Participants were excluded if they had an artificial leg or leg brace; were involved in regular exercise for 3 or more days per week; had unstable health problems prohibiting safe, independent exercise; were terminally ill; or had poor corrected near visual acuity ≥ 20/70. There were 4,112 women assessed for eligibility, 41% did not respond to recruitment efforts, 29% were ineligible, 23% refused participation, and 7% enrolled in the study (Wyman et al., 2007).
Data Collection Procedures
All data were collected in the participants’ homes by the same research nurse practitioner who was blinded to group assignment. Participants self-administered the questionnaires and the nurse practitioner conducted a health history and physical exam, and administered performance-based tests.
Measures
Balance confidence was measured with the Activity-Specific Balance Confidence Scale (ABC), which includes 16 questions rating the degree of confidence participants have in not losing their balance or becoming unsteady during activities of daily living. All items were rated from 0 (no confidence) to 100 (complete confidence) and averaged to produce a total score ranging from 0 to 100, with higher scores indicating greater confidence. The measure has demonstrated high internal consistency (Cronbach’s α = .96), strong test– retest reliability (r = .92, p < .001), and good concurrent and discriminate validity (Powell & Myers, 1995).
Factors associated with change in balance confidence were categorized as predisposing risk factors and pathologies. Predisposing risk factors included demographic, quality of life, physical and mental health, medication use, and fall variables. Demographic variables included age, years of education completed, race, marital status, annual income level, and living arrangements. The Cantril Self-Anchoring Scale measured self-reported overall quality of life as a single item ranging from 0 (worst possible life) to 10 (best possible life) (Cantril, 1963). It has demonstrated good test–retest reliability and validity (McDowell & Newell, 1996). The Medical Outcomes Study 36-item Short Form Health Survey (SF-36) was used to measure different aspects of health. It includes eight subscales measuring overall general health, mental health, limitations in physical abilities, social activities, and usual role activities. The subscales include physical function, role physical, general health, vitality, social function, role emotional, mental health, and bodily pain. Subscale responses were transformed into the recommended standard score, ranging from 0 to 100, with higher scores indicating better self-reported health status (McHorney, Ware, & Raczek, 1993). The SF-36 has well documented reliability and validity (Ware, 1993). Multiple medication use was defined as using four or more prescription medications at least weekly. Falls and fall injuries occurring before and during study enrollment were measured. Falls and fall injuries occurring during the study were reported on monthly mailed fall calendars. Fall injuries were classified as serious, moderate, or mild. Serious injuries included (a) fracture and joint dislocations, (b) joint injuries other than dislocation (e.g., serious sprains, hemarthroses, or nonspecific joint injuries that result in hospitalization or decreased activity, (c) lacerations requiring suturing, (d) head injuries resulting in loss of consciousness and hospitalizations, and (e) internal injuries resulting in hospitalization. Moderate injuries included other soft tissue or joint injuries that resulted in seeking medical attention either through a physician’s office or emergency room, the use of x-rays or other diagnostic tests, and/or that resulted in restricted activity for at least 3 days. Mild fall injuries included abrasions, soft tissue injuries, and cut skin not requiring stitches for which no medical attention was sought. Falls occurring prior to study enrollment (called fall history) were reported as the number of falls incurred in the past year. Injurious falls occurring in the year prior to study enrollment (called injurious fall history) were reported as occurring or not.
Pathologies included the presence of urological disorders, visual and hearing impairments, number of chronic medical conditions, cognitive impairment, and depressive symptoms. Urological disorders included the following: urinary frequency, nocturia, and incontinence. Visual and hearing impairments included glaucoma, macular degeneration, vision loss not corrected by glasses, cataracts not corrected by surgery, vitrectomy, double vision, recent retinal bleed or detachment, severe hearing loss, and use of a hearing aid. Participants were asked if they had any of 11 cardiovascular, 12 neurological, 8 musculoskeletal, 3 endocrine, and 2 pulmonary chronic diseases, osteoporosis, anemia, and cancer. The number of chronic medical conditions was determined by counting the number of diseases reported. The MMSE measured cognitive impairment. Participants had to have a score of 23 or greater to be eligible. The maximum score is 30 with lower scores representing greater impairment. It was used as a continuous variable to determine if mild cognitive impairment was associated with balance confidence. The MMSE has consistently demonstrated good internal consistency, test–retest reliability, and validity in several studies over time (Tombaugh & McIntyre, 1992). Depression was measured with the Geriatric Depression Scale (short version), a reliable and valid self-administered questionnaire that includes 15 questions on affective characteristics of depression. Scores range from 0 to 15, with higher scores indicating greater depressed mood (Friedman, Heisel, & Delavan, 2005).
Consequences of poor balance confidence were defined as impairments, functional limitations, and disabilities according to the disablement process model. Impairments in balance and leg strength were measured. The Berg Balance Test (BBT) is a performance-based test where balance ability during 14 activities is rated from 0 (poor) to 4 (best). Scores are summed and the maximum score of 56 indicates optimal balance. It has strong inter-rater reliability (r = .88) and correlations with measures of spontaneous sway (r = −.55), the Tinetti Gait and Balance Test (r = .91), and Timed-Up and Go (TUG) scores (r = −.76) (Berg et al., 1992). Hip flexion strength was measured isometrically as force in pounds using a MICROFET-2 hand-held dynamometer (Hoggan Health Industries, Inc., Draper, UT). The average of three trials from the strongest leg was used and measurements were normalized for height and weight (Jaric, Mirkov, & Markovic, 2005).
Functional limitations with mobility and transferring were measured. The TUG test is a reliable and valid measure of functional mobility in older adults. It involves observing and timing (in seconds) participants as they rise from a standard armchair, walk 10 feet, turn, walk back, and sit down again. Shorter times indicate better mobility. It has strong inter-rater reliability (Intraclass correlation coefficient (ICC) = 0.99) and intra-rater reliability (ICC = 0.99), and is correlated with measures of balance, gait speed, and activities of daily living (Podsiadlo & Richardson, 1991). The repeated chair stands test measured functional limitations in getting out of a chair. It is scored as the number of seconds it takes participants to rise from a seated position without using their arms for five full stands as rapidly as possible. Longer times indicate greater functional limitations and it has demonstrated good intra- and inter-rater reliability (Csuka & McCarty, 1985, Ostchega et al., 2000).
Disability was measured with physical activity, activity restriction, and social network scales. The Physical Activity Scale for the Elderly (PASE) measured physical activity levels. Participants rated the amount of time spent doing 11 occupational, household, and leisure activities during a 1-week period. A weighted score was calculated for each activity by multiplying the frequency of engaging in the activity by the hours per day of activity. All item scores were summed for a total score. Higher scores indicate higher levels of activity. The PASE has exhibited good test–retest reliability (r = .75), adequate internal consistency (Cronbach’s α = .69), and good validity with other measures of fitness (Washburn, Smith, Jette, & Janney, 1993). The Survey of Activities and Fear of Falling in the Elderly (SAFE)–Activity Restriction Subscale measured activity restrictions. Respondents indicate whether or not they perform 11 daily activities, irrespective of fear of falling. One point was given for each activity performed. Scores range from 0 to 11, with lower numbers indicating increased activity restriction. It has acceptable internal consistency reliability (Cronbach’s α = .71) and validity (Lachman et al., 1998). The Lubben Social Network Scale measured social networks. This questionnaire contains 10 questions assessing the frequency of contact with family and friends and the presence of confidant and helping relationships. Each item is scored from 0 to 5 for a total score ranging from 0 to 50. Higher scores indicate larger social networks. It has been widely used in both research and clinical settings and has demonstrated relationships with several health indicators including mortality, all-cause hospitalization, physical health problems, depression, and other mental health problems (Lubben et al., 2006).
Statistical Analyses
Generalized linear mixed models (GLMM) for repeated measures (Fitzmaurice, Laird, & Ware, 2004) were used to describe change in balance confidence, impairment, functional limitation, and disability variables. These models estimate the mean baseline value, and rate and shape of change over time in the dependent variable. Analyses were performed using SAS, version 9.1 (SAS Institute, Inc., Cary, NC). The PROC MIXED procedure was used for normally distributed variables using random effects covariance matrixes. The PROC GENMOD procedure was used for non-normally distributed variables using the log link function and gamma distribution. Degrees of freedom were determined with the Kenward Rogers method (Fitzmaurice et al., 2004). Treatment group assignment was controlled for in all analyses.
Unconditional (no predictors) models were computed to describe change in balance confidence, impairments, functional limitations, and disability. Baseline variables were added to the model to identify predictors of balance confidence. Variables with a p < .05 in univariate models were entered into a multivariate model to identify independent predictors of balance confidence baseline and change estimates. Correlations between predictor variables were calculated to assess for potential collinearity.
Balance confidence (ABC score) was added as a dynamic predictor to the unconditional impairment, functional limitation, and disability models to identify consequences of change in balance confidence. Group assignment and age were added as control variables. If the sign of the estimate is positive, then as ABC scores decrease over time, so too does the dependent variable. If the sign is negative, then as ABC scores decrease over time, the dependent variable score increases over time.
Results
Sample Characteristics
The 272 female participants had a mean age of 78.8 years, were predominantly White (98.5%), well-educated (60% had greater than a high school education), and had low to moderate income (68% annual income < $35,000). Participant attrition was low. Only 20 (7.4%) participants withdrew from the study. The sample size was n = 272 at baseline, n = 263 at 12 weeks, n = 257 at 1 year, and n = 252 at 2 years.
Change in Balance Confidence, Impairments, Functional Limitations, and Disability
ABC scores varied significantly at baseline and decreased over time (Table 1). The first model plotted in Figure 2 presents the unconditional predicted ABC scores at each time period. These results show that participants experienced on average, a decrease of 5% in ABC scores over 2 years.
Table 1.
Baseline Values and Unconditional Change Over 2 Years in Balance Confidence, Impairment, Functional Limitation, and Disability Variables.
| Variable | Baseline value M ± SD |
Intercept estimate (standard error) | Linear estimate (standard error) | Quadratic estimate (standard error) |
|---|---|---|---|---|
| Balance confidence | ||||
| Activity-Specific Balance Confidence Scale | 78.16 ± 16.72 | 4.35 (.01)*** | −.002 (.001)*** | |
| Impairments | ||||
| Berg Balance Test | 48.91 ± 5.62 | 3.89 (.007)*** | .001 (.001) | −.0001 (<.00001)* |
| Hip flexion strength (normalized for height and weight) | 0.15 ± 0.05 | 0.15 (.003)*** | .001 (.0005) | −.00003 (.00001)* |
| Functional limitations | ||||
| Timed-Up and Go Test (seconds) | 12.62 ± 8.65 | 2.54 (.04)*** | .02 (.003)*** | −.0004 (.0001)** |
| Repeated chair stands (seconds) | 15.77 ± 5.88 | 2.73 (.06)*** | .01 (.004)* | |
| Disability | ||||
| Physical activitya | 88.95 ± 47.47 | 4.53 (.03)*** | −.01 (.001)*** | |
| Activity restrictionsb | 8.90 ± 1.30 | 8.95 (.07)*** | −.01 (.004)** | |
| Lubben’s social network | 32.47 ± 7.53 | 32.16 (.45)*** | −.07 (.01)*** |
Note. Each line reports an individual univariate model with no predictors. Higher scores indicate better performance on the Berg Balance Test, hip flexion strength, physical activity, activity restrictions, and social networks and indicate worse performance on the Timed-Up and Go Test and repeated chair stands.
Measured with the Physical Activity Scale for the Elderly.
Measured with the Survey of Activities and Fear of Falling in the Elderly Activity Restriction subscale.
p < .05.
p < .01.
p < .001.
p < .0001.
Figure 2. Unconditional predicted mean change in balance confidence (A), impairment (B & C), functional limitation (D & E), and disability variables (F, G, & H).
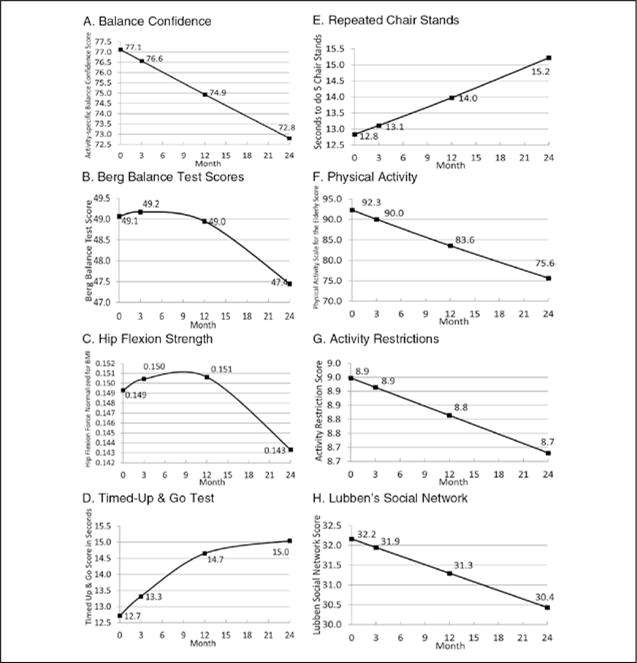
Note. Change in all variables was statistically significant with p values ranging from <.05 to < .001. The y-axes do not start at 0. In Figure A, the vertical axis represents the Activity-Specific Balance Confidence score which ranges from 0 to 100, with higher scores representing more confidence. In Figure B, the vertical axis represents the Berg Balance Test score which ranges from 0 to 56, with higher scores representing better balance. In Figure C, the vertical axis represents isometric hip flexion force normalized for height and weight. Higher scores indicate greater strength. In Figure D, the vertical axis represents the Timed-Up and Go score in seconds. Higher scores indicate worse mobility. In Figure E, the vertical axis represents the Repeated Chair Stands score. The score indicates the number of seconds it takes the participant to move from a seated to standing position five times. Higher scores indicate greater functional limitations with getting out of a chair. In Figure F, the vertical axis represents the Physical Activity Scale for the Elderly score. Higher scores indicate greater levels of physical activity. In Figure G, the vertical axis represents the Activity Restriction Subscale score from the Survey of Activities and Fear of Falling in the Elderly. Scores range from 0 to 11 with higher scores indicating greater participation in the 11 daily activities measured. In Figure H, the vertical axis represents the Lubben’s Social Network Scale score. Scores range from 0 to 50, with higher scores indicating larger social networks.
The BBT, TUG test, hip flexion strength, activity restriction, Lubben Social Network Scale, repeated chair stands, and PASE demonstrated statistically significant variation in baseline scores and in change over 2 years (Table 1). The unconditional change models plotted in Figure 2 demonstrate how function in these measures worsened over 2 years.
Factors Associated With Change in Balance Confidence
Table 2 presents the results of the single multivariate model identifying factors independently associated with baseline ABC scores and change in ABC scores over time. The baseline estimate (of ABC scores) demonstrated significant variability indicating that participants had different levels of balance confidence at baseline (β1 = 3.93, p < .001). However, the linear change parameter was not significant (β2 = −.01, p = .80) indicating that this set of variables does not predict linear change in balance confidence. Three variables were independently associated with baseline ABC scores (Table 2, column 3). Higher scores on the SF-36 physical function and mental health subscales were associated with higher balance confidence at baseline. Unexpectedly, higher SF-36 vitality scores were associated with lower balance confidence at baseline. Baseline vitality scores were moderately correlated with baseline scores on the Cantril (r = .51), SF-36 role physical (r = .53), SF-36 general health (r = .53), SF-36 social function (r = .52), SF-36 mental health (r = .55), and Geriatric Depression Scale (r = .56). Thus, issues of multicollinearity may explain this as a spurious finding. The only independent predictors of change in ABC scores were the SF-36 role emotional subscale and having a urological disorder (Table 2, column 4). However, these results are inconclusive as the linear change estimate was not significant in the overall model.
Table 2.
Predisposing Risk Factors and Pathologies Associated With Baseline Levels of and Change Over 2 Years in Balance Confidence.
| Baseline variable | Baseline M ± SD or % | Predictor of baseline balance confidence estimate (standard error) | Predictor of change in balance confidence estimate (standard error) |
|---|---|---|---|
| Predisposing risk factors | |||
| Age (in years) | 78.8 ± 5.6 | −.0069 (.0036) | −.0002 (.0003) |
| Cantril’s Self-Anchoring Scale | 7.7 ± 1.4 | .0207 (.0178) | 0022 (.0015) |
| SF-36 physical function | 62.2 ± 22.1 | .0065 (.0011)*** | −.0001 (.0001) |
| SF-36 role physical | 60.7 ± 38.8 | .0004 (.0006) | <.00001 (<.00001) |
| SF-36 general health | 70.5 ± 14.9 | .0008 (.0014) | .0001 (.0001) |
| SF-36 vitality | 59.1 ± 18.1 | −.0070 (.0015)*** | .0002 (.0001) |
| SF-36 social function | 87.6 ± 19.3 | .0028 (.0016) | −.0001 (.0001) |
| SF-36 role emotional | 77.9 ± 33.3 | .0005 (.0008) | −.0001 (.0001)* |
| SF-36 mental health | 81.6 ± 13.2 | .0036 (.0016)* | −.0002 (.0001) |
| Pain (SF-36 bodily pain) | 64.2 ± 20.3 | .0004 (.0011) | −.0000 (.0001) |
| Use of 4 or more medications | 44.9 | .0002 (.0390) | .0038 (.0036) |
| Number of falls reported at baseline | 0.7 ± 3.1 | −.0305 (.0270) | −.0026 (.0016) |
| Number of falls with mild injury during 2-year follow-up | 21.0 | −.0267 (.0194) | .0028 (.0014) |
| Pathology | |||
| Urological disorder | 29.4 | .0456 (.0344) | .0063 (.0030)* |
| Visual/hearing impairment | 61.0 | −.0600 (.0369) | .0072 (.0042) |
| Number of chronic medical conditions | 4.4 ± 2.5 | .0014 (.0084) | −.0009 (.0007) |
| Mini-Mental State Exam | 28.5 ± 1.5 | .0054 (.0158) | .0009 (.0013) |
| Geriatric Depression Scale | 1.8 ± 2.2 | −.0060 (.0129) | .0002 (.0010) |
Note. This table presents a single multivariate model with balance confidence (measured with the Activities-Specific Balance Confidence Scale) as the dependent variable changing over time. Variables significantly associated with balance confidence in bivariate analysis were included in the model. The estimate (standard error) for the intercept was 3.934 (.5741), p < .0001 and –.0112 (.0453), p = .804 for the linear change parameter.
p < .05.
p < .01.
p < .001.
p < .0001.
Consequences Associated With Change in Balance Confidence
Table 3 presents the associations between change in balance confidence and change in impairments, functional limitations, and disability. Each line represents a separate analysis. Changes in ABC scores were significantly associated with changes in all the impairment, functional limitation, and disability variables, after controlling for treatment group assignment and age. Decreasing ABC scores were associated with deteriorating balance, hip flexion strength, scores on the TUG and repeated chair stands, decreasing physical activity levels, increasing activity restrictions, and shrinking social networks.
Table 3.
Associations Between Decreasing Balance Confidence and Increasing Impairments, Functional Limitations, and Disabilities.
| Dependent variable | Intercept
|
Balance confidence
|
Group assignment
|
Age
|
|---|---|---|---|---|
| Estimate (standard error) | Estimate (standard error) | Estimate (standard error) | Estimate (standard error) | |
| Impairments | ||||
| Berg Balance Test | 4.07 (0.11)*** | 0.004 (0.001)*** | −0.005 (0.01) | −0.006 (0.001)*** |
| Hip flexion strength | 0.08 (0.04)* | 0.001 (0.0001)*** | −0.002 (0.005) | 0.0003 (0.0005) |
| Functional limitations | ||||
| Timed-Up and Go Test | 2.22 (0.32)*** | −0.01 (0.002)*** | 0.016 (0.04) | 0.02 (0.004)*** |
| Repeated chair stands | 2.63 (0.36)*** | −0.01 (0.001)*** | −0.03 (0.04) | 0.01 (0.005)** |
| Disability | ||||
| Physical activitya | 5.52 (0.40)*** | 0.01 (0.002)*** | 0.066 (0.05) | −0.02 (0.005)*** |
| Activity restrictionsb | 8.97 (1.03)*** | 0.03 (0.003)*** | 0.32 (0.12)** | −0.03 (0.01)** |
| Lubben’s social network | 59.50 (6.35)*** | 0.06 (0.01)** | −1.30 (0.80) | −0.40 (0.08)*** |
Note. Each line represents an individual model with balance confidence as a time-varying predictor for each time-varying dependent variable controlling for group assignment and age.
Measured with the Physical Activity Scale for the Elderly.
Measured with the Survey of Activities and Fear of Falling in the Elderly Activity Restriction subscale.
p < .05.
p < .01.
p < .001.
Discussion
To the authors’ best knowledge, this is the first study to describe change in balance confidence in a population-based sample of community-dwelling older women at risk for falling. This study described how balance confidence changed over time, identified predictors of this change, and identified associations between decreasing balance confidence and increasing disability. Participants had varying levels of balance confidence at baseline. Women with worse physical and mental health function reported lower levels of confidence. The average decrease in balance confidence was about 5% over 2 years.
Most well-known fear of falling correlates did not independently predict baseline levels of balance confidence or decreasing balance confidence, including falls. In the multivariate model, only low physical function and poor mental health were associated with lower levels of confidence at baseline. Even though linear change in balance confidence was no longer significant in the multivariate model, reports of poor emotional health and having urological disorders were associated with change. These findings suggest that risk factors for having low balance confidence may be different than risk factors for decreasing balance confidence over time. Thus, the selected variables did a better job of predicting the level of balance confidence than they did predicting change in balance confidence. The idea that risk factors for existing versus new or worsening fear of falling are different is supported in the literature. Austin et al.’s (2007) study of 1,282 older community-dwelling Australian women found more predictors for persistent fear of falling (i.e., live alone, high body mass index, cognitive impairment, depression, anxiety, falls, walking assistive device use, and mobility impairments), than for new onset fear of falling (i.e., high body mass index and mobility impairments). However, there are potentially alternate explanations for these findings. The low levels of depressive symptoms in this sample may explain why a relationship between depression and balance confidence was not found. Another alternate explanation may also be that 2 years was not enough time for these predictors to exert their effect on decreasing balance confidence. Also, the relatively high balance confidence scores in this population-based sample of older women at risk for falling may limit the discovery of relationships. However, the mean balance confidence score (78.2 ± 16.7) in this population-based sample was similar to the value (77.0 ± 20.0) reported in a population-based sample of older women with low bone mass (Liu-Ambrose et al., 2006) and slightly lower than the value (83.0 ± 19.5) reported in a population-based sample of community-dwelling older adults (Hadjistavropoulos et al., 2007). The similarity in balance confidence scores between these three population-based samples lend support to the generalizability of the findings to the target population of community-dwelling older adults.
The finding that general health status, older age, and falls did not predict baseline levels or change in balance confidence adds to the equivocal evidence in the literature. In the literature, only female gender and poor self-rated general health status have been consistent predictors of new onset fear of falling (Friedman et al., 2002; Lach, 2005). Some studies indicate falls (Friedman et al., 2002; Lach, 2005) and older age (S. M. Friedman et al., 2002; Murphy et al., 2003) predict new onset fear of falling, while others do not (Austin et al., 2007; Lach, 2005; Murphy et al., 2003).
In this randomized study, participants in the fall prevention group did not experience a difference in the way balance confidence changed over time compared to the control group, nor was the fall prevention intervention successful at improving balance confidence. Several randomized controlled trials of multifactorial fall prevention have been unsuccessful at changing fear of falling (Dukyoo, Juhee, & Lee, 2009). Programs successful at reducing fear of falling have targeted it as the primary outcome (Zijlstra et al., 2007). Taken together, these findings suggest that interventions effective at preventing falls may not be effective at treating fear of falling. Alternative explanations for the lack of treatment effect on balance confidence include not requiring participants to have fear of falling upon enrollment and the positive skew of ABC scores indicating high confidence. Older adults with fear of falling avoid participation in fall prevention programs (McInnes & Askie, 2004), and there may not have been enough women in the study with fear of falling to find a treatment effect. A second possibility is that balance confidence was improved for participants in the fall prevention program, but the ceiling effects of the ABC in this population of older women could not account for the changes (Talley, Wyman, & Gross, 2008). Other trials using more than one fear of falling measure have found discrepant results in efficacy, so the measure used can influence results (Zijlstra et al., 2007). However, there was a significant decrease in ABC scores over time suggesting this measure captures some aspect of fear of falling reliably in this population.
Researchers including fear of falling as a secondary outcome in fall prevention trials need to make careful decisions about who to include in the study and how to measure fear of falling. Future research on fear of falling interventions should target women who admit to this fear and should use measures of fear of falling appropriate for the target population. The evolving theoretical conceptualization of fear of falling and the lack of consensus on the best measures of fear of falling indicate the use of multiple measures is prudent (Scheffer et al., 2008). Future interventions should account for increasing fear over time, even in women reporting low levels of this fear and include activities to manage functional decline, urological disorders, and emotional distress.
This is the first longitudinal cohort study to indicate decreasing balance confidence is associated with increasing impairments in balance and hip flexion strength, functional limitations with mobility and with getting out of a chair, activity restrictions, decreasing physical activity levels, and decreasing social networks. The association between decreasing balance confidence and increasing impairments in balance and hip flexion strength and increasing functional limitations with mobility and with getting out of a chair support the idea that balance confidence may reflect a realistic appraisal of one’s actual level of fall risk (Hadjistavropoulos et al., 2011). It may also suggest that a feedback loop exists where decreasing confidence triggers increasing disabilities. Future studies are needed to identify potential mediators. These findings support previous research identifying fear of falling as a contributor to the disablement process (Judge, Schechtman, & Cress, 1996; Lach, 2005). Thus, balance confidence plays an important role in the disablement process and should be accounted for when treating or studying disability in older women.
Future research is needed to identify predictors of decreasing balance confidence and to identify subgroups of older women most likely to be impaired by low balance confidence. Potential predictors that should be examined that were not available in this study include acute changes in health status (i.e., hospitalization), anxiety, perceived risk of falling, perceived ability to manage a fall, perceived control over falling, and risk taking personality traits (Yardley & Smith, 2002). This analysis examined average change; however, each participant has a different pattern of change. Future research could select only those women who demonstrate decreasing confidence and identify what predicts change for these women to identify low confidence early and to intervene to arrest its decrease.
This is the first study to find that urological disorders are associated with lower balance confidence at baseline and with decreasing balance confidence. It is unclear as to the mechanism for this relationship. It may be that women with urinary urgency or frequency fear falling as they rush to the bathroom. Alternatively, women with urinary incontinence are at increased risk for falling, and there may be a common neurological disorder that accounts for impaired balance and urinary dysfunction. So, the decreasing confidence associated with urological disorders may be related to behavior (i.e., rushing to the bathroom) or with a sense of unbalance associated with a common neurological disorder. More research is needed to clarify this mechanism, because treatments would vary based on the mechanism (i.e., reinforce behavioral change or treat an underlying neurological dysfunction).
There are limitations to this study. In this analysis, the disablement model was used to identify relationships between increasing balance confidence and several components of disability. However, the design of this study does not support a causal model and the relationships found could be bidirectional. It is plausible that increasing impairments, functional limitations, and disability contribute to decreasing balance confidence. However, even if the reverse relationship exists, this study provides important evidence that balance confidence has associations with several important functional outcomes.
An additional limitation to this study is the inability to disentangle the complex relationships between fear of falling, balance confidence, and falls, as a measure of fear of falling was not available. However, the findings support some relationships proposed by Hadjistavropoulos et al. (2011) in their reconceptualization of fear of falling. Specifically, this study supports the idea that balance confidence may stem from a realistic appraisal of one’s own balance, gait, and strength abilities. It also supports the idea that balance confidence is associated with activity avoidance and social support.
In conclusion, this study provides new knowledge that balance confidence decreases over time in community-dwelling older women at risk for falling and that predictors for decreasing confidence may be different than for new onset or existing balance confidence. It also found important relationships between decreasing balance confidence and increasing disability, providing evidence that it is an important intra-individual factor in the disablement process. Future research on disability in older women should include balance confidence as a contributor to disability.
Acknowledgments
We would like to thank Dr. Helen Lach at the Saint Louis University, School of Nursing, for reviewing the manuscript and offering editorial revisions.
Funding
The authors disclosed receipt of the following financial support for the research, authorship, and/or publication of this article: Dr. Talley received funding for this study from a Ruth L. Kirschstein National Research Service Award from the National Institute of Nursing Research/National Institute of Health (1-F31-NR010170-01) and from the John A. Hartford Foundation’s Building Academic Geriatric Nursing Capacity Program. Data for this study came from a project supported by Grant R01 NR5107 from the National Institute of Nursing Research and the Office of Research on Women's Health, Bethesda, Maryland. The contents of this article are solely the responsibility of the authors and do not necessarily represent the official views of the funding agencies.
Footnotes
Authors’ Note
All authors contributed to the study concept and design, analysis and interpretation of data, and manuscript preparation. J. W. was the Principal Investigator of the RCT that generated the data.
Declaration of Conflicting Interests
The authors declared no potential conflicts of interest with respect to the research, authorship, and/or publication of this article.
References
- Arfken CL, Lach HW, Birge SJ, Miller JP. The prevalence and correlates of fear of falling in elderly persons living in the community. American Journal of Public Health. 1994;84:565–570. doi: 10.2105/ajph.84.4.565. [DOI] [PMC free article] [PubMed] [Google Scholar]
- Austin N, Devine A, Dick I, Prince R, Bruce D. Fear of falling in older women: A longitudinal study of incidence, persistence, and predictors. Journal of the American Geriatrics Society. 2007;55:1598–1603. doi: 10.1111/j.1532-5415.2007.01317.x. [DOI] [PubMed] [Google Scholar]
- Berg KO, Wood-Dauphinee SL, Williams JI, Maki B. Measuring balance in the elderly: Validation of an instrument. Canadian Journal of Public Health. 1992;83(Suppl. 2):S7–S11. [PubMed] [Google Scholar]
- Cantril H. A study of aspirations. Scientific American. 1963;208:41–45. doi: 10.1038/scientificamerican0263-41. [DOI] [PubMed] [Google Scholar]
- Csuka M, McCarty DJ. Simple method for measurement of lower extremity muscle strength. American Journal of Medicine. 1985;78:77–81. doi: 10.1016/0002-9343(85)90465-6. [DOI] [PubMed] [Google Scholar]
- Cumming RG, Salkeld G, Thomas M, Szonyi G. Prospective study of the impact of fear of falling on activities of daily living, SF-36 scores, and nursing home admission. Journals of Gerontology: Series A, Biological Sciences & Medical Sciences. 2000;55:M299–M305. doi: 10.1093/gerona/55.5.m299. [DOI] [PubMed] [Google Scholar]
- Deshpande N, Metter EJ, Lauretani F, Bandinelli S, Guralnik J, Ferrucci L. Activity restriction induced by fear of falling and objective and subjective measures of physical function: A prospective cohort study. Journal of the American Geriatrics Society. 2008;56:615–620. doi: 10.1111/j.1532-5415.2007.01639.x. [DOI] [PMC free article] [PubMed] [Google Scholar]
- Dukyoo J, Juhee L, Lee SM. A meta-analysis of fear of falling treatment programs for the elderly. Western Journal of Nursing Research. 2009;31(1):6–16. doi: 10.1177/0193945908320466. [DOI] [PubMed] [Google Scholar]
- Fitzmaurice GM, Laird NM, Ware JH. Applied longitudinal analysis. Hoboken, NJ: Wiley-Interscience; 2004. [Google Scholar]
- Friedman B, Heisel MJ, Delavan RL. Psychometric properties of the 15-item Geriatric Depression Scale in functionally impaired, cognitively intact, community-dwelling elderly primary care patients. Journal of the American Geriatrics Society. 2005;53(9):1570–1576. doi: 10.1111/j.1532-5415.2005.53461.x. [DOI] [PubMed] [Google Scholar]
- Friedman SM, Munoz B, West SK, Rubin GS, Fried LP. Falls and fear of falling: Which comes first? A longitudinal prediction model suggests strategies for primary and secondary prevention. Journal of the American Geriatrics Society. 2002;50(8):1329–1335. doi: 10.1046/j.1532-5415.2002.50352.x. [DOI] [PubMed] [Google Scholar]
- Hadjistavropoulos T, Delbaere K, Fitzgerald TD. Reconceptualizing the role of fear of falling and balance confidence in fall risk. Journal of Aging and Health. 2011;23(1):3–23. doi: 10.1177/0898264310378039. [DOI] [PubMed] [Google Scholar]
- Hadjistavropoulos T, Martin RR, Sharpe D, Lints AC, McCreary DR, Asmundson GJ. A longitudinal investigation of fear of falling, fear of pain, and activity avoidance in community-dwelling older adults. Journal of Aging and Health. 2007;19(6):965–984. doi: 10.1177/0898264307308611. [DOI] [PubMed] [Google Scholar]
- Howland J, Lachman ME, Peterson EW, Cote J, Kasten L, Jette A. Covariates of fear of falling and associated activity curtailment. Gerontologist. 1998;38(5):549–555. doi: 10.1093/geront/38.5.549. [DOI] [PubMed] [Google Scholar]
- Howland J, Peterson EW, Levin WC, Fried L, Pordon D, Bak S. Fear of falling among the community-dwelling elderly. Journal of Aging and Health. 1993;5(2):229–243. doi: 10.1177/089826439300500205. [DOI] [PubMed] [Google Scholar]
- Jaric S, Mirkov D, Markovic G. Normalizing physical performance tests for body size: A proposal for standardization. Journal of Strength and Conditioning Research. 2005;19(2):467–474. doi: 10.1519/R-15064.1. [DOI] [PubMed] [Google Scholar]
- Judge JO, Schechtman K, Cress E. The relationship between physical performance measures and independence in instrumental activities of daily living. The FICSIT group. Frailty and injury: Cooperative studies of intervention trials. Journal of the American Geriatrics Society. 1996;44(11):1332–1341. doi: 10.1111/j.1532-5415.1996.tb01404.x. [DOI] [PubMed] [Google Scholar]
- Lach HW. Incidence and risk factors for developing fear of falling in older adults. Public Health Nursing. 2005;22(1):45–52. doi: 10.1111/j.0737-1209.2005.22107.x. [DOI] [PubMed] [Google Scholar]
- Lachman ME, Howland J, Tennstedt S, Jette A, Assmann S, Peterson EW. Fear of falling and activity restriction: The Survey of Activities and Fear of Falling in the Elderly (SAFE) Journals of Gerontology: Series B, Psychological Sciences & Social Sciences. 1998;53(1):P43–P50. doi: 10.1093/geronb/53b.1.p43. [DOI] [PubMed] [Google Scholar]
- Liu-Ambrose T, Khan KM, Donaldson MG, Eng JJ, Lord SR, McKay HA. Falls-related self-efficacy is independently associated with balance and mobility in older women with low bone mass. Journals of Gerontology: Series A, Biological Sciences & Medical Sciences. 2006;61(8):832–838. doi: 10.1093/gerona/61.8.832. [DOI] [PubMed] [Google Scholar]
- Lubben J, Blozik E, Gillmann G, Iliffe S, von Renteln Kruse W, Beck JC, Stuck AE. Performance of an abbreviated version of the Lubben Social Network Scale among three European community-dwelling older adult populations. Gerontologist. 2006;46(4):503–513. doi: 10.1093/geront/46.4.503. [DOI] [PubMed] [Google Scholar]
- Maki BE, Holliday PJ, Topper AK. Fear of falling and postural performance in the elderly. Journal of Gerontology. 1991;46(4):M123–M131. doi: 10.1093/geronj/46.4.m123. [DOI] [PubMed] [Google Scholar]
- McAuley E, Mihalko SL, Rosengren K. Self-efficacy and balance correlates of fear of falling in the elderly. Journal of Aging and Physical Activity. 1997;5(4):329–340. [Google Scholar]
- McDowell I, Newell C, editors. Psychological well-being. 2nd. Oxford, UK: Oxford University Press; 1996. [Google Scholar]
- McHorney CA, Ware JE, Jr, Raczek AE. The MOS 36-item short-form health survey (SF-36): II. Psychometric and clinical tests of validity in measuring physical and mental health constructs. Medical Care. 1993;31(3):247–263. doi: 10.1097/00005650-199303000-00006. [DOI] [PubMed] [Google Scholar]
- McInnes E, Askie L. Evidence review on older people’s views and experiences of falls prevention strategies. Worldviews on Evidence-Based Nursing. 2004;1(1):20–37. doi: 10.1111/j.1741-6787.2004.04013.x. [DOI] [PubMed] [Google Scholar]
- Mendes de Leon CF, Seeman TE, Baker DI, Richardson ED, Tinetti ME. Self-efficacy, physical decline, and change in functioning in community-living elders: A prospective study. Journals of Gerontology: Series B, Psychological Sciences & Social Sciences. 1996;51(4):S183–S190. doi: 10.1093/geronb/51b.4.s183. [DOI] [PubMed] [Google Scholar]
- Murphy SL, Dubin JA, Gill TM. The development of fear of falling among community-living older women: Predisposing factors and subsequent fall events. Journals of Gerontology: Series A, Biological Sciences & Medical Sciences. 2003;58(10):M943–M947. doi: 10.1093/gerona/58.10.m943. [DOI] [PMC free article] [PubMed] [Google Scholar]
- Oh-Park M, Xue X, Holtzer R, Verghese J. Transient versus persistent fear of falling in community-dwelling older adults: Incidence and risk factors. Journal of the American Geriatrics Society. 2011;59(7):1225–1231. doi: 10.1111/j.1532-5415.2011.03475.x. [DOI] [PMC free article] [PubMed] [Google Scholar]
- Ostchega Y, Harris TB, Hirsch R, Parsons VL, Kington R, Katzoff M. Reliability and prevalence of physical performance examination assessing mobility and balance in older persons in the US: Data from the Third National Health and Nutrition Examination Survey. Journal of the American Geriatrics Society. 2000;48(9):1136–1141. doi: 10.1111/j.1532-5415.2000.tb04792.x. [DOI] [PubMed] [Google Scholar]
- Podsiadlo D, Richardson S. The timed “up & go”: A test of basic functional mobility for frail elderly persons. Journal of the American Geriatrics Society. 1991;39(2):142–148. doi: 10.1111/j.1532-5415.1991.tb01616.x. [DOI] [PubMed] [Google Scholar]
- Powell LE, Myers AM. The Activities-specific Balance Confidence (ABC) Scale. Journals of Gerontology: Series A, Biological Sciences & Medical Sciences. 1995;50A(1):M28–M34. doi: 10.1093/gerona/50a.1.m28. [DOI] [PubMed] [Google Scholar]
- Scheffer AC, Schuurmans MJ, van Dijk N, van der Hooft T, de Rooij SE. Fear of falling: Measurement strategy, prevalence, risk factors and consequences among older persons. Age and Ageing. 2008;37(1):19–24. doi: 10.1093/ageing/afm169. [DOI] [PubMed] [Google Scholar]
- Talley KM, Wyman JF, Gross CR. Psychometric properties of the activities-specific balance confidence scale and the survey of activities and fear of falling in older women. Journal of the American Geriatrics Society. 2008;56(2):328–333. doi: 10.1111/j.1532-5415.2007.01550.x. [DOI] [PubMed] [Google Scholar]
- Tombaugh TN, McIntyre NJ. The mini-mental state examination: A comprehensive review. Journal of the American Geriatrics Society. 1992;40(9):922–935. doi: 10.1111/j.1532-5415.1992.tb01992.x. [DOI] [PubMed] [Google Scholar]
- Vellas BJ, Wayne SJ, Romero LJ, Baumgartner RN, Garry PJ. Fear of falling and restriction of mobility in elderly fallers. Age and Ageing. 1997;26(3):189–193. doi: 10.1093/ageing/26.3.189. [DOI] [PubMed] [Google Scholar]
- Verbrugge LM, Jette AM. The disablement process. Social Science & Medicine. 1994;38(1):1–14. doi: 10.1016/0277-9536(94)90294-1. [DOI] [PubMed] [Google Scholar]
- Ware J. SF-36 health survey: Manual and interpretation guide. Boston, MA: The Health Institute, New England Medical Center; 1993. [Google Scholar]
- Washburn RA, Smith KW, Jette AM, Janney CA. The Physical Activity Scale for the Elderly (PASE): Development and evaluation. Journal of Clinical Epidemiology. 1993;46(2):153–162. doi: 10.1016/0895-4356(93)90053-4. [DOI] [PubMed] [Google Scholar]
- Wyman JF, Croghan CF, Nachreiner NM, Gross CR, Stock HH, Talley K, Monigold M. Effectiveness of education and individualized counseling in reducing environmental hazards in the homes of community-dwelling older women. Journal of the American Geriatrics Society. 2007;55(10):1548–1556. doi: 10.1111/j.1532-5415.2007.01315.x. [DOI] [PubMed] [Google Scholar]
- Yardley L, Smith H. A prospective study of the relationship between feared consequences of falling and avoidance of activity in community-living older people. Gerontologist. 2002;42(1):17–23. doi: 10.1093/geront/42.1.17. [DOI] [PubMed] [Google Scholar]
- Zijlstra GA, van Haastregt JC, van Rossum E, van Eijk JT, Yardley L, Kempen GI. Interventions to reduce fear of falling in community-living older people: A systematic review. Journal of the American Geriatrics Society. 2007;55(4):603–615. doi: 10.1111/j.1532-5415.2007.01148.x. [DOI] [PubMed] [Google Scholar]