

Abstract
Background
To determine if varus thrust, bowing-out of the knee during gait, i.e., the first appearance or worsening of varus alignment during stance, is associated with incident and progressive knee osteoarthritis (OA), we undertook an Osteoarthritis Initiative ancillary study. We further considered hypothesized associations adjusted for static alignment, anticipating some attenuation.
Methods
2–3 trained examiners/site at 4 sites observed gait. In eligible knees, incident OA was analyzed as subsequent incident KL≥2, whole and partial-grade medial joint space narrowing (JSN), and annualized loss of joint space width (JSW), and progression as medial JSN and JSW loss. Outcomes were assessed over up to 7 years of follow-up. Analyses were knee-level, using multivariable logistic and linear regression with GEE to account for between-limb correlation.
Results
The incident OA sample included 4187 knees/2610 persons; the progression sample included 3421 knees/2284 persons. In knees with OA, thrust was associated with progression by each outcome adjusting for age, gender, BMI, and pain. In knees without OA, varus thrust was not associated with incident OA or other outcomes. After adjustment for alignment, the thrust/progression association was attenuated but an independent association persisted for partial grade JSN and JSW loss outcome models. WOMAC Pain and alignment were consistently associated with all outcomes. Within the stratum of varus knees, thrust was associated with an increased risk of progression.
Conclusions
Varus thrust visualized during gait is associated with knee OA progression and should be a target of intervention development.
INTRODUCTION
Varus thrust is a bowing-out of the knee during gait, a first appearance or worsening of varus alignment while the limb is bearing weight, with return to less varus as weight is transferred off the limb. It represents a dynamic worsening of varus alignment in a phase of gait when the knee is most vulnerable to abnormal loading. In individuals with knee osteoarthritis (OA) in the Mechanical Factors in Arthritis of the Knee study (MAK), varus thrust visualized during gait was associated with medial OA progression over the subsequent 18 months, adjusting for age, gender, body mass index (BMI), and pain.1 To our knowledge, whether varus thrust is associated with incident radiographic knee OA has not been reported. In MAK, gait was observed by 1 examiner. Whether the association between varus thrust and knee OA disease progression is replicable with multiple examiners is unknown. To evaluate these questions, we undertook an Osteoarthritis Initiative (OAI) ancillary study.
In contrast to the dynamic phenomenon of a varus thrust, varus alignment, i.e., a hip-knee-ankle (HKA) angle >0° in the varus direction, is a static measurement on a standing full-limb radiograph. To what extent the association of varus thrust with knee OA outcomes can be explained by underlying varus alignment is unclear. Similarly, to what extent alignment associations can be explained by coexisting thrust is unknown. The larger size of the OAI provided a superior setting (vs. MAK) to study these possibilities. Varus thrust represents worse varus alignment than seen under static conditions and manifests instability. In theory, a thrust’s deleterious effect may be due to abnormal load distribution originating from instability and/or a fixed static malalignment. The nature of intervention will differ depending upon whether malalignment or thrust is the target; understanding whether the thrust effect is explained by malalignment is important.
We hypothesized: 1) in knees without radiographic OA [Kellgren/Lawrence grade (KL) <2 at OAI enrollment (0m) and 12m visits], varus thrust (12m, our study baseline) is associated with subsequent (to 12m) incident KL ≥2 (hypothesis 1a), medial joint space narrowing (JSN) by ≥1 whole grade (hypothesis 1b), medial JSN by ≥1 partial grade (hypothesis 1c), and loss of medial joint space width (JSW) (hypothesis 1d); and 2) in knees with radiographic OA (KL ≥2 at 0m or 12m), varus thrust is associated with subsequent (to 12m) medial JSN by whole grade (hypothesis 2a), medial JSN by partial grade (hypothesis 2b), and loss of medial JSW (hypothesis 2c). We further considered the hypotheses adjusted for static alignment, anticipating some but not complete attenuation of any association detected in the primary models.
METHODS
The OAI is a prospective, observational cohort study in men and women ages 45–79 years, enrolled in: Baltimore, MD; Columbus, OH; Pittsburgh, PA; or Pawtucket, RI. OAI progression subcohort eligibility required, in ≥1 knee, symptoms on most days for ≥1m during the past 12m and a definite tibiofemoral osteophyte.2,3 OAI incidence subcohort eligibility required absent symptomatic radiographic OA in both knees, and characteristics that increased risk of developing it (knee symptoms, overweight, knee injury, knee surgery, family history of a total knee replacement for OA, Heberden’s nodes, repetitive knee bending, age 70–79 years).2,3 Exclusion criteria were: rheumatoid arthritis or inflammatory arthritis; severe JSN in both knees at baseline, or unilateral total knee replacement and severe contralateral JSN; bilateral total knee replacement or plans for it within 3 years; MRI contraindications; positive pregnancy test; mobility aids (e.g., walker) other than 1 straight cane for 50% of ambulation; comorbid conditions precluding long-term study; and current participation in a double-blind randomized trial.2,3 The Institutional Review Board at each site approved the study.
Assessment of Varus Thrust
At the 12m visit (our study baseline), gait was observed for thrust presence by one of 2–3 examiners/site following a protocol standardizing: participant clothing, footies with sole grips; designated hallway marked by orange cones 10 meters apart; script; observation while the participant walked at a comfortable speed toward, away from, and toward examiner; sequence of examiner observation steps; and approach to recording results. Centralized training included a didactic session, observation of volunteers with known thrust status, and certification testing. The examiners were blinded to hypotheses.
To study intra-examiner reliability, because there is no means to conceal identity to eliminate all possibility of remembering an individual, we previously videotaped 40 individuals (waist down, identically clothed, 1 participant/tape) with varying habitus and OA severity.1 Order was altered between 2 viewing sessions. Intra-rater reliability was very good (kappa 0.81). To assess inter-examiner reliability, 22 persons with or at higher risk for knee OA and with and without thrust were examined by a) LS and b) one of 3 other examiners, among whom the exams were distributed (7, 7, and 8 exams). An unbalanced distribution of thrust presence made it problematic to calculate a meaningful kappa coefficient. Therefore, we based reliability on percentage agreement between LS and pooled second examiners. For the right and left knee varus thrust, percentage agreement was 95% and 100%, respectively.
Covariates
Covariates (using 12m data in analyses) included BMI and WOMAC Pain,4 adapted in the OAI to score each knee. Varus alignment was measured in the OAI as: mechanical axis (HKA) using 2 full-limb x-ray measurement approaches (OAI assigned variable names, HKANGLE and HKANGJD), and anatomical axis (femorotibial angle, FTA) on knee x-ray. Because HKANGLE data were available only in a subset of knees with HKANGJD data, and because the 2 measures were highly correlated (R = 0.98), we used HKANGJD data.
In the OAI, standing bilateral full-limb radiographs were acquired either at 12m or 24m.5 HKANGJD was calculated from 3 landmarks,6 as the angle subtended between the line through the femoral head and knee centers and the line through knee and tibiotalar joint centers, with varus as negative and valgus positive.6 FTA measurement on the fixed-flexion knee x-rays involved femoral axis definition using a coordinate system from location specific JSW measurement methods, tibial axis by shaft center 10 cm below the plateau, and a customized software tool.7–10 For FTA, valgus is more positive, varus more negative.
Outcomes
To acquire knee x-rays in the OAI, the posteroanterior fixed-flexion weight-bearing protocol2,5 with a SynaFlexer™ frame was used. All knees with ≥1 follow-up knee x-ray by the 48m visit were read centrally.11 For knees KL <2 at baseline, all timepoints with a knee x-ray were read. Concerning knees KL ≥2 at baseline, all timepoints through 48m were read, and 72/96m readings occurred in a random selection of knees KL 2 or 3 at baseline.11 Serial films were read grouped, with baseline known to readers and later timepoints randomly ordered. Two experts,12 blinded to other’s reading, hypotheses, and all other data, assessed KL grade and OARSI JSN grades.13 Adjudication included a third reader for disagreements on: KL ≥2 vs. KL <2 at any timepoint; and between any timepoints, change in OA status, KL, and JSN.12
In knees KL <2 at 0 and 12m, incident OA was analyzed as subsequent (to 12m) incident KL ≥2, and medial JSN worsening by ≥1 whole grade and by ≥1 partial grade. In knees KL ≥2 at 0m or 12m, progression was analyzed as subsequent (to 12m) medial JSN by whole grade and by partial grade. Outcomes were assessed up to the 96m OAI visit. For these outcomes, we used only the OAI released calculated (“V99”) variables as recommended.11 Knees with baseline JSN grade 3 in medial or lateral compartment were ineligible for progression and excluded.
A customized software tool was used to measure JSW, as described by Duryea et al.14 Measures of medial compartment minimum JSW and fixed location JSW [JSW(x)] were made from digitized knee images at each timepoint. We selected x = 0.250 as within the optimal range for measuring medial JSW based on a previous study.9 We analyzed annualized JSW loss (mm), the difference between baseline and final timepoint measured, divided by the number of years.
Statistical Analysis
All analyses were knee-based. For each hypothesis with a dichotomous outcome (1a, 1b, 1c, 2a, 2b) we used multivariable logistic regression models with generalized estimating equations (GEE) to account for between-limb correlation within each person, to evaluate the association of varus thrust presence (vs. no varus thrust) with the outcome for the hypothesis. Results are summarized as adjusted odds ratios (ORs) and 95% confidence intervals (CIs), and were considered to be statistically significant if the 95% CI did not include 1. For hypotheses with a continuous outcome (1d, 2c), we used multivariable linear regression models with GEE, with results summarized as adjusted regression coefficients (in units of the continuous outcome for thrust presence vs. no thrust) and 95% CIs. Results for the continuous outcome models were statistically significant if the 95% CI did not include 0. Separate models in knees without and with radiographic OA at baseline were initially adjusted for age (continuous), gender, BMI (continuous), and then also for WOMAC Pain (continuous). In the alignment substudy samples, each model was adjusted for age, gender, BMI and WOMAC Pain, and then adjusted for alignment (HKA and FTA, continuous). The alignment models were further adjusted by including a multiplicative interaction between thrust and alignment. We repeated these analyses stratified by HKA (varus, neutral, valgus). We used SAS Version 9.3 (Cary, NC) for all analyses.
RESULTS
Derivation of each analysis sample and corresponding descriptive data are shown in Figure 1. In the 4796 persons enrolled in the OAI, 7608 knees (3960 persons) had thrust assessment and calculated outcome data, and 5386 knees (3035 persons) had thrust assessment and JSW data. Attributes of these samples did not differ from the full cohort (Figure 1 footnote).
Figure 1. Derivation of Analysis Samples.
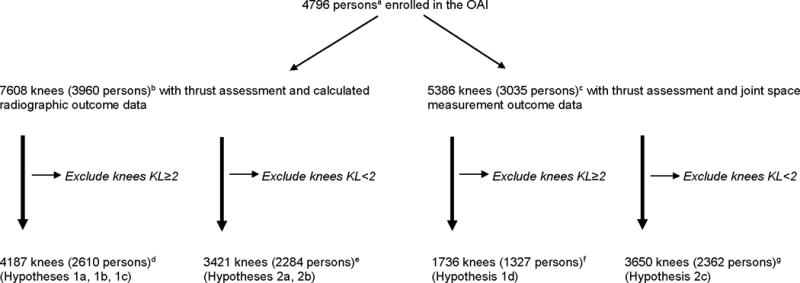
b) and c) Samples with these data overlapped
a) mean age 61.2 (0.2), BMI 28.6 (4.8), 2804 (58.5%) women
b) mean age 61.4 (9.1), BMI 28.6 (4.8), 2295 (58.0%) women
c) mean age 61.9 (9.1), BMI 29.1 (4.8), 1784 (58.8%) women
d) mean age 60.5 (9.2), BMI 27.8 (4.5), 1455 (56%) women
e) mean age 62.6 (9.0), BMI 29.6 (4.8), 1339 (59%) women
f) mean age 60.5 (9.0), BMI 28.2 (4.5), 760 (57.3%) women
g) mean age 62.6 (9.0), BMI 29.6 (4.8), 1364 (57.8%) women
In knees KL <2 at enrollment and 12m, varus thrust at 12m was not associated with subsequent KL ≥2, medial JSN whole grade or partial grade, or loss of medial JSW, adjusting for age, gender, BMI, and WOMAC Pain (Table 1). For this sample, median follow-up time was 84m (i.e., from baseline of 12m) [Interquartile Range (IQR) 60–84]. Further adjustment for HKA or FTA minimally altered these findings (not shown). Thrust was not associated with the dichotomous outcomes in men (n=1812) or women (n=2375) analyzed separately. Thrust was associated with JSW loss in women (n=1020, adjusted coefficient 0.025, 95% CI 0.002–0.048) but not men (n=716, adjusted coefficient −0.006, 95% CI −0.030, 0.019).
Table 1. Association of Varus Thrust at 12 months with Incident Radiographic Knee OA and with Medial Joint Space Narrowing in Knees without OA (at enrollment and 12 months) over up to 7 years Subsequent Follow-up.
In the first 2 rows, the table shows the frequency of knees with each outcome for the dichotomous outcomes (row percentage) and mean (SD) of change for the continuous outcome among knees with (first row) and without (second row) varus thrust. The third and fourth rows show adjusted odds ratios and 95% confidence intervals [OR (95% CI)] for thrust for each of the 3 dichotomous outcomes (first 3 columns) and the adjusted regression coefficients (95% CI) for the continuous outcome (fourth column).
| Frequencies (%) and Adjusted Odds Ratios (95% CI) 4187 knees [987 (23.6%) with thrust] |
Means (SD) and Adjusted Regression Coefficients (95% CI) 1736 knees [425 (24.5%) with thrust] |
||||
|---|---|---|---|---|---|
| Dichotomous outcomes | Continuous outcome | ||||
| Incident KL≥2 | Medial joint space narrowing, whole grade | Medial joint space narrowing, partial grade | Annualized loss of medial joint space width (mm), measured at x = 0.250 location | ||
| n (%) with outcome | Mean (SD) annualized loss of medial joint space width | ||||
| Varus thrust present (987 knees) | 123 (12.5%) | 68 (6.9%) | 71 (7.2%) | Varus thrust present (425 knees) |
0.092 (0.149) |
| Varus thrust absent (3200 knees) | 370 (11.6%) | 212 (6.6%) | 226 (7.1%) | Varus thrust absent (1311 knees) |
0.077 (0.151) |
| Model: Varus thrust, adj. for age, gender, BMI |
1.09 (0.86, 1.37) | 0.98 (0.73, 1.32) | 0.96 (0.71, 1.28) | 0.011 (−0.006, 0.028) | |
| Model: Varus thrust, adj. for age, gender, BMI, WOMAC Pain |
1.09 (0.86, 1.37)a | 0.98 (0.73, 1.32)b | 0.96 (0.72, 1.28)c | 0.011 (−0.006, 0.028)d | |
Also significant: BMI, gender (increased risk in women)
Also significant: BMI
Also significant: BMI
Also significant: gender (decreased risk in women)
In contrast, in knees KL ≥2 at enrollment or at 12m, varus thrust at 12m was associated with each outcome in adjusted models (Table 2). For this sample, median follow-up time was 84m (IQR 36–84). Findings were similar in women (n=2078) for the whole grade JSN outcome (adjusted OR 1.64, 95% CI 1.23–2.18) and the partial grade JSN outcome (adjusted OR 1.92, 95% CI 1.49–2.48), and in men (n=1485) for the partial grade outcome (adjusted OR 1.65, 95% CI 1.27–2.13). Thrust was associated with JSW loss in women (n=2165, adjusted coefficient 0.043, 95% CI 0.015–0.071) and men (n=1485, adjusted coefficient 0.055, 95% CI 0.025–0.085).
Table 2. Association of Varus Thrust at 12 months with Medial Joint Space Narrowing in Knees with OA (at enrollment or 12 months) over up to 7 years Subsequent Follow-up.
In the first 2 rows, the table shows the frequency of knees with each outcome for the dichotomous outcomes (row percentage) and mean (SD) of change for the continuous outcome among knees with (first row) and without (second row) varus thrust. The third and fourth rows show adjusted odds ratios and 95% confidence intervals [OR (95% CI)] for thrust for each of the 2 dichotomous outcomes (first 2 columns) and the adjusted regression coefficients (95% CI) for the continuous outcome (third column).
| Frequencies (%) and Adjusted Odds Ratios (95% CI) n = 3421 knees [975 (28.5%) with thrust] |
Means (SD) and Adjusted Regression Coefficients (95% CI) n = 3650 knees [1085 (29.7%) with thrust] |
|||
|---|---|---|---|---|
| Dichotomous outcomes | Continuous outcome | |||
| Models and Covariates | Medial joint space narrowing, whole grade | Medial joint space narrowing, partial grade | Annualized loss of medial joint space width (mm), measured at x = 0.250 location | |
| n (%) with outcome | Mean (SD) annualized loss of medial joint space width | |||
| Varus thrust present (975 knees) | 192 (19.7%) | 329 (33.7%) | Varus thrust present (1085 knees) | 0.173 (0.290) |
| Varus thrust absent (2446 knees) | 345 (14.1%) | 525 (21.5%) | Varus thrust absent (2565 knees) | 0.117 (0.230) |
| Varus thrust, adj. for age, gender, BMI |
1.50 (1.22, 1.85) | 1.81 (1.51, 2.17) | 0.053 (0.032, 0.074) | |
| Varus thrust, adj. for age, gender, BMI, WOMAC Pain |
1.49 (1.20, 1.83)a | 1.80 (1.50, 2.16)b | 0.049 (0.028, 0.069)c | |
Also significant: BMI, WOMAC Pain
Also significant: BMI, gender (decreased risk in women), WOMAC Pain
Also significant: gender (decreased risk in women), WOMAC Pain
Results were similar after further adjustment for injury in Tables 1 and 2 models (data not shown). For models in Table 2, after further adjustment for injury and baseline K/L grade: the adjusted OR for whole grade narrowing was 1.49, 95% CI 1.21–1.85; the adjusted OR for partial grade narrowing was 1.68, 95% CI 1.39–2.02; and the adjusted coefficient for JSW loss was 0.047, 95% CI 0.026–0.068.
For all the fully adjusted models shown in Tables 1 and 2, we further considered models that included non-linear (i.e., quadratic) terms for continuous variables (e.g., age and BMI) and found similar relationships between thrust and outcomes in these models (data not shown).
Next we evaluated the results in knees with OA after further adjusting for alignment. Among 6187 knees with thrust and HKA data, 1570 knees had a varus thrust. In these 1570 knees, mean static alignment was −1.97° (SD 3.37) and 1138/1570 (72.5%) had static varus alignment (HKA <0°). In the 4617 knees without a varus thrust, mean alignment was −0.88° (SD 3.11) and 2837 (61.4%) had varus alignment. Among the 6187 knees with varus thrust and HKA data: 3975 knees had varus alignment, of which 1138 (28.6%) had a varus thrust; and 2212 knees had neutral or valgus alignment, of which 432 (19.5%) had a varus thrust.
The thrust/progression association was attenuated (Table 3) but an independent association persisted for partial grade JSN worsening and JSW loss models including HKA and FTA. Further inclusion of an alignment-thrust interaction terms led to an increase in the magnitude of the OR for thrust in the partial-grade outcome (interaction term significant) and loss of significance in the continuous JSW outcome (interaction term not significant). WOMAC Pain and alignment were consistently associated with outcomes in these models (Table 3).
Table 3. Alignment Sub-study Data in Knees with OA (at enrollment or 12 months): Association of Varus Thrust with Medial Joint Space Narrowing, with and without Adjustment for Alignment, over up to 7 Years Subsequent Follow-up.
Findings from the 2 alignment sub-study samples are shown in the top (alignment by HKA) and bottom (alignment by FTA) half of the table. In the first 2 rows of each half, the table shows the frequency of knees with each outcome for the dichotomous outcomes (row percentage) and mean (SD) of change for the continuous outcome among knees with (first row) and without (second row) varus thrust. The third, fourth, and fifth rows show adjusted odds ratios and 95% confidence intervals [OR (95% CI)] for thrust for each of the 2 dichotomous outcomes (first 2 columns) and the adjusted regression coefficients (95% CI) for the continuous outcome (third column).
| Frequencies and Adjusted Odds Ratios (95% CI) for Thrust for Each Dichotomous Outcome | Means (SD) and Adjusted Regression Coefficients (95% CI) for Thrust for Continuous Outcome | |||
|---|---|---|---|---|
| Medial joint space narrowing, whole grade | Medial joint space narrowing, partial grade | Annualized loss of medial joint space width (mm), measured at x = 0.250 location | ||
| Models and Covariates Including HKA | n = 2875 knees | n = 2875 knees | n = 3078 knees | |
| Varus thrust present (806 knees) | 152 (18.9%) | 270 (33.5%) | Varus thrust present (906 knees) | 0.176 (0.287) |
| Varus thrust absent (2069 knees) | 295 (14.3%) | 447 (21.6%) | Varus thrust absent (2172 knees) | 0.117 (0.223) |
| Varus thrust, adj. for age, gender, BMI, WOMAC Pain |
1.37 (1.09, 1.74) | 1.76 (1.45, 2.15) | 0.053 (0.031, 0.074) | |
| Varus thrust, adj. for age, gender, BMI, WOMAC Pain + HKA |
1.00 (0.78, 1.29) | 1.27 (1.03, 1.58) | 0.027 (0.006, 0.047) | |
| Varus thrust, adj. for age, gender, BMI, WOMAC Pain + HKA and thrust-HKA interaction |
1.16 (0.84, 1.60)a | 1.56 (1.21, 2.01)b | 0.020 (−0.001, 0.040)c | |
| Models and Covariate Including FTA | n = 3378 knees | n = 3378 knees | n = 3608 knees | |
| Varus thrust present (963 knees) | 191 (19.8%) | 327 (34.0%) | Varus thrust present (1073 knees) | 0.174 (0.291) |
| Varus thrust absent (2415 knees) | 345 (14.3%) | 522 (21.6%) | Varus thrust absent (2535 knees) | 0.117 (0.231) |
| Varus thrust, adj. for age, gender, BMI, WOMAC Pain |
1.47 (1.19, 1.82) | 1.80 (1.50, 2.16) | 0.049 (0.029, 0.070) | |
| Varus thrust, adj. for age, gender, BMI, WOMAC Pain + FTA |
1.09 (0.87, 1.37) | 1.28 (1.04, 1.56) | 0.025 (0.005, 0.045) | |
| Varus thrust, adj. for age, gender, BMI, WOMAC Pain + FTA and thrust-FTA interaction |
1.77 (0.90, 3.52)d | 3.04 (1.64, 5.63)e | 0.007 (−0.039, 0.052)f | |
Also significant: BMI, WOMAC Pain, HKA
Also significant: Age, BMI, WOMAC Pain, HKA, interaction
Also significant: WOMAC Pain, HKA
Also significant: BMI, WOMAC Pain, FTA
Also significant: Age, BMI, WOMAC Pain, FTA, interaction
Also significant: gender (decreased risk in women), WOMAC Pain, FTA
Finally, we repeated models to investigate whether these results persisted within HKA strata; significant associations persisted in the varus and neutral knees (Table 4).
Table 4. Alignment Sub-study Data in Knees with OA (at enrollment or 12 months): Association of Varus Thrust with Medial Joint Space Narrowing in Alignment (HKA) Strata over up to 7 Years Subsequent Follow-up.
In the first 2 rows of each section (alignment stratum), the table shows the frequency of knees with the dichotomous outcome (row percentage) and mean (SD) of change for the continuous outcome, among knees with and without varus thrust. The third row of each section shows adjusted odds ratios and 95% confidence intervals [OR (95% CI)] for thrust for the dichotomous outcome and the adjusted regression coefficients (95% CI) for the continuous outcome.
| Adjusted Odds Ratios (95% CI) for Thrust for Each Dichotomous Outcome | Adjusted Regression Coefficients (95% CI) for Thrust for Continuous Outcome | ||
|---|---|---|---|
| Models and Covariates | Medial joint space narrowing, partial grade | Annualized loss of medial joint space width (mm), measured at x = 0.250 location | |
n = 2875 knees
|
n = 3078 knees
|
||
| Varus knees | % with outcome or outcome mean (SD), among varus knees with varus thrust | 207/462 knees (44.8%) | 0.216 (0.315) (n = 552 knees) |
| % with outcome or outcome mean (SD) among varus knees without varus thrust | 282/780 knees (36.2%) | 0.170 (0.243) (n = 821 knees) |
|
| Varus thrust, adj. for age, gender, BMI, WOMAC Pain |
1.40 (1.08, 1.80) | 0.041 (0.010, 0.073) | |
| Neutral knees | % with outcome or outcome mean (SD) among neutral knees with varus thrust | 59/248 knees (23.8%) | 0.142 (0.238) (n = 249 knees) |
| % with outcome or outcome mean (SD) among neutral knees without varus thrust | 145/864 knees (16.8%) | 0.098 (0.192) (n = 880 knees) |
|
| Varus thrust, adj. for age, gender, BMI, WOMAC Pain |
1.52 (1.06, 2.17) | 0.045 (0.009, 0.080) | |
| Valgus knees | % with outcome or outcome mean (SD) among valgus knees with varus thrust | 4/96 (4.2%) | 0.042 (0.159) (105 knees) |
| % with outcome or outcome mean (SD) among valgus knees without varus thrust | 20/425 (4.7%) | 0.063 (0.219) (471 knees) |
|
| Varus thrust, adj. for age, gender, BMI, WOMAC Pain |
0.98 (0.32, 3.01) | −0.020 (−0.058, 0.017) |
DISCUSSION
Over up to 7 years, in knees with radiographic OA, varus thrust was associated with subsequent medial knee OA progression, assessed using various outcome measures – medial JSN worsening by a whole grade, by a partial grade, or loss of JSW – in models adjusting for age, gender, BMI, and pain. In knees without radiographic OA, varus thrust was not associated with incident OA or other outcomes. Findings were similar in women and men examined separately. After adjustment for static alignment, the thrust/progression association was attenuated but an independent association persisted for partial grade worsening and JSW loss outcome models. WOMAC Pain and alignment were consistently associated with outcomes. Within the strata of varus knees and of neutral knees, thrust was associated with an increased risk of progression.
To our knowledge, this is the first confirmation of our original findings in MAK.1 Chang et al found that varus thrust was associated with medial OA progression in the subsequent 18 months (age-, sex-, BMI-, and pain-adjusted OR 3.96, 95% CI 2.11–7.43), with attenuation after further adjusting for alignment (adjusted OR 1.76, 95% CI 0.87–3.56). In varus-aligned knees, findings persisted (adjusted OR 3.17, 95% CI 1.60–6.31).1 Previous studies have shown that varus thrust is associated with knee symptoms,15–17 including pain during weightbearing activities.15
The MAK study relied on 1 examiner. The current findings support that, after training, gait observation can be applied in a multisite setting. There has been no previous report, to our knowledge, concerning thrust and incident radiographic OA. Wink et al recently reported, in MOST participants with a range of OA severity, that varus thrust visually assessed by high-speed video was associated with increased risk of incident bone marrow lesions (but not incident medial cartilage loss), worsening bone marrow lesions, and worsening medial cartilage loss, findings that persisted in varus knees examined separately.18 Our finding of an association of thrust with progression but not incident OA in the same study may relate to the healthier state of knees at risk for incident OA (vs. knees with OA). While static varus alignment has been found to be associated with both incident and progressive OA (which the current study confirms), the magnitude appears stronger for progression.
In the progression findings, the outcome requiring medial worsening by only a partial grade and the JSW loss outcome were more sensitive than the outcome requiring whole grade worsening. Our findings suggest that some but not all of the thrust effect was explained by static varus alignment. Static varus alignment findings (significant in every model) were minimally affected by the addition of varus thrust. There was evidence of interaction in the partial-grade models. Notably, in varus and in neutral knees, varus thrust presence was associated with a greater risk of progression. These findings in varus knees may reflect added, dynamic effects of a thrust. While varus thrust was associated with outcome, its contribution was more modest than that from static varus alignment. Treatment for thrust without concomitantly addressing static varus is unlikely to have a substantial impact on disease progression.
In MAK, which included both gait observation for thrust and quantitative gait analysis, knees with (vs. knees without) varus thrust had a greater maximum external knee adduction moment (KAM).1 Chang et al found that a varus thrust was associated with greater peak knee varus angular velocity and greater peak knee varus angle during the stance phase, in analyses adjusting for age, gender, BMI, gait speed, and static alignment.19 Notably, the difference in angular velocity (which captures both movement direction and speed) between knees with and without varus thrust was unaffected by adjustment for alignment, while the difference in peak knee varus angle was in part explained by alignment.19 In another study, in women with medial knee OA, the knee adduction angle during gait and shank mean angular velocity were greater from heel strike to 30% stance in the OA group vs. controls, and were associated with maximum KAM.20 Mahmoudian et al found that varus thrust (measured as knee varus angle increase during the weight-bearing phase of gait) was greater in both early and established OA groups vs. controls suggesting problems with stabilization in early knee OA.21 Varus thrust magnitude was correlated with KAM second peak.21
The current study has several limitations. The findings are based on examiner gait observation to visually assess thrust presence. Although it is not feasible to perform quantitative gait analysis in clinical settings, a more precise method to quantify the movement visualized as a thrust may result in different findings. Notably, we were able to detect an association with progression outcomes even with simple gait observation performed by multiple examiners at 4 sites. It remains possible that our thrust assessment was not precise enough to detect an association between thrust and incident OA. It was important to evaluate thrust by gait observation as the most easily used approach in large scale research and in clinical settings. Static alignment was not assessed in all participants, albeit in large subgroups similar in baseline characteristics to the full samples. While it is unlikely that much change in alignment would have occurred between 12m and 24m, it would have been ideal for alignment to be assessed in all participants at 12m. The OAI may not reflect the general population. Recruitment focused on persons at higher risk for knee OA, a group of public health importance that will grow with expansion of aging and overweight populations. However, findings may not be the same in populations not at higher risk.
These findings have important research and clinical implications. Given this replication of the finding that varus thrust is associated with knee OA progression, intervention should be developed; while specific development is needed, it is not difficult to envision an orthotic approach to help stabilize the knee. Of note, to relieve pain, neuromuscular exercise was more effective for individuals with a varus thrust, and quadriceps strengthening exercise was more effective when a thrust was absent.22 In theory, the modest impact of interventions addressing static alignment may relate to no consideration of concomitant varus thrust. Future studies could also focus on developing and evaluating a training video or other approach to disseminate gait observation training. Gait observation can be incorporated into observational and therapeutic studies of knee OA, to enable analytic consideration of thrust. Gait observation cannot replace quantitative gait analysis, but does provide a simple approach to identify individuals at higher risk for progression. Gait observation, perhaps coupled with a simple inspection of alignment in the standing patient, should be incorporated into the physical exam; the current findings are a reminder of the powers of observation.
In conclusion, varus thrust visualized during gait is associated with knee OA progression and should be a target of intervention development.
Supplementary Material
Acknowledgments
We would like to acknowledge the dedication and commitment of the OAI study participants. Support for this study came from NIH/NIAMS R01 AR052918, R01 AR065473, P60 AR064464 and the Osteoarthritis Initiative. The OAI is a public-private partnership comprised of five contracts (N01-AR-2-2258; N01-AR-2-2259; N01-AR-2-2260; N01-AR-2-2261; N01-AR-2-2262) funded by the NIH and conducted by the OAI Study Investigators. Private funding partners include Merck Research Laboratories, Novartis Pharmaceuticals Corporation, GlaxoSmithKline, and Pfizer, Inc. Private sector funding for the OAI is managed by the Foundation for the NIH. This manuscript was prepared using an OAI public use data set (in addition to data obtained within NIH/NIAMS funded ancillary grants) and does not necessarily reflect the opinions or views of the OAI investigators, the NIH, or the private funding partners.
FUNDING: NIH/NIAMS R01 AR052918, R01 AR065473, P60 AR064464, and the Osteoarthritis Initiative
The study sponsor played no role in study design or the collection, analysis, and interpretation of data and the writing of the article or the decision to submit it for publication; researchers were independent from funders and sponsors; researchers had access to all the data.
References
- 1.Chang A, Hayes K, Dunlop D, et al. Thrust during ambulation and the progression of knee osteoarthritis. Arthritis Rheum. 2004;50(12):3897–903. doi: 10.1002/art.20657. [DOI] [PubMed] [Google Scholar]
- 2.Nevitt MC, Felson D, Lester G. http://oai.epi-ucsf.org/datarelease/docs/StudyDesignProtocol.pdf. (accessed May 27 2015)
- 3.http://oai.epi-ucsf.org/datarelease/docs/StudyDesignAppendices.pdf. (accessed May 27 2015).
- 4.Bellamy N, Buchanan WW, Goldsmith CH, Campbell J, Stitt LW. Validation study of WOMAC: a health status instrument for measuring clinically important patient relevant outcomes to antirheumatic drug therapy in patients with osteoarthritis of the hip or knee. J Rheumatol. 1988;15(12):1833–40. [PubMed] [Google Scholar]
- 5.http://oai.epi-ucsf.org/datarelease/operationsManuals/RadiographicManual.pdf. (accessed May 27 2015).
- 6.Central Assessment of Full-Limb X-rays for Frontal Plane Lower Limb Alignment. https://oai.epi-ucsf.org/datarelease/forms/flXR_KneeAlign_Descrip.pdf?V01HKANGJD (accessed February 8 2017)
- 7.Central Assessment of Longitudinal Knee X-rays for Femoral-Tibial Angle (Anatomic Alignment) https://oai.epi-ucsf.org/datarelease/forms/kXR_FTA_Duryea_Descrip.pdf?V00BRCDJD (accessed February 8 2017)
- 8.Duryea J, Li J, Peterfy CG, Gordon C, Genant HK. Trainable rule-based algorithm for the measurement of joint space width in digital radiographic images of the knee. Med Phys. 2000;27(3):580–91. doi: 10.1118/1.598897. [DOI] [PubMed] [Google Scholar]
- 9.Neumann G, Hunter D, Nevitt M, et al. Location specific radiographic joint space width for osteoarthritis progression. Osteoarthritis Cartilage. 2009;17(6):761–5. doi: 10.1016/j.joca.2008.11.001. [DOI] [PMC free article] [PubMed] [Google Scholar]
- 10.Iranpour-Boroujeni T, Li J, Lynch JA, Nevitt M, Duryea J, Investigators OAI A new method to measure anatomic knee alignment for large studies of OA: data from the osteoarthritis initiative. Osteoarthritis Cartilage. 2014;22(10):1668–74. doi: 10.1016/j.joca.2014.06.011. [DOI] [PubMed] [Google Scholar]
- 11.Overview and Description of Central Image Assessments. https://oai.epi-ucsf.org/datarelease/docs/ImageAssessments/ImageAssessmentDataOverview.pdf (accessed February 8, 2017 2017)
- 12.http://oai.epi-ucsf.org/datarelease/forms/kXR_SQ_BU_Descrip.pdf?V01XRKL (accessed May 27 2015).
- 13.Kellgren JH, Lawrence JS. Radiological assessment of osteo-arthrosis. Ann Rheum Dis. 1957;16(4):494–502. doi: 10.1136/ard.16.4.494. [DOI] [PMC free article] [PubMed] [Google Scholar]
- 14.Central Assessment of Longitudinal Knee X-rays for Quantitative JSW. https://oai.epi-ucsf.org/datarelease/forms/kXR_QJSW_Duryea_Descrip.pdf?V00JSW150 (accessed February 8 2017)
- 15.Lo GH, Harvey WF, McAlindon TE. Associations of varus thrust and alignment with pain in knee osteoarthritis. Arthritis Rheum. 2012;64(7):2252–9. doi: 10.1002/art.34422. [DOI] [PMC free article] [PubMed] [Google Scholar]
- 16.Iijima H, Fukutani N, Aoyama T, et al. Clinical Phenotype Classifications Based on Static Varus Alignment and Varus Thrust in Japanese Patients With Medial Knee Osteoarthritis. Arthritis Rheumatol. 2015;67(9):2354–62. doi: 10.1002/art.39224. [DOI] [PMC free article] [PubMed] [Google Scholar]
- 17.Fukutani N, Iijima H, Fukumoto T, et al. Association of Varus Thrust With Pain and Stiffness and Activities of Daily Living in Patients With Medial Knee Osteoarthritis. Phys Ther. 2016;96(2):167–75. doi: 10.2522/ptj.20140441. [DOI] [PubMed] [Google Scholar]
- 18.Wink AE, Gross KD, Brown CA, et al. Varus thrust during walking and the risk of incident and worsening medial tibiofemoral MRI lesions: the Multicenter Osteoarthritis Study. Osteoarthritis Cartilage. 2017 doi: 10.1016/j.joca.2017.01.005. [DOI] [PMC free article] [PubMed] [Google Scholar]
- 19.Chang AH, Chmiel JS, Moisio KC, et al. Varus thrust and knee frontal plane dynamic motion in persons with knee osteoarthritis. Osteoarthritis Cartilage. 2013;21(11):1668–73. doi: 10.1016/j.joca.2013.08.007. [DOI] [PMC free article] [PubMed] [Google Scholar]
- 20.Foroughi N, Smith RM, Lange AK, Baker MK, Fiatarone Singh MA, Vanwanseele B. Dynamic alignment and its association with knee adduction moment in medial knee osteoarthritis. Knee. 2010;17(3):210–6. doi: 10.1016/j.knee.2009.09.006. [DOI] [PubMed] [Google Scholar]
- 21.Mahmoudian A, van Dieen JH, Bruijn SM, et al. Varus thrust in women with early medial knee osteoarthritis and its relation with the external knee adduction moment. Clin Biomech (Bristol, Avon) 2016;39:109–14. doi: 10.1016/j.clinbiomech.2016.10.006. [DOI] [PubMed] [Google Scholar]
- 22.Bennell KL, Dobson F, Roos EM, et al. Influence of Biomechanical Characteristics on Pain and Function Outcomes From Exercise in Medial Knee Osteoarthritis and Varus Malalignment: Exploratory Analyses From a Randomized Controlled Trial. Arthritis Care Res (Hoboken) 2015;67(9):1281–8. doi: 10.1002/acr.22558. [DOI] [PubMed] [Google Scholar]
Associated Data
This section collects any data citations, data availability statements, or supplementary materials included in this article.