

Abstract
Objectives
The auditory brainstem implant (ABI) provides sound awareness to patients who are ineligible for cochlear implantation. Auditory performance varies widely among similar ABI cohorts. We hypothesize that differences in electrode array position contribute to this variance. Herein, we classify ABI array position based on postoperative imaging and investigate the relationship between position and perception.
Design
Retrospective review of pediatric and adult ABI users with postoperative computed tomography (CT). To standardize views across subjects, true-axial reformatted series of scans were created using the McRae line. Using multiplanar reconstructions, basion and electrode array tip coordinates and array angles from vertical were measured. From a lateral view, array angles (V) were classified into Types I-IV, and from posterior view, array angles (T) were classified into Types A-D. Array position was further categorized by measuring distance vertical from basion (D1) and lateral from midline (D2). Differences between array classifications were compared with audiometric thresholds, number of active electrodes, and pitch ranking.
Results
Pediatric (n=4, 2 with revisions) and adult (n=7) ABI subjects were included in this study. Subjects had a wide variety of ABI array angles, but most were aimed superiorly and posteriorly (Type II, n=7) from lateral view and upright or medially tilted from posterior view (Type A, n=6). Mean pediatric distances were 8 – 42% smaller than adults for D1 and D2. In subjects with perceptual data, electrical thresholds and the number of active electrodes differed among classification types.
Conclusions
In this first study to classify ABI electrode array orientation, array position varied widely. This variability may explain differences in auditory performance.
Keywords: ABI, hearing loss, cochlear implant, CI, neurofibromatosis type 2, NF2, CT, multiplanar reconstruction
INTRODUCTION
The auditory brainstem implant (ABI) was developed almost 40 years ago to provide auditory percepts for adults with neurofibromatosis type 2 (NF2) (Hitselberger et al. 1984). Most NF2 patients are not candidates for the cochlear implant (CI) as they have cochlear nerve injury from the growth or removal of bilateral vestibular schwannomas. Indications for the ABI have recently expanded to non-tumor adult and pediatric patients who are deaf but who are not CI candidates due to anatomic constraints (L. Colletti et al. 2014; Puram et al. 2016). Some ABI patients achieve open-set speech perception (Behr et al. 2014; V. Colletti 2006; Noij et al. 2015; Yücel 2015), but the majority experience is limited to sound detection and speech pattern perception, both of which enhance lip-reading. In addition, there is subject-to-subject variability in 1) number and distribution of electrodes that elicit auditory sensations and 2) the number of electrodes that produce non-auditory side effects and are turned off during a subject’s ABI programming (Behr et al. 2014; McSorley et al. 2015; Noij et al. 2015). Variable success with the ABI has been attributed to various causes, including damage to specific populations of cells in the cochlear nucleus (Colletti and Shannon 2005).
In contrast to the CI electrode that approximates the tonotopic organization of the cochlea, the ABI array is placed on or near the surface of the cochlear nucleus of the brainstem without bony or surface landmarks to guide precise placement (V. Colletti et al. 2005; Hitselberger et al. 1984). To reach the region of the cochlear nucleus, the ABI electrode paddle is placed via a translabyrinthine or retrosigmoid craniotomy approach through the foramen of Luschka (lateral recess of fourth ventricle) at the level of the glossopharyngeal nerve (cranial nerve IX). Intraoperatively, electrode position is adjusted using electrically evoked auditory brain responses (eABR)(Waring 1995, 1996), whose morphology can be associated with recruitment of auditory pathway neurons (Herrmann et al. 2015; Waring 1995, 1996; Waring et al. 1999) and postoperative sound perception (Herrmann et al. 2015).
After ABI surgery, postoperative computed tomography (CT) is routinely performed to rule out hematoma, pneumocephalus or brain herniation associated with craniotomy surgery, and has been used to confirm array position within the lateral recess (Shannon et al. 1993). In other systems, intraoperative CT compares favorably with electrophysiology when used to guide placement of deep brain stimulation electrodes for the management of Parkinson disease or essential tremor (Burchiel et al. 2013). Intraoperative flat panel X-rays and mobile fluoroscopic systems (portable C-arm) are used to provide feedback to the surgical team about the location of the CI electrode (Ahn et al. 2011; Dirr et al. 2013). Radiology during CI surgery can be used to generate a static view of the electrode or provide a live video stream to guide insertion. CT provides the most detailed information about the orientation of CI electrodes within the cochlea (Kong et al. 2012; Sennaroglu et al. 2002; Svrakic et al. 2015). CI surgery for severe malformations of the inner ear also benefit from novel intraoperative CT approaches (Bloom et al. 2009).
Herein, we aim to use routine postoperative CT to describe the intracranial position of electrode arrays in ABI subjects in three-dimensional (3D) space. We establish a classification system for 3D ABI array position using angle and linear measurements referenced to standardized landmarks. Perceptual data for each subject were analyzed and correlated with differences among array positions. We hypothesize that differences in ABI electrode array orientation influence perceptual thresholds, the number and distribution of active and disabled electrodes, and the variability in perceptual outcomes in ABI users.
METHODS
Patient Selection and Study Design
Approval for this study was obtained from the Human Studies Committee of Massachusetts Eye and Ear Infirmary (Protocols #340312, #441528, #444277). Inclusion criteria were adult or pediatric patients with bilateral profound sensorineural hearing loss who underwent ABI surgery for NF2 or non-NF2 etiologies with postoperative head CT imaging. ABI patients received either the Nucleus ABI24 or Nucleus Profile ABI541 (Cochlear Corporation). The ABI541 is not approved by the FDA for non-NF2 etiologies. Both implants share the same electrode array consisting of 21 surface contacts measuring 0.7 mm in diameter on a backing that measures 3 × 8.5 × 0.7 mm. A separate ground lead is placed outside the craniotomy defect and in between the calvarium and temporalis muscle.
Imaging
Following translabyrinthine or retrosigmoid craniotomy and ABI placement, subjects underwent non-contrast CT imaging. The pediatric patients were imaged one day after surgery, and the adult patients were imaged at other times (days to years after surgery). Imaging was performed on SOMATOM Definition Edge and Flash (Siemens), and Discovery CT 750HD (GE) CT scanners. Scanning parameters varied between imaging series, with peak kilovoltage ranging between 80–120 kVp, exposure time ranging from 912–1178 ms, and slice thickness varying between 0.39–1 mm.
To standardize imaging data across subjects, axial CT images for each subject were reformatted into “true axial” series using Multiplanar Reconstruction (MPR) and the McRae line, which made the foramen magnum parallel to the axial plane in every subject. The McRae line is a common craniometric measurement and skull base line utilized in cross-sectional imaging, and has been validated to assess basilar invagination (atlanto-axial impaction)(Cronin et al. 2009; Kwong et al. 2011; Ladner et al. 2015; McRae et al. 1953). The line is drawn across the foramen magnum in the sagittal plane and connects the basion (the most medial, posterior and inferior segment of the basiocciput at the clival base that forms the most anterior point of the foramen magnum) with the opisthion (the most medial and posterior point of the foramen magnum). Therefore, in order to standardize all subject imaging data for comparison, all CT scans were reformatted to a “true axial” series using the McRae line. Similar to the axial plane, the sagittal plane was aligned using the dens and anterior bony nasal septum, and the coronal plane was aligned using the inferior borders of the foramen magnum bilaterally. All images were reformatted in 0.6 mm slices.
True axial reformatted DICOM files were exported with a picture archiving and communication system (PACS) (Synapse version 4.4) and imported into OsiriX MD v.7.0.1 64-bit. Each image series was viewed in MPR mode, where coordinates were marked at the basion and at the proximal and distal tip of the electrode array (Figure 1A, 1B). The view was then switched from axial 2D (Figure 1A, 1B) to a 3D maximum intensity projection (MIP) to reveal pertinent anatomic structures and confirm marked coordinates (Figure 1C and 1D).
Figure 1.

Sagittal (A) and Coronal (B) views in multiplanar reformat of a postoperative CT without contrast showing the electrode array surrounded by metal artifact (red arrow). Coordinates for landmarks such as the proximal electrode array tip are marked with the green dot in all three planes. Next, 3D Maximum Intensity Projection (MIP) reconstructions visualize ABI electrode array position in a pediatric subject by projecting only the highest intensity pixels (C, D). Postoperative axial CT (Raw DICOM data) typically shows a characteristic “windmill streak” metallic artifact obscuring the electrode array position, yet standardized left lateral (C) and posterior (D) 3D MIP views clearly show array as angled superiorly and posteriorly. Green dots show coordinates of distal and proximal electrode array tips marked in MPR mode, which are used to calculate angles as outlined by red lines. In C, angle V measures the vertical angle of the electrode with respect to the horizontal line (43° in this subject). In D, angle T measures the medial tilt with respect to the horizontal (85° in this subject). The receiver/stimulator is particularly well visualized, as is the ground/reference electrode (asterisk). R: right side, L: left side, A: anterior, P: posterior.
The electrode position was further classified by angle using coordinates marked in MPR. JPEG images of standard views for each subject were exported from OsiriX and imported into ImageJ 1.47v. Angle V was the angle with respect to the horizontal measured from a standard left lateral view (Figure 1C). Angle T was the angle of the electrode with respect to the horizontal measured from a standard posterior view (Figure 1D). Linear measurements were made between the proximal tip of the electrode array and the basion markings from left lateral and posterior views. D1 was the superior distance from the basion to the array, as measured from a standard posterior view. D2 was the lateral distance measured from the midline to the array, as measured from a standard posterior view.
Classification System
A classification system was designed a priori. Due to potential differences in structural size between pediatric and adult patients, the data sets were stratified into two separate groups. Array position was classified based on angle and distance. Classification Types I-IV were based on angle V into Type I (71–90 degrees), Type II (21 - 70 degrees), Type III (0–20 degrees), and Type IV (outside 0–90 degrees) (Figure 2). A second set of classification Types A-D were based on angle T into the same brackets as above for: Type A (71–90 degrees), Type B (21–70 degrees), Type C (0–20 degrees), and Type D (outside 0–90 degrees) (Figure 2).
Figure 2.

Adult (left) and pediatric (right) ABI arrays demonstrate wide varieties of angle V (above, as seen from a left lateral 3D MIP view) and angle T (below, as seen from a posterior 3D MIP view) (each color denotes a separate array). All data share a common origin at the proximal electrode tip. A pediatric subject’s skull is superimposed to show vectors relative to bony landmarks. Middle diagrams show angle classification types. For angle V (top), values ranged from pointing vertically upright (Type I) to posteriorly (Type III). Arrays outside of 0–90° were Type IV. For angle T (bottom), values ranged from no tilt (Type A) to tilting medially (Type C). Arrays with a lateral tilt outside of 0–90° were Type D.
Mean and standard error of the mean values were calculated for D1 and D2, stratified for adult and pediatric subjects. Individual values for electrode distances greater than twice the standard error of the mean were given either a “superior” designation for D1 or “lateral” designation for D2.
Perceptual Analysis
Perceptual data were extracted for analysis from measures made in conjunction with programming of the ABI using the device manufacturer’s clinical software (Custom Sound, Cochlear Corporation) and the standard programming pod interface with either a Freedom or N6 speech processor. Psychophysical threshold (T) and just-uncomfortable loudness (C) levels were set for each electrode using monopolar stimulation reported in manufacturer clinical units (CL, Cochlear Corporation). For children, thresholds were measured using visual reinforcement audiometry and in some cases conditioned play audiometry. Uncomfortable levels were set by observing any adverse effects and/or achieving an adequate dynamic range. Adult subjects either verbally reported detection of a sensation or raised their hand for thresholds and verbally judged the loudness of the sensation for uncomfortable levels. A mean threshold level for each patient was calculated by averaging the thresholds for all active electrodes in the array (not counting 1) disabled electrodes, which were turned off due to side effects or 2) electrodes for which there was no response near maximal stimulus intensity). “Heatmap” plots using color coding were constructed to illustrate the differences in thresholds across the electrodes. Adult subjects ranked active electrodes by perceived pitch by comparing the pitch of active electrode pairs. This pitch ranking was used for frequency allocation in the processor program (MAP). Perceptual data were then stratified by the classification of ABI electrode orientation.
RESULTS
1. Demographics
We analyzed the 3D CT orientation of 14 ABI electrode arrays from 11 patients (7 adult, 4 pediatric) (Table 1). One pediatric patient (S01) had a revision procedure because of device failure due to trauma in the setting of mechanical falls (receiver-stimulator); another pediatric patient (S02) had hard device failure of unknown cause, and one adult patient (Adult 02) had bilateral implants. All children underwent retrosigmoid craniotomies. Five of the adult patients had NF2. Two adults had retrosigmoid craniotomies with gross total tumor resection (Adult 03, Adult 04), one had a retrosigmoid craniotomy with subtotal resection of tumor (Adult 02), one had a translabyrinthine craniotomy for ABI placement with no residual tumor (Adult 01), and one had a prior translabyrinthine craniotomy with tumor resection involving cranial nerves V, VII, and VIII at the time of ABI placement (Adult 05). The two adult non-NF2 patients underwent retrosigmoid craniotomy for ABI placement (Adult 06, Adult 07). The mean age at time of operation for pediatric subjects was 22 months old (range 11–31) months), and the mean age for adult subjects was 43.4 years old (range 23–68 years). Additionally, 9 out of 14 (64%) of subjects were male, and 11 out of 14 (79%) ABIs were right sided.
Table 1.
Patient Demographics
| Subject | Etiology | Age at Time of Surgery | ABI Device | Side | Active Electrodes | Number Electrodes with Side Effects | Mean Perceptual Threshold (CL) | Combined Classification Type |
|---|---|---|---|---|---|---|---|---|
| Pediatric | (months) | |||||||
| S01 | CN VIII aplasia | 18 | ABI24 | Right | 15 | 6 | 143 | II B |
| S01-R* | CN VIII aplasia | 26 | ABI24 | Right | 14 | 3 | 136 | I B |
| S02 | CN VIII aplasia | 11 | ABI24 | Right | 16 | 0 | 93 | I A |
| S02-R* | CN VIII aplasia | 31 | ABI541 | Right | 18 | 0 | 98 | II A |
| S04 | CN VIII aplasia | 15 | ABI24 | Right | 11 | 0 | 77 | II A |
| S07 | CN VIII aplasia | 30 | ABI24 | Right | 13 | 0 | 116 | II A |
| Adult | (years) | |||||||
| Adult 01 | NF2 | 34 | ABI24 | Left | 8 | 7 | 92 | III A |
| Adult 02 | NF2 | 66 68 |
ABI24 ABI24 |
Left Right |
8 - |
- - |
131 - |
II B II B |
| Adult 03 | NF2 | 23 | ABI24 | Right | 10 | 6 | 126 | IV |
| Adult 04 | NF2 | 53 | ABI24 | Right | 8 | 4 | 171 | D |
| Adult 05 | NF2 | 23 | ABI24 | Right | 11 | 6 | 100 | I A |
| Adult 06 | VS and Trauma | 37 | ABI24 | Left | 8 | 9 | 163 | D |
| Adult 07 | Trauma | 43 | ABI24 | Left | - | - | - | II B |
ABI = Auditory Brainstem Implant; CN = cranial nerve; CL = clinical units; NF2 = Neurofibromatosis Type 2; VS = Vestibular Schwannoma
Revision procedure performed
- no data available
2. Classification of ABI Electrode Array Position
Reconstructions of the electrode arrays demonstrated very clear images within the bony outlines of the subjects’ head (Figure 1, Figure 2). From these 3D maximum intensity projection (MIP) reconstructions in OsiriX, there is clear and detailed resolution of the array’s long and short axes of the array as well as the array’s cable. There is also a clear resolution of the reference electrode and the bony landmarks of the skull. Overall, the position and angle of the array could be computed with confidence.
Subjects had a wide variety of ABI array orientations (Table 2) (Figure 2). Two angles, V and T, were measured from lateral and posterior views, respectively. Mean angle for V was 42.42° ± 8.9, which indicates a posterior tilt to the array on average. Mean angle for T was 37.3° ± 15.95, which indicates a medial tilt to the array on average. The angles were separated into types (Figure 2) and the distribution of classifications is given in Tables 1 and 2. The majority of 14 electrode arrays were Type II (n=7) and Type A (n=6). Subjects whose array types fell within 90 degrees in both planes (Types A-C and I-III) were assigned combined types. Type IIB was the most common combination (n=4), followed by Type IIA (n=3) (Table 3).
Table 2.
Classification Types and Criteria
| Variable | Classification | n (adult=8, pediatric=6) | Criteria | Orientation | |
|---|---|---|---|---|---|
| INDIVIDUAL TYPES | Angle V | (Direction of Distal tip) | |||
|
| |||||
| Lateral View | Type I | 1, 2 | 71–90° | superior | |
| Type II | 3, 4 | 21–70° | superior-posterior | ||
| Type III | 1, 0 | 0–20° | posterior | ||
| Type IV | 2, 0 | Outside 0–90° | inferior | ||
| Angle T | |||||
|
| |||||
| Posterior View | Type A | 2, 4 | 71–90° | superior | |
| Type B | 3, 2 | 21–70° | superior-medial | ||
| Type C | 0, 0 | 0–20° | medial | ||
| Type D | 1, 0 | Outside 0–90° | lateral | ||
|
| |||||
| Variable | Definition | Mean distance (SEM) | N of subjects more than twice the SEM | ||
|
| |||||
| LINEAR MEASUREMEENT | D1 | Height from Basion | Superior: 2, 1 | ||
|
| |||||
| 1.82 cm (0.1), 1.37 cm (0.09) | |||||
| D2 | Distance from Midline | Lateral: 1, 1 | |||
|
| |||||
| 1.05 cm (0.14), 0.97 cm (0.08) | |||||
SEM = Standard Error of the Mean
Table 3.
Combined Classification Types in Subjects with Audiometric Data
| Combined Classification | n (Adult, Pediatric) | Mean number of active electrodes (n) | Mean number of side effects (n) | Mean T’s during ABI programming (n) |
|---|---|---|---|---|
| Type IA | (1, 1) | 12 (2) | 2.5 (2) | 98.4 CL (2) |
| Type IB | (0, 1) | 14 (1) | 3 (1) | 135.29 CL (1) |
| Type IIA | (0, 3) | 14 (3) | 0 (3) | 99.62 CL (2) |
| Type IIB* | (1, 1) | 11.5 (2) | 6 (1) | 142.36 CL (1) |
| Type IIIA | (1, 0) | 8 (1) | 5 (1) | 92 CL (1) |
| Type IV | (1, 0) | 12 (1) | 7 (1) | 125.5 CL (1) |
| Type D | (2, 0) | 12 (2) | 10.5 (2) | 165.79 CL (2) |
T = Perceptual threshold value for electrode on ABI programming maps
2 additional adult subjects with IIB did not have audiometric data
Subjects also had a variety of distances (Figure 3A). An example of variability is one adult subject with bilateral ABI’s, in which the array on the left side is much higher than the array on the right side (Figure 3B). Mean distances for D1 and D2 were 1.82 ± 0.10 cm and 1.05 ± 0.16 cm for adults. As expected from head size differences, pediatric subject D1 and D2 were smaller with mean distances of 1.37 ± 0.09 cm (42% smaller than adults) and 0.97 ± 0.08 cm (8% smaller than adults), respectively. The outliers (beyond two standard errors of the mean) for the distance measurements D1 were one adult and one pediatric subject with what we call “superior” electrodes (Figure 3C). The outliers for the distance measurements D2 were one adult and pediatric subject with what we call “lateral” electrodes (Figure 3D).
Figure 3.
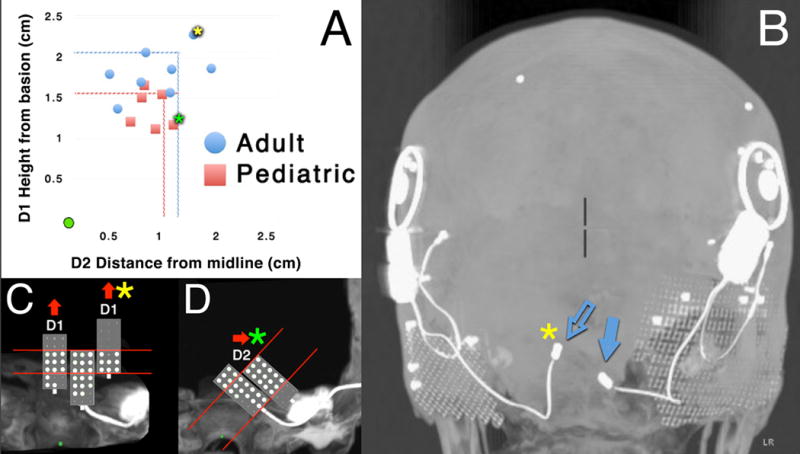
(A) Scatter plot of electrode array distances relative to the basion (origin of plot marked as the green circle). D1 is the superior distance from the basion to the array, while D2 is the lateral distance from the midline to the array. Dotted lines represent values twice that of the standard error of the mean (SEM). The yellow asterisk corresponds to an adult subject with a “superior” D1 value twice that of the SEM. The green asterisk corresponds to a pediatric subject with a “lateral” D2 value twice that of the SEM. (B) Posterior 3D MIP view of an NF2 adult subject demonstrating variation in position of the two ABI arrays on the left and right sides in this patient (blue arrows). The array on the left side (open blue arrow) was clearly in a superior position compared to the array on the right. It corresponds to the same data point with the yellow asterisk in A. (C) Enlarged semi-schematic posterior views demonstrate that outlying arrays (green and yellow asterisks) had large regions with electrodes turned off. Perceptual data are shown as large white dots for electrodes that evoke sound sensations and as small gray points for electrodes that were turned off because of side effects or little to no response at high current levels. For two arrays with “superior” D1 values, the most superior electrodes were turned off. The distribution of electrodes evoking sound sensations (white dots) is shifted inferiorly on the array compared to a typical electrode distribution (middle array, which shows typical distribution for 3 subjects with similarly-oriented Type A arrays). (D) The array with the green asterisk with a “lateral” D2 value had its lateral-most electrode turned off, in comparison to the typical electrode distribution for similar medially tilted Type B arrays.
3. Perception Data
Perception data were available for 6 adult subjects and 4 pediatric subjects, two of which had revisions (Table 1). Mean threshold levels depended on the array classification: thresholds were lowest for Type IIIA, IA, and IIA (92 CL, 98.4 CL, and 99.62 CL, respectively), higher for Type IB, Type IIB, and Type IV (135.29 CL, 142.36 CL, and 125.5 CL, respectively), and highest for Type D (165.79 CL) (Table 3). Both the range of thresholds (Table 1) and “heatmaps” (color plots with scalar values assigned to threshold levels for each electrode in an array) demonstrate evidence for a region with much lower thresholds compared to other areas for all Type A arrays, termed a “sweet spot”. For example, Figure 4 demonstrates the “sweet spot”, of a cluster of electrodes with lower thresholds (under 100 CL) surrounded by electrodes with increasing thresholds (100–150 CL). These arrays with a Type A classification do not tilt medially or laterally when observed from a standard posterior view. Type B and Type D arrays (the latter only seen in adult subjects) showed higher thresholds without discernable sweet spots.
Figure 4.

Enlarged posterior views of 6 arrays in pediatric subjects (top) and 6 arrays in adults (bottom). Accompanying perceptual data are shown in the color maps adjacent to the arrays: For the 21 electrodes, perceptual thresholds are coded according to the scales at left for electrodes that evoke sound sensations. For other electrodes, red X’s indicate electrodes that evoke side effects and white indicates electrodes that produce either no response or minimal response at very high current levels. Pediatric subjects SO1-R and SO2-R are revisions of SO1 and SO2, respectively.
All adult ABI subjects reported side effects associated with some electrodes, whereas side effects were observed for 2/6 pediatric subjects (both Type B). Type B arrays in those children had a consistent distribution of side effects in the distal and proximal tips of arrays (Figure 4). These side effects were adjacent to electrodes with higher threshold levels between 130–150 CL. Side effects were not observed in any pediatric Type A arrays. Secondly, side effects were present in Type IV (n=1), Type D (n=2) and Type B (n=2) arrays. Within each array, the number of side effects ranged from an average of 0 – 6 electrodes per array in all combined types; however, Type D arrays had the highest mean number of disabled electrodes with 10.5 per array (Table 3). In Type B and Type D arrays, the side effect or no response electrodes were adjacent to ones with high thresholds.
Subjects with array designations “superior” and “lateral” for D1 and D2, respectively, were of particular interest. For D1 “superior” arrays positioned higher along the brainstem (n=2), active electrodes were distributed more inferiorly on arrays (Figure 3A, C). One of these subjects was an adult with the “superior” array on the left side (Figure 3B, C) and an inactive ABI on the contralateral side that was much lower along the brainstem. For D2 “lateral” arrays (n=2), active electrodes were distributed more medially along the array (Figure 3B, D).
Lastly, pitch ranking (adults only) generally increased from low to high pitches distally across the length of the electrode for Types II, III, IV, and D (n=4/5) whose distal tips aimed posteriorly. Low pitches were usually ranked more anteriorly, while high pitches were ranked more posteriorly. This pattern suggested a tonotopic map of increasing pitch sensation from anterior to posterior across the cochlear nucleus (Figure 5). Of the five subjects, the one who did not show this pattern may have had confounding variables. In particular, this patient had baseline cognitive delay from neural sequalae of NF2, and did not provide reliable responses for pitch ranking (in comparison to more boolean yes/no responses for perception of auditory stimuli in electrodes).
Figure 5.

Spatial representation of pitch ranking for ABI electrodes evoking sound sensations. Vectors for 5 arrays from adult subjects were plotted in 3D using coordinates marked in OsiriX and superimposed in a 3D CT reconstruction. A heat map represents values of average upper pitch limit of the frequency allocation for electrodes in the MAP.
DISCUSSION
1. Visualization of the ABI electrode array in 3D using standardized CT reconstructions
This is the first study to classify ABI electrode array position using 3D CT reconstruction. Early studies have relied on imaging to confirm ABI electrode array position in the lateral recess of the fourth ventricle; however, detailed 3D orientation was not rigorously investigated (Lo et al. 1995; Shannon et al. 1993).
Using visual analysis of 3D CT reconstructions (following standardized reformatting and post-processing methodology) we accurately measured angles and distances of the ABI array relative to fixed bony landmarks within the skull to precisely characterize electrode position. In traditional CT imaging, such angles would be impossible to calculate unless the net vector of the electrode is in the plane being measured. 3D Maximum Intensity Projection in OsiriX overcomes this limitation by rendering only the highest-intensity pixel values in an orthogonal view, revealing the electrode orientation in 3D space. The use of OsiriX for accurate and reliable length measurements has been validated in other studies (Kim et al. 2012; Rosset et al. 2004).
The use of standardized landmarks such as the basion (Avci et al. 2015; Ladner et al. 2015; Moubayed et al. 2012) allows direct comparisons of positional data to be made across ABI subjects. The basion is the most medial, posterior and inferior segment of the basiocciput at the clival base. This landmark is unlikely to change significantly as pediatric subjects mature due to the nature of skull development. Ossification centers of the spheno-occipital synchrondroses extend rostrally towards the dorsum sellae, while the basion remains in the same position within the skull base (Zhang et al. 2011).
2. Classification of arrays using angle and distance measurements
We used reformatted images in a true axial plane so that electrode array position could be both resolved and measured. A major result of this study is that electrode arrays had variable orientations (Figure 2). Much of the data was collected using angular measurements, with the idea that angles are not affected by anatomic variations in head size that especially occur between pediatric and adult subjects. There may be sources of error in our measurements. If the 3D viewing angle was not within the standardized plane, there would be an error in the angular measurement. Additionally, angle T may have a greater propensity for error during measurement compared to angle V since the projection of the long axis of the array is most often in the coronal plane (Figure 1E). However, given that array angles ranged over greater than a 90-degree in each plane, small errors in measurement are unlikely to have a large effect on the classifications. Variability of cerebellopontine angle anatomy, the presence of brainstem abnormalities from tumor growth, and challenges with the blind surgical approach to place the ABI electrode likely contributes to the range of electrode orientation despite the established landmarks of cranial nerves VIII, IX, and the choroid plexus to guide initial device placement (Vincent 2012).
Distances D1 and D2 were chosen for measuring position in the coronal and sagittal planes relative to the basion. Due to head size variation, comparisons between pediatric and adult subjects were especially difficult. Normalization of data could be developed to enable such comparisons. Finally, another limitation of pediatric/adult comparison is that the adult subjects underwent tumor removal surgery, and this surgery or the tumor may have changed the brainstem anatomy so to preclude any comparison.
3. Relation of ABI electrode array position with perception
Multiple studies have reported variable distributions of active electrodes on arrays (Herrmann et al. 2015; Wackym et al.); however, the present study is the first to represent perceptual data spatially. These data suggest that some ABI array orientations are associated with perceptual measures. For example, compared to other classification types, Type A arrays in pediatric subjects appear to have regions of lower thresholds (Figure 4). A cluster of electrodes with lower thresholds may suggest an area on the array that is more optimally positioned over the brainstem surface for stimulation of the cochlear nucleus, and would appear to abut it superiorly and inferiorly (Figure 4). In addition, no side effects were observed for Type A arrays in pediatric subjects. This finding, however, needs to be viewed with caution in light of the inability of children with insufficient language to report side effects and the difficulty of observing the most common ABI non-auditory sensation of tingling. Conversely, Type B and Type D arrays had electrodes that were associated with side effects; such electrodes were disabled during device programming. Type D arrays had twice the number of disabled electrodes due to side effects compared to any other type.
Non-auditory side effects almost certainly correspond to activation of anatomic structures adjacent to the cochlear nucleus. In one pediatric subject with a Type B electrode, an electrode (#22) located superior and medial relative to the middle of the array was disabled due to facial twitching. Anatomically, the corresponding superficial structure located in the medial pons is the facial colliculus, whereby the seventh cranial nerve wraps posteriorly around the abducens nucleus (Figure 6). Similarly, in another pediatric subject with a Type B array, electrodes inferior and lateral relative to the middle of the array (#2–4) were disabled due to gagging during sedated activation. These electrodes are in proximity to the nucleus ambiguous in the lateral rostral medulla. The dorsal root entry zone for cranial nerve X could elicit similar side effects with direct electrical stimulation; however, all pediatric subject operative reports stated that ABI arrays were placed fully through the foramen of Luschka. This positions arrays within the lateral recess of the fourth ventricle rather than abutting cranial nerve rootlets. Lastly, two adult subjects with type D (laterally tilted) arrays experienced somatosensory side effects in the trigeminal nerve distribution in response to stimulation of distal array electrodes. One subject in particular reported teeth tingling and sensations consistent with the V3 branch of the trigeminal nerve. Corresponding anatomic structures lateral to the dorsal cochlear nucleus in the brainstem are the anterior and posterior trigeminothalamic tracts, which include sensory fibers from this dermatomal distribution. These ideas about which structures were associated with side effects cannot be confirmed because the exact location over the brainstem is not known. Future studies that align CT and MRI images and superimpose electrode arrays with neuroanatomic structures are needed to make this association.
Figure 6.

3D model showing a hypothetical interaction between an ABI electrode array and the dorsal brainstem surface. A cluster of electrodes, the “sweet spot”, has lower T values (shown in blue) because it may be closest to the dorsal cochlear nucleus. Adjacent electrodes with higher T values (shown in red) are more distant. The electrode array Illustrated is a Type A electrode array (without tilt medially or laterally). For Type B electrodes with medial tilt, adjacent brainstem structures that might be contacted include the facial colliculus superiorly and medially, and the rostral medulla inferiorly and laterally.
Perceptual measures were also found to be associated with electrode distances from fixed bony landmarks. Arrays with D1 or D2 values twice the standard error of the mean demonstrated predictable changes in the distribution of active electrodes compared to other arrays based on their coordinates. For D1, “superior” electrodes positioned more relatively higher up along the brainstem had more active electrodes inferiorly on the array (Figure 3C). For D2, “lateral” electrodes positioned more laterally away from the midline had active electrodes located more medially on the electrode (Figure 3D). These observations in subjects with large values for D1 and D2 may provide insight for activation and initial MAP programming in future subjects.
4. Implications for ABI array placement
Currently, the ABI electrode array is surgically placed through the foramen of Luschka into the lateral recess of the fourth ventricle without the benefit of surface landmarks of the cochlear nucleus. Visualization can be improved with endoscopic assistance prior to placement (Komune et al. 2015; Wackym et al.), but the overall view during placement of the electrode array is very limited. Intraoperative eABR is utilized to optimize placement by identifying components of the eABR that are associated with auditory perception (Komune et al. 2015; Wackym et al.).
Future CT scans might predict the quality of array placement prior to ABI activation. Furthermore, imaging modalities such as plain film x-ray, scout fluoroscopy, or portable CT imaging could be utilized intraoperatively to guide ABI placement. In this scenario, ABI placement could be potentially optimized using both structural and electrophysiologic navigation at the time of surgery. However, patients with distorted brainstem anatomy as a result of tumors may not be good candidates for this analysis, and variation in patient head size could also complicate such an approach.
CONCLUSION
This study is the first to systematically analyze postoperative ABI electrode array position. Array position can be reliably observed and objectively measured using 3D CT reconstructions and fixed bony landmarks and can be used to correlate with the range of audiologic outcomes seen in pediatric and adult ABI users.
Acknowledgments
Supported by the Bertarelli Foundation and by NIH grant DC01089.
Footnotes
Conflict of Interest: None
Disclosures: None
References
- Ahn JH, Lim HW, Lee KS. Hearing improvement after cochlear implantation in common cavity malformed cochleae: long-term follow-up results. Acta Otolaryngol. 2011;131:908–913. doi: 10.3109/00016489.2011.570786. [DOI] [PubMed] [Google Scholar]
- Avci S, Ergun T, Aydin E, et al. Sex differences in adult craniofacial parameters. Surg Radiol Anat. 2015 doi: 10.1007/s00276-015-1477-9. [DOI] [PMC free article] [PubMed] [Google Scholar]
- Behr R, Colletti V, Matthies C, et al. New outcomes with auditory brainstem implants in NF2 patients. Otol Neurotol. 2014;35:1844–1851. doi: 10.1097/MAO.0000000000000584. [DOI] [PubMed] [Google Scholar]
- Bloom JD, Rizzi MD, Germiller JA. Real-time intraoperative computed tomography to assist cochlear implant placement in the malformed inner ear. Otol Neurotol. 2009;30:23–26. doi: 10.1097/MAO.0b013e31818d1cd2. [DOI] [PubMed] [Google Scholar]
- Burchiel KJ, McCartney S, Lee A, et al. Accuracy of deep brain stimulation electrode placement using intraoperative computed tomography without microelectrode recording. J Neurosurg. 2013;119:301–306. doi: 10.3171/2013.4.JNS122324. [DOI] [PubMed] [Google Scholar]
- Colletti V, Shannon RV. Open set speech perception with auditory brainstem implant? Laryngoscope. 2005;115:1974–1978. doi: 10.1097/01.mlg.0000178327.42926.ec. [DOI] [PubMed] [Google Scholar]
- Colletti L, Shannon RV, Colletti V. The development of auditory perception in children after auditory brainstem implantation. Audiol Neurootol. 2014;19:386–394. doi: 10.1159/000363684. [DOI] [PMC free article] [PubMed] [Google Scholar]
- Colletti V. Auditory outcomes in tumor vs. nontumor patients fitted with auditory brainstem implants. Adv Otorhinolaryngol. 2006;64:167–185. doi: 10.1159/000094651. [DOI] [PubMed] [Google Scholar]
- Colletti V, Carner M, Miorelli V, et al. Auditory brainstem implant (ABI): new frontiers in adults and children. Otolaryngol Head Neck Surg. 2005;133:126–138. doi: 10.1016/j.otohns.2005.03.022. [DOI] [PubMed] [Google Scholar]
- Cronin CG, Lohan DG, Mhuircheartigh JN, et al. CT evaluation of Chamberlain’s, McGregor’s, and McRae’s skull-base lines. Clin Radiol. 2009;64:64–69. doi: 10.1016/j.crad.2008.03.012. [DOI] [PubMed] [Google Scholar]
- Dirr F, Hempel JM, Krause E, et al. Value of routine plain x-ray position checks after cochlear implantation. Otol Neurotol. 2013;34:1666–1669. doi: 10.1097/MAO.0b013e3182a09cc3. [DOI] [PubMed] [Google Scholar]
- Herrmann BS, Brown MC, Eddington DK, et al. Auditory brainstem implant: electrophysiologic responses and subject perception. Ear Hear. 2015;36:368–376. doi: 10.1097/AUD.0000000000000126. [DOI] [PMC free article] [PubMed] [Google Scholar]
- Hitselberger WE, House WF, Edgerton BJ, et al. Cochlear nucleus implants. Otolaryngol Head Neck Surg. 1984;92:52–54. doi: 10.1177/019459988409200111. [DOI] [PubMed] [Google Scholar]
- Kim G, Jung HJ, Lee HJ, et al. Accuracy and reliability of length measurements on three-dimensional computed tomography using open-source OsiriX software. J Digit Imaging. 2012;25:486–491. doi: 10.1007/s10278-012-9458-6. [DOI] [PMC free article] [PubMed] [Google Scholar]
- Komune N, Yagmurlu K, Matsuo S, et al. Auditory brainstem implantation: anatomy and approaches. Neurosurgery. 2015;11(Suppl 2):306–320. doi: 10.1227/NEU.0000000000000736. discussion 320–301. [DOI] [PubMed] [Google Scholar]
- Kong WJ, Cheng HM, Ma H, et al. Evaluation of the implanted cochlear implant electrode by CT scanning with three-dimensional reconstruction. Acta Otolaryngol. 2012;132:116–122. doi: 10.3109/00016489.2011.626794. [DOI] [PubMed] [Google Scholar]
- Kwong Y, Rao N, Latief K. Craniometric measurements in the assessment of craniovertebral settling: are they still relevant in the age of cross-sectional imaging? AJR Am J Roentgenol. 2011;196:W421–425. doi: 10.2214/AJR.10.5339. [DOI] [PubMed] [Google Scholar]
- Ladner TR, Dewan MC, Day MA, et al. Posterior odontoid process angulation in pediatric Chiari I malformation: an MRI morphometric external validation study. J Neurosurg Pediatr. 2015;16:138–145. doi: 10.3171/2015.1.PEDS14475. [DOI] [PubMed] [Google Scholar]
- Lo WW, Tasaka A, Zink B, et al. A simple CT method for location of auditory brain stem implant electrodes. AJNR Am J Neuroradiol. 1995;16:599–601. [PMC free article] [PubMed] [Google Scholar]
- McRae DL, Barnum AS. Occipitalization of the atlas. Am J Roentgenol Radium Ther Nucl Med. 1953;70:23–46. [PubMed] [Google Scholar]
- McSorley A, Freeman SR, Ramsden RT, et al. Subjective outcomes of auditory brainstem implantation. Otol Neurotol. 2015;36:873–878. doi: 10.1097/MAO.0000000000000671. [DOI] [PubMed] [Google Scholar]
- Moubayed SP, Duong F, Ahmarani C, et al. A novel technique for malar eminence evaluation using 3-dimensional computed tomography. Arch Facial Plast Surg. 2012;14:403–407. doi: 10.1001/archfacial.2012.510. [DOI] [PubMed] [Google Scholar]
- Noij KS, Kozin ED, Sethi R, et al. Systematic Review of Nontumor Pediatric Auditory Brainstem Implant Outcomes. Otolaryngol Head Neck Surg. 2015 doi: 10.1177/0194599815596929. [DOI] [PubMed] [Google Scholar]
- Puram SV, Barber SR, Kozin ED, et al. Outcomes Following Pediatric Auditory Brainstem Implant Surgery: Early Experiences in a North American Center. Otolaryngol Head Neck Surg. 2016 doi: 10.1177/0194599816637599. [DOI] [PubMed] [Google Scholar]
- Rosset A, Spadola L, Ratib O. OsiriX: an open-source software for navigating in multidimensional DICOM images. J Digit Imaging. 2004;17:205–216. doi: 10.1007/s10278-004-1014-6. [DOI] [PMC free article] [PubMed] [Google Scholar]
- Sennaroglu L, Saatci I. A new classification for cochleovestibular malformations. Laryngoscope. 2002;112:2230–2241. doi: 10.1097/00005537-200212000-00019. [DOI] [PubMed] [Google Scholar]
- Shannon RV, Fayad J, Moore J, et al. Auditory brainstem implant: II. Postsurgical issues and performance. Otolaryngol Head Neck Surg. 1993;108:634–642. doi: 10.1177/019459989310800603. [DOI] [PubMed] [Google Scholar]
- Svrakic M, Friedmann DR, Berman PM, et al. Measurement of Cochlear Implant Electrode Position From Intraoperative Post-insertion Skull Radiographs: A Validation Study. Otol Neurotol. 2015;36:1486–1491. doi: 10.1097/MAO.0000000000000852. [DOI] [PMC free article] [PubMed] [Google Scholar]
- Vincent C. Auditory brainstem implants: how do they work? Anat Rec (Hoboken) 2012;295:1981–1986. doi: 10.1002/ar.22588. [DOI] [PubMed] [Google Scholar]
- Wackym PA, Runge-Samuelson CL, Firszt JB. Auditory brainstem implantation. Operative Techniques in Otolaryngology-Head and Neck Surgery. 16:159–163. [Google Scholar]
- Waring MD. Auditory brain-stem responses evoked by electrical stimulation of the cochlear nucleus in human subjects. Electroencephalogr Clin Neurophysiol. 1995;96:338–347. doi: 10.1016/0168-5597(95)00022-k. [DOI] [PubMed] [Google Scholar]
- Waring MD. Properties of auditory brainstem responses evoked by intra-operative electrical stimulation of the cochlear nucleus in human subjects. Electroencephalogr Clin Neurophysiol. 1996;100:538–548. doi: 10.1016/s0168-5597(96)96061-x. [DOI] [PubMed] [Google Scholar]
- Waring MD, Ponton CW, Don M. Activating separate ascending auditory pathways produces different human thalamic/cortical responses. Hear Res. 1999;130:219–229. doi: 10.1016/s0378-5955(99)00016-7. [DOI] [PubMed] [Google Scholar]
- Yücel E, Aslan F, Özkan HB, Sennaroğlu L. Recent Rehabilitation Experience with Pediatric ABI Users. The Journal of International Advanced Otology. 2015 doi: 10.5152/iao.2015.915. [DOI] [PubMed] [Google Scholar]
- Zhang Q, Wang H, Udagawa J, et al. Morphological and morphometric study on sphenoid and basioccipital ossification in normal human fetuses. Congenit Anom (Kyoto) 2011;51:138–148. doi: 10.1111/j.1741-4520.2011.00322.x. [DOI] [PubMed] [Google Scholar]