

Abstract
Background and Purpose
Gain of function mutations in TRPC6 channels can cause autosomal dominant forms of focal segmental glomerulosclerosis (FSGS). Validated inhibitors of TRPC6 channels that are biologically active on FSGS‐related TRPC6 mutants are eagerly sought.
Experimental Approach
We synthesized new TRPC6‐inhibiting modulators from larixol, a resiniferous constituent of Larix decidua, and tested the potency and selectivity in cell lines stably expressing various TRPC channel isoforms. Channel activation was followed by Ca2+ influx analyses and electrophysiological recordings. The most promising compound larixyl carbamate (LC) was tested on native TRPC6 channels and TRPC6 constructs carrying FSGS‐related point mutations.
Key Results
LC exhibited an about 30‐fold preference for TRPC6 over TRPC3 channels and a fivefold preference for TRPC6 over TRPC7 channels. Six FSGS‐related TRPC6 mutants, including the highly active M132T and R175Q variants, were strongly inhibited by 1 μM LC. Surprisingly, no TRPC6‐related Ca2+ signals were detectable in primary murine podocytes, or in acutely isolated glomeruli. in these preparations. Quantitative PCR revealed a 20‐fold to 50‐fold lower abundance of TRPC6 transcripts in rat or mouse podocytes, compared with pulmonary artery smooth muscle cells from the same species. Accordingly, electrophysiological recordings demonstrated that DAG‐induced currents in murine podocytes are very small, but sensitive to LC.
Conclusions and Implications
In spite of their low abundance in native podocytes, native TRPC6 channels are targetable using larixol‐derived TRPC6 inhibitors. As observed with wild‐type TRPC6 channels, FSGS‐related TRPC6 mutants were sensitive to the newly developed inhibitors, paving the way for experimental therapies.
Abbreviations
- [Ca2+]i
intracellular Ca2+ concentration
- FSGS
focal segmental glomerulosclerosis
- HBS
HEPES buffered saline
- HEKhTRPC6‐YFP
HEK293 cells stably expressing human TRPC6 C‐terminally fused to yellow fluorescent protein
Introduction
Focal segmental glomerulosclerosis (FSGS) is one of the leading causes of steroid‐resistant nephrotic syndrome and terminal kidney failure in children and adolescents. FSGS is a histopathological finding, which in most cases correlates with podocyte injury. In FSGS, the slit diaphragm formed by intercalating foot processes of podocytes is severely disturbed. As a consequence, the filtration barrier cannot retain proteins, and a progressive proteinuria develops, finally culminating in end‐stage renal disease and nephrotic syndrome. Inheritable forms of FSGS can be caused by missense or nonsense mutations in proteins that are enriched in podocyte foot processes (e.g. nephrin, podocin or CD2‐associated protein) or in proteins that affect podocyte function in more complex and indirect ways (Sprangers et al., 2016). Among these mutations, the identification of missense mutations in the gene encoding the cation channel TRPC6 in autosomal dominant FSGS establishes this ion channel as a potential pharmacological target (Winn et al., 2005; El and Reiser, 2011). Both gain of function and loss of function mutations in TRPC6 proteins have been identified in autosomal dominant forms of FSGS (Riehle et al., 2016). Of note, the onset of disease seems to correlate with functional properties of the mutated TRPC6 channels (Gigante et al., 2011). A M132T mutant, for example, causes an early onset of FSGS in the childhood, which correlates with a massively increased channel activity of this mutant (Heeringa et al., 2009).
The ion channel TRPC6 is one of the TRPC channel family, comprising seven members TRPC1–TRPC7, and is a Ca2+ permeable, but poorly selective cation channel. It is regulated in a PLC‐dependent manner, including a direct activation by 1,2‐diacylglycerols (DAGs) (Hofmann et al., 1999; Dietrich and Gudermann, 2014). As shown for TRPV1 channels, a functional TRPC6 channel complex probably consists of four subunits. In cells that primarily express TRPC6 protein, four subunits assemble into a functionally active pore complex. If co‐expressed with TRPC3 or TRPC7 protein, heteromeric TRPC6‐bearing channels complexes may form and mediate receptor‐stimulated cation currents (Hofmann et al., 2002). In TRPC6‐linked FSGS, the autosomal‐dominant inheritance of the disease implies that mutated TRPC6 subunits may either form separate channel complexes or they may oligomerize together with the gene product of the wild‐type TRPC6 allele to form channel complexes that contain 1–3 mutated TRPC6 subunits.
TRPC6 channels are expressed in a variety of tissues and cell types, including vascular smooth muscle cells, mesangial cells and podocytes. Although the presence of TRPC6 in podocytes has been demonstrated by several groups, there is considerable variability concerning the abundance of the channel protein and the size of functional responses to TRPC6 channel activators (Anderson et al., 2014; Abkhezr et al., 2015; Kalwa et al., 2015). As dysregulation of TRPC6 channel expression in podocytes can occur in response to various stimuli, TRPC6 channels may also play a seminal role in secondary forms of FSGS. Conditions that cause up‐regulation or positively modulate the activation of TRPC6 channels include puromycin treatment, hyperglycaemia, long‐term administration of angiotensin II, TNF‐α signalling, reperfusion injury or exposure to oxidative stress (Wang et al., 2009; Kim et al., 2012; Abkhezr et al., 2015; Ilatovskaya and Staruschenko, 2015; Szabo et al., 2015).
We have recently identified larixyl acetate as a potent and TRPC6‐preferring inhibitor (Urban et al., 2016). We have now investigated if biological activity can be demonstrated on native TRPC6 channel complexes in podocytes and on TRPC6 variants carrying mutations that are linked to FSGS. In addition, to further improve the properties of the compound, we sought to replace the unstable acetyl ester by a carbamate moiety. The resulting semi‐synthetic compound larixyl carbamate (LC) was as potent as larixyl acetate, but its selectivity for TRPC6 over TRPC3 channels was slightly enhanced. In primary podocyte cultures or in freshly isolated glomeruli, fluorometric Ca2+ assays failed to demonstrate functional expression of TRPC6 channels. Applying quantitative RT‐PCR and Western blot analysis, a very low expression of TRPC6 channels was found in podocytes compared with pulmonary artery smooth muscle cells. Finally, electrophysiological recordings were applied to demonstrate TRPC6 channel currents in podocytes and their susceptibility to pharmacological inhibition by larixol derivatives.
Methods
Isolation and derivatization of larixol
Isolation of larixol
Larch turpentine (25 g) from Larix decidua (Kremer Pigmente, Aichstetten, Germany) was dissolved in 100 mL n‐hexane, and 50 mL of 1 M KOH was added. The formed precipitate was filtered through Celite. The organic phase was washed with 1 M NaOH and dried over magnesium sulfate, and n‐hexane was removed under reduced pressure. The yellow, oily residue was dissolved in 1 M KOH in EtOH (300 mL) and refluxed for 3 h. The solution was evaporated to half of its volume, 100 mL of water was added and the solution was evaporated to an oily residue. To the latter, diethyl ether (100 mL) was added. The aqueous phase was separated and extracted with diethyl ether. The combined organic phases were dried over magnesium sulfate and, after filtration, solvents were removed yielding, after crystallization from cyclohexane (30 mL), 2.99 g of larixol.
Larixol derivatives were prepared according to the following protocols. All compounds were purified by chromatography on silica to >95%. Purity was determined by TLC and NMR spectroscopy and for the larixyl‐6‐carbamate, larixyl‐6‐formate and methyl ether by elemental analysis. NMR data were assigned by using two‐dimensional experiments, namely, H,H‐COSY, HSQC and HMBC experiments.
Larixyl diacetate
Larixol (50 mg, 0.16 mmol and 1.0 equiv) was dissolved under nitrogen in dimethylaniline (1.5 mL), and acetyl chloride (50 μL, 0.65 mmol and 4.0 equiv) was added. The solution was stirred at room temperature, and further, acetyl chloride (25 μL) was added after 2 and 4 h. After 16 h, further dimethylaniline (1 mL) and acetyl chloride (25 μL) were added, and the mixture was heated to 90°C for 3 h. The reaction was quenched by addition of water, extracted with dichloromethane, washed with saturated sodium bicarbonate solution and dried over magnesium sulfate, and the solvent was removed at reduced pressure. The obtained remainder was purified by chromatography on silica (n‐hexane: ethyl acetate 95:5 → 90:10 (v/v)), yielding 29.7 mg (48%) of the diacetate product. R f = 0.64 (n‐hexane: ethyl acetate 4:1 (v/v)). 1H NMR (300 MHz, CDCl3) δ [ppm] = 0.74 (s, 3H, 20‐CH3), 0.87 (s, 3H, 18/19‐CH3), 1.01 (s, 3H, 18/19‐CH3), 1.01–1.56 (m, 12H), 1.52 (s, 3H, 16‐CH3), 1.41 (d, J = 12 Hz, 1H, 5‐CH), 2.01 (s, 3H, Ac–CH3), 2.03 (s, 3H, Ac–CH3) 2.68 (dd, J = 12 Hz, 6 Hz, 1H, 7‐CH), 4.62 (m, 1H, CH2), 4.92 (m, 1H, CH2), 5.03 (dt, J = 12 Hz, 6 Hz, 1H, 6‐CH) 5.10 (s,1H), 5.14 (m, 1H), 5.96 (dd, J = 18 Hz, 12 Hz, 1H, 14‐CH); 13C NMR (75 MHz, CDCl3) δ [ppm] = 16.2 (20‐CH3), 17.9 (11‐CH2), 19.3 (2‐CH2), 22.2 (Ac–CH3), 22.4 (Ac–CH3), 22.7 (18/19‐CH3), 23.8 (16‐CH3), 33.7 (4‐C), 36.4 (18/19‐CH3), 39.2 (1‐CH2), 39.4 (10‐CH), 40.1 (12‐CH2), 43.7 (3‐CH2), 44.4 (7‐CH2), 56.5 (9‐CH), 57.8 (5‐CH), 73.5 (6‐CH), 83.5 (13‐C), 109.7 (17‐CH2), 113.4 (15‐CH2), 142.0 (14‐CH), 145.4 (8‐C), 170.2 (Ac–CO), 170.3 (Ac–CO). HRMS [M + Na+] 413.26678, found: 413.26623 m/z.
Larixyl‐6‐propionate
Larixol (50 mg, 0.16 mmol and 1 equiv) was dissolved under nitrogen in dichloromethane (3 mL), and the solution was cooled to 0°C. After addition of propionyl chloride (20 μL, 0.24 mmol and 1.5 equiv) and diisopropylethylamine (100 μL), the reaction was allowed to proceed at room temperature under stirring for 16 h. The reaction was quenched by addition of water, and the mixture was extracted with diethyl ether. Combined organic phases were washed with 1 M HCl, saturated bicarbonate solution and brine and dried over magnesium sulfate. After filtration, solvents were removed, and the product was purified by silica chromatography (n‐hexane: ethyl acetate 9:1 (v/v)), yielding 23.8 mg (41%) of the larixyl‐6‐propionate. R f = 0.46 (hexane: EE 9:1 (v/v)). 1H NMR (300 MHz, CDCl3) δ [ppm] = 0.74 (s, 3H, 20‐CH3), 0.86 (s, 3H, 18/19‐CH3), 1.00 (s, 3H, 18/19‐CH3), 1.03–2.00 (m), 1.13 (t, J = 6 Hz, 3H, propionyl–CH3) 1.27 (s, 3H, 16‐CH3), 1.40 (d, J = 12 Hz, 1H, 5‐CH), 2.01 (m, 1H, 7‐CH2), 2.28 (dq, J = 6 Hz, 3 Hz, 2H, propionyl–CH2) 2.66 (dd, J = 12 Hz, 6 Hz, 1H, 7‐CH), 4.63 (s, 1H, 17‐CH2), 4.77 (s, 1H, 17‐CH2), 4.97–5.06 (m, 2H, 15‐CH2, 6‐CH), 5.20 (dd, J = 18 Hz, 1H, 15‐CH2), 5.90 (dd, J = 18 Hz, 12 Hz, 1H, 14‐CH); 13C NMR (75 MHz, CDCl3) δ [ppm] = 9.3 (propionyl–CH3), 16.2 (20‐CH3), 18.2 (11‐CH2), 19.2 (2‐CH2), 22.2 (18/19‐CH3), 28.0 (16‐CH3), 28.6 (propionyl–CH2), 33.3 (4‐C), 36.4 (18/19‐CH3), 39.4 (1‐CH2), 40.1 (10‐CH), 41.6 (12‐CH2), 43.7 (3‐CH2), 44.4 (7‐CH2), 56.6 (9‐CH), 57.8 (5‐CH), 73.3 (6‐CH), 73.8 (13‐C), 109.7 (17‐CH2), 112.0 (15‐CH2), 144.6 (14‐CH), 145.4 (8‐C), 173.7 (propionyl–CO); HRMS [M + Na+] 385.2719, found: 385.27132 m/z.
The same protocol furnished 4.6 mg (7%) of the dipropionate. R f = 0.60 (n‐hexane: ethyl acetate 9:1 (v/v)). 1H NMR (300 MHz, CDCl3) δ [ppm] = 0.74 (s, 3H, 20‐CH3), 0.87 (s, 3H, 18/19‐CH3), 1.01 (s, 3H, 18/19‐CH3), 1.01–1.56 (m, 12H), 1.13 (m, 6H, 2 x propionyl–CH3), 1.52 (s, 3H, 16‐CH3), 1.41 (d, J = 12 Hz, 1H, 5‐CH), 2.25–2.35 (m, 4H, 2 x propionyl–CH2), 2.68 (dd, J = 12 Hz, 6 Hz, 1H, 7‐CH), 4.60 (m, 1H), 4.93 (m, 1H) 5.00–5.16 (m, 3H), 5.96 (dd, J = 18 Hz, 12 Hz, 1H, 14‐CH); 13C NMR (75 MHz, CDCl3) δ [ppm] = 8.0 (propionyl–CH3), 8.3 (propionyl–CH3), 16.7, 18.0, 21.4, 22.6, 27.4, 27.6, 28.3, 28.7, 35.2, 38.0, 38.2, 38.8, 42.4, 43.2, 55.3, 56.5, 72.0 (6‐CH), 81.9 (13‐C), 109.4 (17‐CH2), 112.1 (15‐CH2), 140.9 (14‐CH), 143.3 (8‐C), 172.3 (propionyl–CO), 172.5 (propionyl–CO); HRMS [M + Na+] 441.29808, found: 441.29753 m/z.
Larixyl‐6‐carbamate
Larixol (200 mg, 0.653 mmol and 1.0 equiv) was dissolved in dichloromethane (3 mL), and 2,2,2‐trichloroacetyl isocyanate (78 μL, 0.653 mmol and 1.0 equiv) was added and stirred at room temperature for 1 h. Then, the solvents were removed with a rotary evaporator, and the dry product was dissolved in methanol (3 mL). Potassium carbonate was added (97 mg, 0.702 mmol and 1.08 equiv), and the suspension was stirred at room temperature for 1 h. Again, the reaction mixture was evaporated to dryness. The remainder was suspended in 5 mL water and extracted three times with diethyl ether (10 mL each). Combined organic phases were washed twice with water and once with brine, dried over sodium sulfate and evaporated to dryness. The solid remainder was purified by flash chromatography over silica with ethyl acetate/n‐hexane 1:1 as eluent, furnishing the product as a white powder (167 mg, 73% yield). Mp: 122°C. R f = 0.52 (n‐hexane: ethyl acetate 1:1 (v/v)); 1H NMR (500 MHz, CDCl3) δ [ppm] = 0.73 (s, 3H, 20‐CH3), 0.91 (s, 3H, 18/19‐CH3), 0.99 (s, 3H, 18/19‐CH3), 1.00–1.08 (m, 1H, 12‐CH2), 1.18–1.38 (m, 8H), 1.41–1.62 (m, 5H), 1.69–1.78 (m, 2H), 1.99–2.08 (m, 1H, 7‐CH2), 2.71 (dd, J = 12.3 Hz, 5.2 Hz, 1H, 7‐CH2), 4.62 (q, J = 1.6 Hz, 1H, 17‐CH2), 4.67 (s, 2H, OCONH2), 4.87–4.94 (m, 2H, 17‐CH2, H‐6), 5.04 (dd, J = 10.8 Hz, 1.2 Hz, 1H, 15‐CH2), 5.19 (dd, J = 17.4 Hz, 1.3 Hz, 1H, 15‐CH2), 5.89 (dd, J = 17.4 Hz, 10.8 Hz, 1H, H‐14); 13C NMR (126 MHz, CDCl3) δ 16.04 (20‐CH3), 18.10, 19.16, 22.51 (18/19‐CH3), 27.78, 33.65, 36.31 (18/19‐CH3), 39.24 (12‐CH2), 39.90 (10‐CH), 41.42, 43.67, 44.68, 56.45, 57.97, 73.58 (C‐13), 74.17 (6‐CH), 109.51 (17‐CH2), 111.77 (15‐CH2), 144.47 (C‐8), 145.28 (14‐CH), 156.10 (C═O); HRMS [M + Na+] 372.251, found: 372.253 m/z; anal. calcd for C21H35NO3: C, 72.17; H, 10.09; N, 4.01; found: C, 71.54; H, 9.858; N, 3.864.
Larixyl‐6‐formate
Larixol (50 mg, 0.16 mmol and 1.0 equiv) was dissolved in dry dichloromethane (5 mL), and formic acid (13 μL, 0.326 mmol and 2.0 equiv) and 4‐dimethylaminopyridine (2 mg, 0.016 mmol and 0.1 equiv) were added. The solution was cooled to 0°C, N,N'‐dicyclohexylcarbodiimide (44 mg, 0.21 mmol and 1.3 equiv) was added and the solution was stirred for 15 min at 0°C. Thereafter, the icebath was removed, and the reaction stirred overnight at room temperature. The precipitated urea was filtered off, washed with dichloromethane and the filtrate evaporated under reduced pressure. The obtained remainder was purified by flash chromatography on silica (n‐hexane: 85:15 (v/v)), yielding 48 mg (88%) of the larixyl‐6‐formate as white crystals. Mp. 90°C. R f = 0.48 (n‐hexane: ethyl acetate 3:1 (v/v)). 1H NMR (700 MHz, CDCl3) δ [ppm] = 0.77 (d, J = 0.7 Hz, 3H, 20‐CH3), 0.91 (s, 3H, 18/19‐CH3), 1.06 (s, 3H, 18/19‐CH3), 1.09 (td, J = 12.9 Hz, 4.2 Hz, 1H), 1.24–1.33 (m, 5H), 1.34–1.42 (m, 3H), 1.47–1.52 (m, 2H), 1.53–1.63 (m, 2H), 1.63–1.66 (m, 1H), 1.74–1.80 (m, 2H), 2.09–2.15 (m, 1H, 7‐CH2), 2.73 (dd, J = 12.3 Hz, 5.1 Hz, 1H, 7‐CH2), 4.69 (d, J = 1.6 Hz, 1H, 17‐CH2), 4.97 (d, J = 1.6 Hz, 1H, 17‐CH2), 5.08 (dd, J = 10.8 Hz, 1.2 Hz, 1H, 15‐CH2), 5.16–5.21 (m, 1H, H‐6), 5.22 (dd, J = 17.4 Hz, 1.2 Hz, 1H, 15‐CH2), 5.93 (dd, J = 17.4 Hz, 10.8 Hz, 1H, H‐14), 8.10 (d, J = 0.9 Hz, 1H, COH); 13C NMR (176 MHz, CDCl3) δ 15.93 (20‐CH3), 18.01, 18.97, 22.37 (18/19‐CH3), 27.80 (16‐CH3), 33.70, 36.31 (18/19‐CH3), 39.10, 39.93, 41.27, 43.50, 44.24, 56.32, 57.47 (9‐CH), 73.30 (5‐CH), 73.33 (C‐6), 73.46 (C‐13), 109.85 (17‐CH2), 111.72 (15‐CH2), 144.02 (8‐C), 145.14 (14‐CH), 160.64 (CHO); HRMS [M + Na+] 357.24, found: 357.242 m/z; anal. calcd for C21H34O3: C, 75.41; H, 10.25; found: C, 75.43; H, 9.66.
Larixyl‐6‐phenylacetate
Larixol (50 mg, 0.16 mmol and 1.0 equiv) was dissolved in dry dichloromethane (3 mL), and phenylacetic acid (33 mg, 0.245 mmol and 1.5 equiv) and N,N'‐dicyclohexylcarbodiimide (50 mg, 0.245 mmol and 1.5 equiv) were added. After 5 min, 4‐dimethylaminopyridine (4 mg, 0.032 mmol and 0.2 equiv) was added, and the solution was stirred overnight at room temperature. The precipitated urea was filtered off, washed with dichloromethane and the organic phase extracted with 15 mL NaHCO3. The organic phase was dried over MgSO4 and evaporated under reduced pressure. The product was purified by flash chromatography on silica (n‐hexane: ethyl acetate 85:15 (v/v)), yielding 37 mg (53%) of the larixyl‐6‐phenylacetate as colourless oil. R f = 0.52 (n‐hexane: ethyl acetate 3:1 (v/v)). 1H NMR (700 MHz, CDCl3) δ [ppm] = 0.75 (s, 3H, 20‐CH3), 0.87 (s, 3H, 18/19‐CH3), 0.98 (s, 3H, 18/19‐CH3), 1.07 (td, J = 12.7 Hz, 4.1 Hz, 1H, 12‐CH2), 1.22–1.32 (m, 5H), 1.32–1.41 (m, 3H), 1.44 (d, J = 11.3 Hz, 1H, H‐5), 1.46–1.51 (m, 1H), 1.52–1.64 (m, 4H), 1.72–1.79 (m, 2H), 1.96–2.02 (m, 1H, 7‐CH2), 2.66 (dd, J = 12.3 Hz, 5.1 Hz, 1H, 7‐CH2), 3.57–3.66 (m, 2H, CH2–Ph), 4.65 (d, J = 1.6 Hz, 1H, 17‐CH2), 4.92 (d, J = 1.7 Hz, 1H, 17‐CH2), 5.03–5.12 (m, 2H, 15‐CH2, H‐6), 5.22 (dd, J = 17.3 Hz, 1.2 Hz, 1H, 15‐CH2), 5.92 (dd, J = 17.3 Hz, 10.8 Hz, 1H, H‐14), 7.26–7.32 (m, 3H, Ph), 7.32–7.36 (m, 2H, Ph); 13C NMR (176 MHz, CDCl3) δ 15.99 (20‐CH3), 18.01, 19.01, 22.45 (18/19‐CH3), 27.74 (16‐CH3), 33.51, 36.15 (18/19‐CH3), 39.13 (12‐CH2), 39.89 (10‐CH), 41.30, 42.28, 43.45, 43.96 (7‐CH2), 56.36 (9‐CH), 57.45 (5‐CH), 73.48 (C‐13), 73.88 (6‐CH), 109.56 (17‐CH2), 111.69 (15‐CH2), 127.01 (Ph–C‐4), 128.50 (Ph–C‐3/3′), 129.29 (Ph–C‐2/2′), 133.95 (Ph–C‐1), 144.24 (C‐8), 145.16 (C‐14), 170.64 (C═O); HRMS [M + Na+] 447.28, found 447.287 m/z.
Larixyl‐6‐methylether
Larixol (113 mg, 0.367 mmol and 1.0 equiv) was dissolved in dry tetrahydrofuran (3 mL) and cooled to 0°C. Then sodium hydride (29 mg, 60% suspension in mineral oil, 0.735 mmol and 2.0 equiv) was added, and the solution stirred for 5 min, followed by the addition of iodmethane (69 μL, 1.10 mmol and 3.0 equiv). After 5 min, the icebath was removed, and the reaction stirred overnight at room temperature. Additional 20 mg sodium hydride (20 mg) and iodomethane (69 μL) was added and stirred for additional 24 h. The solvent was evaporated under reduced pressure. The obtained remainder was suspended in dichloromethane and extracted with water (15 mL). The organic phase was dried over MgSO4 and evaporated under reduced pressure. The product was purified by flash chromatography over silica (n‐hexane: ethyl acetate 85:15 (v/v)), yielding 42 mg (36%) of a 62:38 (determined by NMR integration) mixture of larixyl‐6‐methylether (A) and larixyl‐16‐methylether (B) as colourless crystals. R f = 0.4 (n‐hexane: ethyl acetate 4:1 (v/v)). 1H NMR (700 MHz, CDCl3) δ [ppm] = 0.70–0.72 (m, 5H, 20‐CH3 of A + B), 0.94 (s, 3H, 18/19‐CH3 of A), 1.03 (s, 2H, 18/19‐CH3 of B), 1.06 (td, J = 12.7, 4.0 Hz, 2H, 12‐CH2 of A + B), 1.10–1.14 (m, 4H), 1.18 (s, 2H, 18/19‐CH3 of B), 1.23–1.41 (m, 1H), 1.44–1.52 (m, 2H), 1.52–1.63 (m, 4H), 1.71–1.81 (m, 3H), 1.88–1.95 (m, 1H, 12‐CH2 of A), 2.06 (td, J = 11.5 Hz, 10.6, 1.8 Hz, 0.6 H, 12‐CH2 of B), 2.69 (dd, J = 12.2 Hz, 4.9 Hz, 0.6H, 12‐CH2 of B), 2.86 (dd, J = 12.2 Hz, 4.7 Hz, 1H, 12‐CH2 of A), 3.15 (s, 2H, OCH3 of B), 3.26 (td, J = 10.6 Hz, 4.7 Hz, 1H, H‐6 of A), 3.34 (s, 3H, OCH3 of A), 3.84 (td, J = 10.7 Hz, 4.9 Hz, 0.6H, H‐6 of B), 4.60 (q, J = 1.6 Hz, 0.6H, 17‐CH2 of B), 4.62 (q, J = 1.6 Hz, 1H, 17‐CH2 of A), 4.89 (q, J = 1.6 Hz, 0.6H, 17‐CH2 of B), 4.91 (q, J = 1.6 Hz, 1H, 17‐CH2 of A), 5.07 (dd, J = 10.8 Hz, 1.2 Hz, 1H, 15‐CH2 of A), 5.13 (dd, J = 17.7 Hz, 1.3 Hz, 0.6H, 15‐CH2 of B), 5.18 (dd, J = 10.9 Hz, 1.3 Hz, 0.6H, 15‐CH2 of B), 5.22 (dd, J = 17.4, 1.3 Hz, 1H, 15‐CH2 of A), 5.76 (dd, J = 17.7, 11.0 Hz, 0.6H, H‐14 of B), 5.93 (dd, J = 17.4 Hz, 10.8 Hz, 1H, H‐14 of A); 13C NMR (176 MHz, CDCl3) δ [ppm] = 16.08 (20‐CH3 of B), 16.29 (20‐CH3 of A), 17.70, 18.10, 19.14, 21.61, 22.38, 22.66, 27.82, 29.71, 33.82, 33.90, 36.46, 36.66, 38.50, 39.32, 39.41, 39.56, 41.40, 43.25 (7‐CH2 of A), 43.66, 43.79, 49.23 (7‐CH2 of B), 50.07 (OCH3 of B), 55.76, 56.60, 56.75, 58.91 (OCH3 of A), 60.59, 71.71 (C‐6 of A), 73.53, 77.56, 80.76 (C‐6 of B), 108.21 (17‐CH2 of A), 108.27 (17‐CH2 of B), 111.62 (15‐CH2 of A), 114.63 (15‐CH2 of B), 143.03 (14‐CH of A), 145.21 (14‐CH of B), 145.70 (C‐8 of B), 145.78 (C‐8 of A); HRMS [M + Na+] 343.26, found: 343.265 m/z; anal. calcd for C21H36O2: C, 78.70; H, 11.32; found: C, 78.78; H, 11.44.
Mutagenesis of human TRPC6 protein
To obtain pcDNA3‐based expression plasmids, encoding FSGS‐related point‐mutated TRPC6 protein, site‐directed mutagenesis of human TRPC6‐yellow fluorescent protein (YFP) was performed with the QuikChange kit (Agilent Technologies, Santa Clara, CA, USA), following the manufacturer's recommendations and applying suitable forward and reverse primers (sequences are provided in Supporting Information Table S1). After PCR, mutated plasmids were transformed in XL2‐Blue competent cells. Clones were selected, and the mutation was verified by cDNA sequencing.
Cell culture and transfection of HEK293 cells
HEK293 cells were cultured in Earle's Minimum Essential Medium (Sigma, Munich, Germany), supplemented with 10% fetal calf serum (Gibco Thermo Fisher Scientific, Darmstadt, Germany), 2 mM l‐glutamine, 100 U·mL−1 penicillin and 0.1 mg·mL−1 streptomycin. To characterize human TRPC6 mutants and to verify the efficiency of larixol derivatives, parental HEK293 cells were seeded on 25 mm glass coverslips and transfected with 4 μL Fugene HD (Promega, Mannheim, Germany) and 2 μg of DNA encoding wild‐type or mutated variants of TRPC6‐YFP. For FRET assays, HEK293 cells were co‐transfected with 0.5–0.8 μg pcDNA3‐hTRPC6‐cyan fluorescent protein (CFP) wild‐type and 1.2–1.5 μg pcDNA3‐hTRPC6‐YFP mutant to achieve a 1:1 molar ratio between YFP‐fused and CFP‐fused channel constructs. After 24 h, cells were directly used for intracellular Ca2+ concentration ([Ca2+]i) imaging and FRET measurements, or singularized with 0.25% trypsin for electrophysiological experiments. Fluorescence plate imaging analyses of cells expressing TRPC6 mutants were realized with stably transfected polyclonal cell lines, selected by adding 1 mg·mL−1 geneticin (G418) to the medium. All cells were maintained at 37°C and in a 5% CO2‐aerated, humidified atmosphere.
Isolation of glomeruli and podocyte primary cultures
All animal care and experimental procedures were conducted in strict accordance with the Guide for the Care and Use of Laboratory Animals (European Communities Council; Directive 2010/63/EU) and were approved by the government of the State of Saxony (Ethics Committee, Landesdirektion Sachsen, Leipzig, Germany; permission number TVV 05/16). Studies involving animals are reported in accordance with the ARRIVE guidelines for reporting experiments involving animals (Kilkenny et al., 2010; McGrath and Lilley, 2015). The mouse strains used were C57BL/6J or B6.Cg‐Tg(NPHS2‐Trpc6) F419Walz/J transgenic mice intercrossed on C57BL/6J background, purchased via Charles River Laboratories from The Jackson Laboratory (Bar Harbour, MA, USA; stock number 018293). Wistar rats were obtained from Janvier Labs and bred in our Animal facility.
Kidneys were isolated by dorsal dissection from 10‐day‐old (P10) or 8‐week‐old Wistar rats or from 3‐ to 4‐week‐old mice. Animals were anaesthetized with isoflurane (Baxter, Unterschleißheim, Germany), and killed by decapitation immediately before removal of the kidneys. After removing the fibrous renal capsule, cortical tissue was obtained, cut in small pieces and washed in ice‐cold buffer, containing 127 mM NaCl, 5.9 mM KCl, 1.2 mM MgCl2, 1.8 mM glucose and 10 mM HEPES adjusted to pH 7.4. Then, the collected tissue was enzymically digested for 12–15 min at 37°C in the same buffer, additionally containing 0.75 mg·mL−1 collagenase (Sigma), 50 μM CaCl2 and 0.5% BSA. The digested tissue was recovered by short centrifugation and resuspended in a podocyte culture medium, containing RPMI 1640 supplemented with 10% fetal calf serum, 2 mM l‐glutamine, 100 U·mL−1 penicillin and 0.1 mg·mL−1 streptomycin. The suspension, which contained decapsulated glomeruli, was repeatedly sieved through cell strainers (Greiner, Frickenhausen, Germany) with decreasing pore sizes (100, 70 and 40 μm). Glomeruli‐enriched fractions were obtained by turning and rinsing the 70 μm sieve, for adult rats, or the 40 μm sieve for P10 rats and mice, with medium. For Ca2+ measurements, isolated glomeruli were directly loaded with 5 μM fura‐2/AM (AAT Bioquest, Hamburg, Germany) or 4 μM fluo‐4/AM (Invitrogen, Karlsruhe, Germany) in podocyte culture medium for 30 min at 37°C, centrifuged (100× g; 5 min) and measured 30 min after allowing glomeruli to settle in collagen‐coated 24‐well cell culture plates or pigmented clear‐bottom 384‐well plates (Corning, Kaiserslautern, Germany) in HEPES buffered saline (HBS) containing 0.1% BSA. In case of isolation of primary podocyte cultures, glomeruli suspended in podocyte culture medium were seeded into 24‐well plates that were freshly coated with collagen A (Biochrom, Berlin, Germany) or into collagen type I‐coated 60 mm dishes (Greiner). Analyses were done 5 to 8 days after growing out of podocytes from the glomeruli. The fraction of cells with cobblestone‐like morphology was over 80%.
PASMC isolation
Pulmonary artery smooth muscle cells (PASMCs) were obtained from 3‐week‐old Wistar rats or from 3‐ to 4‐week‐old mice, following a previously described procedure (Urban et al., 2016). PASMCs were cultured for 1 to 2 weeks in DMEM/Ham's F12 medium (1:1 v/v), supplemented with 10% fetal calf serum, 2 mM l‐glutamine, 2.7 g·L−1 d‐glucose, 25 mM HEPES, 100 U·mL−1 penicillin and 0.1 mg·mL−1 streptomycin before preparation of RNA was done. For analysis of protein expression, functional TRPC6 [Ca2+]i imaging and membrane potential measurements and PASMC were used up to the seventh passage.
Ca2+ measurements in multiwell plates
Fluorometric Ca2+ assays in HEK293 cell lines and glomeruli were done in HBS, containing 132 mM NaCl, 6 mM KCl, 1 mM MgCl2, 1 mM CaCl2, 5.5 mM d‐glucose and 10 mM HEPES, 0.03% BSA adjusted to pH 7.4 with NaOH. Isolated glomeruli or trypsin‐detached HEK293 cell lines were loaded with 4 μM fluo‐4/AM (Invitrogen) in culture medium for 30 min at 37°C. After centrifugation (100× g; 3 min), glomeruli and HEK293 cells were resuspended in HBS and dispensed into pigmented clear‐bottom 384‐well plates (Corning Inc., Corning, NY, USA). Fluorescence signals were recorded in a custom‐made fluorescence imaging plate reader (FLIPR) built into a robotic liquid handling station (Freedom Evo 150, Tecan, Männedorf, Switzerland) as described (Urban et al., 2016). First, TRPC6 inhibitors were added to stably transfected HEK293 cells at the indicated final concentrations and incubated for 5 min. Then, cells were stimulated with 1‐oleoyl‐2‐acetyl‐sn‐glycerol (OAG; 50 μM) during continuous fluorescence recording, controlled by a Micromanager software (Edelstein et al., 2010). Fluorescence intensities were calculated from image stacks for each well with ImageJ (Abramoff and Magalhaes, 2004), corrected for background signals and normalized to the initial intensities (F/F 0). Concentration–response curves were generated by fitting the data to Hill equations. If freshly isolated glomeruli were examined, LC was incubated for 10 min, and activation of TRPC6 channels was indirectly triggered with 10 μM angiotensin II.
Microfluorometric [Ca2+]i imaging analysis
Transfected HEK293 cells or PASMC grown on 24 mm coverslips or primary podocyte cultures grown in 24‐well plates were loaded with 4 μM fura‐2/AM (AAT Bioquest, Sunnyvale, California, USA) in HBS containing 0.2% BSA for 30 min at 37°C. After washing cells, podocytes and PASMC were allowed to equilibrate in HBS containing 0.1% BSA and 1 μM bisindolylmaleimide 1 (BIM) to prevent activation of PKC. HEK293 cells on coverslips were mounted in a bath chamber and superfused with HBS containing 0.1% BSA. [Ca2+]i measurements were performed on an inverted epifluorescence microscope with a Fluar 10×/0.5 objective (Carl Zeiss, Jena, Germany) and calibrated as described (Lenz et al., 2002; Urban et al., 2016). Heterologously expressed TRPC6 channels in HEK293 cells were either activated with 50 μM OAG or indirectly stimulated by challenging cells with a mixture of 1 mM carbachol, 300 μM ATP and 0.5 units·mL−1 thrombin after internal Ca2+ store depletion with 2 μM thapsigargin. To evaluate the inhibitory potency of new TRPC6 blockers, HEK293 cells were pretreated with 1 μM of respective compound. Activation of endogenous TRPC6 in PASMC, podocytes or freshly isolated glomeruli was attempted with 100 μM OAG, 20 μM GSK1702934A, 10 μM angiotensin II, 100 μM ATP, 10 μM bradykinin, 100 μM carbachol or 0.5 units·mL−1 thrombin. In some experiments, Ca2+ mobilization from the endoplasmic reticulum was blocked by adding 2 μM thapsigargin to the bath, 5 min before application of the respective agonists.
FRET measurements
FRET was assessed and quantified by measuring donor (TRPC6‐CFP) unquenching during selective photobleaching of the FRET acceptor (YFP fused to the C‐terminus of wild‐type or mutant TRPC6) essentially as described earlier (Hellwig et al., 2005). To account for the expected 1:1 gene dose in FSGS patients, the molar ratio between co‐expressed CFP‐tagged and YFP‐tagged TRPC6 constructs was determined as described and adjusted to achieve only a slight (10–30%) excess of the YFP‐fused FRET acceptor over the co‐expressed CFP‐fused donor.
Genotyping and quantitative RT‐PCR
After reproduction of B6.Cg‐Tg(NPHS2‐Trpc6) F419Walz/J transgenic mice, genotyping of 2‐week‐old littermates was performed, applying a REDExtract‐N‐Amp Tissue PCR Kit (Sigma), a Trpc6 exon 8 forward primer 5′‐gacactgttctgggctatct and a Trpc6 3′ UTR reverse primer 5′‐cagtgtgatggagctcga as reported (Krall et al., 2010). As an internal control, the endogenous Trpc6 gene was amplified, using a Trpc6 intron 8 reverse primer 5′‐cccattttcctctccccaaa. Amplicons were detected in gel electrophoresis as 830 bp product (transgene) and 530 bp (endogenous TRPC6) bands respectively.
To quantify the TRPC6 transcript abundance, total RNA was isolated from primary podocytes and PASMC with a TRIzol reagent (VWR Life Science, Erlangen, Germany). First‐strand cDNA was synthesized from RNA templates with a RevertAid first‐strand cDNA synthesis kit (Thermo Fisher Scientific, Darmstadt, Germany) and random hexamer primers, following the manufacturer's instructions. Finally, cDNA was applied directly as template in real‐time PCR using DyNAmo ColorFlash SYGR Green qPCR Kit and a Piko Real 24 thermocycler (Thermo Fisher Scientific). Primers for detecting native TRPC6 and smooth muscle α‐actin transcripts were independently designed for rat and mouse TRPC6 proteins. For quantitative RT‐PCR analysis of podocin expression, common mouse/rat primers were used. Transgenic TRPC6 RNA was detected with a Jackson Laboratory genotyping primer and a reverse hemagglutinin (HA) tag primer. PCR was performed with a three‐step protocol (7 min at 95°C; 45 cycles of 15 s at 95°C, 20 s at 56/63/66°C and 30 s at 72°C; and final extension of 2 min at 72°). Results were normalized to 18s RNA, using the ∆CT method (ratio reference/target = 2 C T (reference) − C T (target)). All applied primers are listed in Supporting Information Table S1.
Western blot and immunofluorescence analysis
Cultured podocytes and PASMC were washed twice with PBS, harvested with a cell scraper and homogenized with a RIPA buffer, containing 150 mM NaCl, 50 mM Tris–HCl pH 7.4, 1 mM EDTA, 1% NP‐40, 0.25% sodium deoxycholate, 1 mM NaF, 1 mM sodium orthovanadate, 1 mM PMSF, 1 μg·mL−1 aprotinin, 1 μg·mL−1 leupeptin and 1 μg·mL−1 pepstatin. Homogenization of glomeruli in RIPA was done directly after isolation and two washing steps with PBS. To assess protein yield of the samples, a BCA protein assay was used (Thermo Fisher Scientific). Then, 30 μg protein of glomeruli or HEK293 cells and 18 μg protein of podocytes or PASMC were lysed in Laemmli buffer and subjected to SDS‐PAGE (8% acrylamide/bis‐acrylamide). Separated proteins were electroblotted onto PVDF membranes. Membranes were blocked for 30 min in 5% non‐fat dry milk TBST (20 mM Tris pH 7.4, 137 mM NaCl and 0.1% Tween 20) and incubated overnight with anti‐TRPC6 (Alomone, Jerusalem, Israel; 1:200), anti‐podocin (Sigma; 1:2000) or anti‐α smooth muscle actin (α‐SMA) (Sigma; 1:1000) antibodies in TBS, 1% dry milk and 0.5% Tween 20. As a housekeeping protein, GAPDH was analysed by 2 h incubation with anti‐GAPDH (Millipore, Darmstadt, Germany; 1:5000) or anti‐ß‐actin (Sigma; 1:5000). Same day or next day, membranes were washed, followed by incubation with secondary peroxidase‐coupled anti‐rabbit (TRPC6, podocin and GAPDH) or anti‐mouse (α‐SMA and ß‐actin) antibodies (Sigma; 1:5000) for 2 h. Peroxidase activity was detected using a Novex enhanced chemiluminescence reagent (Invitrogen). For TRPC6 analysis, a more sensitive peroxidase substrate SuperSignal West Femto (Thermo Fisher Scientific) was necessary. Between detecting the different target proteins, the PVDF membranes were stripped with a 1 M glycine solution adjusted to pH 1.8 with HCl.
For immunofluorescence, freshly isolated glomeruli were transferred onto glass slides, dried quickly under a ventilator and fixed with methanol. Primary isolated podocytes were split onto freshly collagen A‐coated μ‐slides (Ibidi, Planegg / Martinsried, Germany) for 2 days and fixed with 4% paraformaldehyde. Then, samples were blocked and permeabilized with PBS, supplemented with 3% BSA, 0.1% Triton‐X100 and 10% goat serum. Incubation of slides with primary antibody was followed overnight with polyclonal rabbit anti‐podocin (Sigma; 1:250) and monoclonal mouse anti‐α‐SMA (Sigma; 1:500). After washing slides three times for 5 min in PBS, bonded primary antibodies were decorated with Alexa Fluor 488‐conjugated goat anti‐rabbit antibody (Invitrogen A11008; 5 μg·mL−1) and Cy3‐conjugated donkey anti‐mouse antibody (Jackson ImmunoResearch Laboratories, West Grove, PA, USA; 1:400) for 2 h. Finally, nuclei were counterstained with Hoechst 33 258 (10 μg·mL−1), and slides were washed again and mounted with Mowiol 4‐88 (Roth, Karlsruhe, Germany) or ibidi mounting medium (Ibidi, Planegg / Martinsried, Germany). Fluorescence detection was performed with an LSM 510 META confocal microscope (Carl Zeiss), using Plan‐Apochromat 63×/1.3 or 20×/0.8 objectives.
MTT assay/detection of cell viability
Cell viability was assessed in parental HEK293 cells with a (3‐(4,5‐dimethylthiazol‐2‐yl)‐2,5‐diphenyltetrazolium bromide) (MTT) assay. Cells were seeded in poly‐l‐lysine (PLL)‐coated 96‐well plates and grown for 24 h until monolayers reached 50% confluency. Then medium was exchanged, and larixyl derivatives or the corresponding DMSO solvent controls were added and incubated for another 24 h. After 24 h, the medium was replaced with fresh one, but now containing 0.5 mg·mL−1 MTT. After 3 h of incubation, supernatants were removed, cells were lysed and formazan crystals were completely dissolved with undiluted DMSO. Finally, absorbance measurements at 560 and 670 nm were done with a plate reader (Polarstar Omega, BMG Labtech, Ortenberg, Germany). The differences of both extinctions were calculated, and values were normalized to the 0.25% solvent control.
Membrane potential measurements
Changes in membrane potential of PASMC by LC and larixyl monoacetate (LMA) were followed with the fluorescent dye DiBAC4(3). PASMCs grown on 24 mm coverslips were mounted in a bath chamber and loaded for 15 to 20 min at 37°C with 500 nM DiBAC4(3) (AAT Bioquest) in HBS, containing 2 mM CaCl2. DiBAC4(3) fluorescence of PASMC was continuously detected on an inverted microscope (Axiovert 100 with a Fluar 10×/0.5 objective, Carl Zeiss) equipped with a monochromator (Polychrome II, TILL‐Photonics, Gräfelfing, Germany) and a 12 bit cooled CCD camera (Flowmaster, LaVision, Göttingen, Germany) by exciting the dye at 480 nm and collecting emitted light through a 512‐nm‐long pass filter. The test compounds were added after a baseline recording of 1 min.
Electrophysiological procedures
HEK293 cells stably expressing human TRPC6 channels C‐terminally fused to YFP (HEKhTRPC6‐YFP) cells, and podocytes were seeded at low density on PLL‐coated glass coverslips. After 6–24 h, TRPC6 membrane currents were recorded in the whole‐cell patch‐clamp configuration, using a Multiclamp 700B amplifier with a Digidata 1440A digitizer controlled by the PClamp 10 software (Molecular Devices, Sunnyvale, CA, USA). Coverslips were mounted in a chamber (Warner Instruments, Hamden, CT, USA), placed onto the stage of an inverted microscope and perfused with standard extracellular solution contained 140 mM NaCl, 5 mM CsCl, 2 mM MgCl2, 1 mM CaCl2 and 10 mM HEPES, 0.1% BSA adjusted to pH 7.4 with NaOH. In case of podocyte stimulation with OAG, the bath solution additionally contained 1 μM BIM to suppress simultaneous activation of PKC. Patch pipettes were pulled from borosilicate glass capillaries BG150F‐8P (Science Products) with a pipette puller PIP6 (HEKA Elektronik, Lambrecht, Germany) and had a resistance of 4–10 MΩ when filled with the standard pipette solution: 140 mM CsCl, 4 mM MgCl2, 10 mM EGTA and 10 mM HEPES adjusted to pH 7.2 with CsOH. In all whole‐cell measurements, serial resistance was lower than 13 MΩ and compensated by 70%. To record current/voltage (I/V) curves, voltage ramps (400 mV·s−1) ranging from −100 to +100 mV were applied. Currents were filtered at 3 kHz with a four‐pole Bessel filter and sampled at 10 kHz.
Data and statistical analysis
The data and statistical analysis comply with the recommendations on experimental design and analysis in pharmacology (Curtis et al., 2015). Results are presented as means ±SEM from the different groups, each calculated from 5‐13 independent experiments, with of the exception of Fig. 1J; Fig. 6C, F; Fig. 8F in which means ±SD are shown. Comparisons between two groups were made by using unpaired Student´s t‐test. If more than two groups were statistically analysed (Fig. 1J, 6F), one way ANOVA with Dunn‐Sidak test was applied. P < 0.05 was accepted as significant.
Figure 1.

Semi‐synthetic larixol derivatives: potency and selectivity as inhibitors of TRPC3, TRPC6 and TRPC7 channels and cytotoxicity. Stably transfected HEK293 cell lines overexpressing TRPC3, TRPC6 or TRPC7 channels were loaded with the Ca2+ indicator dye fluo‐4/AM, washed, exposed to various serially diluted modulators and assayed during stimulation with 50 μM OAG in a fluorescence imaging plate reader device. (A) Chemical structure of the diterpene moiety of larixol with locant numbers and positions of the secondary and tertiary alcohols indicated as R1 and R2 respectively. (B–H) Concentration–response curves of OAG‐induced Ca2+ signals detected in the presence of the indicated concentrations of the differently substituted larixyl compounds. Substituents at positions R1 and R2 are indicated. (I) Experiments performed as in (B–H), but with serially diluted SKF‐96365 as poorly selective TRP channel modulator. Fluorescence intensity increases ΔF were normalized to the respective initial fluorescence intensity F 0 and expressed as percentage of responses that were elicited in the absence of the compound. Data shown are means ± SEM of 16–24 recordings obtained in 4–6 independent experiments. (J) Assay of HEK293 cell viability after 24 h treatment with larixol derivatives, using the MTT assay. Bar graph shows means ± SD of 6–8 experiments. # P<0.05, significantly different from control (0.25% DMSO); one‐way ANOVA, with Dunn–Sidak test.
Figure 6.

Effect of larixyl carbamate on basal expression of TRPC6 channels and on membrane potential. HEK293 cells stably transfected with human TRPC6 channels (A) or rat PASMC (B) were incubated with 5 and 10 μM LC or with solvent for 24 h. TRPC6 and GAPDH were assayed in the respective cell lysates by Western blot analysis. (C) Means and SD of 6–9 independent treatments for each condition. (D) To assess the effect of LC on TRPC6 surface availability, rat PASMCs were exposed to 5 μM LC for 24 h. Then, the TRPC6 inhibitor was washed out, and PASMCs were loaded with fura‐2/AM and subjected to single‐cell [Ca2+]i imaging. During continuous recording of [Ca2+]i, TRPC6 was activated by 100 μM OAG. Control recordings were performed with untreated PASMC or with PASMCs, which were acutely incubated with 5 μM LC before starting measurements. Traces shown are means ± SD of 5–7 experiments. (E) Time course of DiBAC4(3) fluorescence in rat PASMC normalized to initial fluorescence (F 0) during exposure to 5 μM LC, 5 μM LMA, 30 μM NS1619, 10 μM GSK1702934A or solvent. Traces represent means of 5–8 individual recordings, each comprising the averaged signal from 60 to 120 cells. (F) Summary results of peak changes in DiBAC4(3) fluorescence measured as in (E) after compound addition (means ± SD). # P<0.05, significantly different from solvent control; unpaired Student´s t‐test.
Figure 8.

Fluorimetric analysis in primary podocyte cultures reveals no discernible impact of OAG or of TRPC6 channel inhibition on global [Ca2+]i. Podocyte cultures were obtained from rats (A, C) or from transgenic B6.Cg‐Tg(NPHS2‐Trpc6) F419Walz/J mice (B, D, F, G) loaded with fura‐2/AM and subjected to single‐cell [Ca2+]i analysis. (A) Imaging of basal (left panel) and ATP (100 μM)‐stimulated [Ca2+]i in rat podocytes. The rainbow pseudocolour scale ranges from 0 to 800 nM. (B) Experiment as in (A), but with mouse podocytes challenged with 10 μM bradykinin. White bars in (A, B) indicate 100 μm. (C) Representative recordings of [Ca2+]i in single‐rat podocytes and averaged signals during application of 100 μM OAG (1) or of the indicated agonists or activators of GPCR signalling (2) . (D) Similar experiments as in (C), but using podocyte cultures obtained from TRPC6‐overexpressing transgenic mice. (E) Summary results from 4–10 experiments performed as in (C) and (D). Data shown are means ± SEM of of basal [Ca2+]i (open bars) and of the [Ca2+]i after addition of the indicated modulators. Changes remained not significant (n.s.), or reached statistical significance at P < 0.05 (#). (F) [Ca2+]i in primary podocytes from B6.Cg‐Tg(NPHS2‐Trpc6) F419Walz/J mice with or without 5 μM LC preincubation (1) and during stimulation (2) with 100 μM ATP, 10 μM bradykinin or 0.5 units·mL−1 thrombin. Left panels: averaged time course of [Ca2+]i and SD calculated from 6–15 individual measurements. Right panels: data shown are means ± SEM (of 5–6 experiments, each) of peak responses. (G) Experiments as in (F), but with 5 μM LMA (left panels) or solvent acutely added 60 s after GPCR stimulation (3). Statistical analysis (right panels) of 4–6 independent experiments, each, reveals no significant effect of the TRPC6 inhibitor on [Ca2+]i if given 60 s after GPCR activation.
Materials
Angiotensin II, bradykinin, carbachol, NS1619, thapsigargin, thrombin and SKF‐96365 were supplied by Sigma (Taufkirchen/ Munich, Germany). GSK1702934A was obtained from tebu‐bio (Offenbach, Germany)
Nomenclature of targets and ligands
Key protein targets and ligands in this article are hyperlinked to corresponding entries in http://www.guidetopharmacology.org, the common portal for data from the IUPHAR/BPS Guide to PHARMACOLOGY (Southan et al., 2016), and are permanently archived in the Concise Guide to PHARMACOLOGY 2015/16 (Alexander et al., 2015a,b).
Results
Derivatization of larixol
As monoacetylation of larixol at its secondary alcohol, in the compound LMA, was known to enhance the potency of TRPC6 inhibition (Urban et al., 2016), we sought to add a second acetylation at the tertiary alcohol of larixol, and/or to replace the acetate by other substituents to further improve the properties of the TRPC6‐inhibiting pharmacophore. Under harsher reaction conditions, various carboxylate esters were formed, which included modification of both hydroxyl groups of larixol. Of them, larixyl diacetate and larixyl dipropionate were less potent in inhibiting wild‐type TRPC6 in a stably transfected HEKhTRPC6‐YFP cell line than the previously characterized LMA or a larixyl mono‐6‐propionate (Figure 1A–D). Despite its reasonably TRPC6‐selective mode of action, higher IC50 values argued against a favourable modification at the tertiary alcohol of the 3‐hydroxy‐3‐methylpent‐4‐enyl group of larixol. Instead, we modified the hydroxyl group at the C6 atom of the diterpene ring. Here, the addition of a methyl ether, or of formyl or propionyl groups did not significantly improve the potency of TRPC6 inhibition, compared with LMA. Likewise, the selectivity to prevent the OAG‐induced activation of TRPC6 channels, compared with the activation of stably transfected TRPC3 or TRPC7 channels was similar or lower than that of LMA. Of note, larixyl methyl ether, larixyl formate, LMA and larixyl propionate elicited a concentration‐dependent biphasic effect on TRPC7 channels, with a slight potentiation at lower concentrations and channel inhibition at higher concentrations. With an IC50 of 36 μM, a larger phenylacetate‐substituted larixol was only poorly active and selective (Figure 1H). Reasoning that the ester bond in LMA may be readily cleaved by intracellular esterases, for example, in the liver, we replaced the acetate group in LMA by a carbamate group. The resulting derivative, LC, displayed a favourable potency with an IC50 to inhibit wild‐type TRPC6 channels of 0.48 μM (Figure 1C). Of note, the selectivity to inhibit TRPC6, but not TRPC3 channels was 30‐fold and, thus, slightly higher than that of the previously reported LMA. For comparison, we assessed the inhibition of TRPC3, TRPC6 and TRPC7 channels by the compound SKF‐96365 in the same assay. As expected, SKF‐96365 was moderately potent and poorly specific. The corresponding IC50 values were 5.0, 7.1 and 19 μM to inhibit TRPC6, TRPC3 and TRPC7 channels respectively (Figure 1I).
To assess a potential cytotoxicity of the new larixol derivatives, we carried out a viability assay in parental HEK293 cells, applying the three highest compound concentrations used in the FLIPR analysis (Figure 1B–H). All compound stocks were dissolved in DMSO at a concentration of 10 mM. Compared with the respective solvent control, none of the TRPC6 channel inhibitors significantly affected the cell viability at a concentration of 25 μM, with the exception of larixyl diacetate (Figure 1J). Of note, LC concentrations necessary for full block of TRPC6 channels were found to be only 5 μM in Ca2+ measurements and 1 μM in electrophysiological assays.
Generation and functional expression of FSGS‐related TRPC6 mutants
Plasmids, which encode TRPC6 protein constructs that carry FSGS‐related point mutations, were generated by site‐directed mutagenesis and confirmed by cDNA sequencing. After transient heterologous expression in HEK293 cells, fluorometric single‐cell [Ca2+]i analyses reproduced the gain of function phenotype in the P112Q, M132T, R175Q and Q889K point‐mutated TRPC6 constructs. Here, the basal as well as the OAG (50 μM)‐induced peak [Ca2+]i were up to threefold higher than in cells expressing the wild‐type TRPC6 channels. Of the two remaining constructs, R895C and E897K, only R895C gave rise to a slightly higher basal [Ca2+]i, but the stimulated peak [Ca2+]i displayed only a trend (not statistically significant) to higher values (Table 1).
Table 1.
Basal and OAG‐stimulated peak [Ca2+]i in HEK cells expressing WT or FSGS‐related point mutated forms of TRPC6 channels. [Ca2+]i was measured by single‐cell microfluorimetry in fura‐2‐loaded HEK293 cells. Basal [Ca2+]i before and OAG (50 μM)‐induced [Ca2+]i after TRPC6 channel activation were averaged over 150–200 cells, and n = 6 experiments were performed to calculate means ± SEM.
| Basal [Ca2+]i (nM) | Compared with WT | OAG‐induced peak [Ca2+]i (nM) | Compared with WT | |
|---|---|---|---|---|
| WT | 57.1 ± 4.3 | 124.3 ± 17.5 | ||
| P112Q | 78.9 ± 5.6 | P <0.05 | 248.8 ± 29.0 | P <0.05 |
| M132T | 153.8 ± 19.2 | P <0.05 | 286.0 ± 25.8 | P <0.05 |
| R175Q | 69.8 ± 4.2 | P>0.05 | 354.3 ± 45.2 | P <0.05 |
| Q889K | 71.2 ± 1.4 | P <0.05 | 280.0 ± 46.1 | P <0.05 |
| R895C | 78.4 ± 6.6 | P <0.05 | 168.3 ± 20.8 | P>0.05 |
| E897K | 63.8 ± 3.2 | P>0.05 | 184.5 ± 52.6 | P>0.05 |
WT, wild type.Data shown are means ± SEM; significant differences determined with unpaired Student´s t‐test.
As TRPC6‐linked FSGS is an autosomal dominant inheritable disease, patients have a second allele, which encodes wild‐type TRPC6 channels. Using FRET analyses, we tested whether YFP‐fused mutated TRPC6 constructs can still form oligomeric assemblies with wild‐type TRPC6 protein, which was C‐terminally fused to CFP. When transiently co‐expressed with a 1.1‐fold to 1.3‐fold molar excess of YFP‐fused constructs over TRPC6‐CFP, all investigated TRPC6 mutants gave rise to robust FRET signals, ranging from FRET efficiencies of 15.9 to 19.7%. Under the same experimental conditions, the wild‐type TRPC6‐CFP : TRPC6‐YFP complex developed a FRET coupling efficiency of 18.0%. From these data, we conclude that all investigated TRPC6 mutations are still capable of forming channel complexes together with TRPC6 subunits that are encoded by the wild‐type allele (Table 2).
Table 2.
FRET efficiencies between co‐expressed CFP‐fused WT TRPC6 and point‐mutated TRPC6 constructs. The molar ratio was quantified by comparing CFP and YFP fluorescence intensities (CFP measured after photobleaching of YFP) to those observed in an intramolecularly fused CFP–YFP construct. The FRET efficiency is calculated from the donor (TRPC6‐CFP) fluorescence increase during selective photobleaching of the acceptor fluorochrome (YFP). Data represent means and SEM of 17–27 photobleaching experiments
| YFP | CFP | YFP/CFP molar ratio | FRET efficiency (%) | Compared with WT |
|---|---|---|---|---|
| WT | WT | 1.21 ± 0.1 | 18.0 ± 0.9 | |
| P112Q | WT | 1.23 ± 0.1 | 18.6 ± 1.0 | P>0.05 |
| M132T | WT | 1.17 ± 0.1 | 19.0 ± 1.4 | P>0.05 |
| R175Q | WT | 1.17 ± 0.1 | 15.9 ± 0.6 | P>0.05 |
| Q889K | WT | 1.13 ± 0.1 | 18.5 ± 1.0 | P>0.05 |
| R895C | WT | 1.17 ± 0.1 | 15.7 ± 0.7 | P>0.05 |
| E897K | WT | 1.17 ± 0.1 | 19.7 ± 1.1 | P>0.05 |
WT, wild type. Data shown are means ± SEM; significant differences determined with unpaired Student´s t‐test.
Inhibition of Ca2+ entry through FSGS‐mutated TRPC6 by larixol derivatives
The efficiency of LMA to inhibit wild‐type or mutated TRPC6 channels in a GPCR‐mediated activation mode was tested by calibrated single‐cell [Ca2+]i analysis in fura‐2‐loaded HEK293 cells, which were transiently transfected to express wild‐type TRPC6 or FSGS‐related mutant TRPC6 channel variants. Cells grown on glass coverslips were mounted into bath chambers, exposed to HBS, containing either 1 μM LMA or the solvent, and then incubated with 2 μM thapsigargin for 5 min to deplete inositol 1,4,5‐trisphosphate‐sensitive Ca2+ stores. Thereafter, an agonist mix, comprising maximally effective concentrations of ATP (300 μM), carbachol (1 mM) and thrombin (0.5 units·mL−1) was added to the bath to activate G‐protein‐sensitive PLC and, in turn, TRPC6 channels. Irrespective of the expression of wild‐type or mutated TRPC6 channel variants, [Ca2+]i signals that were elicited by the agonist mix were strongly and significantly attenuated when cells were pretreated with 1 μM LMA (Figure 2). When compared with the findings in the OAG‐activated mode (see Table 1), the relative order of channel hyperactivity was similar with P112Q, M132T, R175Q and Q889K mutants causing the strongest enhancement of signals compared with wild‐type TRPC6 or the R895C and E897K mutants. Of note, the elevated basal [Ca2+]i in cells overexpressing the M132T variant (Figure 2C) was efficiently lowered in the presence of 1 μM LMA. A remaining, small [Ca2+]i signal seen in LMA‐treated cells expressing the P112Q, M132T or R175Q variants may either indicate partial inhibition of the channel or an incomplete store depletion.
Figure 2.

Fluorometric [Ca2+]i analysis in HEK293 cells expressing wild‐type or FSGS‐related mutated TRPC6 channels. Adherent HEK293 cells were grown on glass coverslips and transiently transfected with expression plasmids encoding wild‐type (WT; A) or the indicated point‐mutated TRPC6 channel variants (B–G). After loading of the [Ca2+]i indicator dye fura‐2/AM, coverslips were subjected to microfluorimetric single‐cell [Ca2+]i analysis. Excitation wavelengths of 340, 358 and 380 nm were sequentially applied, and fluorescence emission was recorded at 500–550 nm with a cooled CCD camera. Cells were either kept in a bath solution containing 1 μM LMA (black traces) or no TRPC6 inhibitor (grey lines). To deplete inositol‐1,4,5‐trisphosphate‐sensitive storage organelles, 2 μM thapsigargin was applied for 300 s before challenging cells with an activator mix, consisting of ATP (300 μM), carbachol (CCh; 1 mM) and thrombin (0.5 units·mL−1). Note the elevated basal [Ca2+]i in cells expressing the M132T mutant, which was lowered by 1 μM LMA. Data shown are means ± SEM of 50–140 cells measured in a representative experiment. (H) Statistical analysis (means ± SEM) of six independent experiments each, performed as shown in (B–G). # P<0.05, significantly different from control (0.25% DMSO); *P < 0.05, significantly different from WT; unpaired Student´s t‐test.
To quantitatively assess the potency of inhibition of FSGS‐related TRPC6 channel variants by LMA and by the newly synthesized LC, we generated stably transfected cell lines for each of the six TRPC6 channel mutants and applied a semi‐quantitative multiwell Ca2+ analysis in fluo‐4‐loaded cell suspensions. Here, a complete inhibition of OAG (50 μM)‐induced Ca2+ signals was seen in cells pretreated with 7.5–15 μM of either LMA or LC. Concentration–response curves obtained by applying various concentrations of LMA or LC revealed IC50 values of 0.35–0.65 μM LMA for most TRPC6 constructs. The R175Q mutant appeared to be inhibited with a slightly lower potency (IC50 = 0.91 μM). Applying LC as the TRPC6 channel inhibitor, we obtained very similar results with IC50 values of 0.41–0.66 μM for five TRPC6 variants and 1.03 μM for the R175Q construct (Figure 3).
Figure 3.

Concentration‐dependent inhibition of Ca2+ influx through FSGS‐related TRPC6 channel mutants by LMA and LC. Experiments were performed essentially as described in Figure 1, but with fluo‐4‐loaded stably transfected HEK293 cell lines, expressing the indicated point‐mutated TRPC6 channel constructs. Fluo‐4‐loaded cell suspensions were incubated for 5 min with the indicated concentrations of LMA or LC before activating TRPC6 channelswith 50 μM OAG. Concentration–response curves of the inhibition of OAG‐induced Ca2+ signals were constructed by fitting four‐parameter Hill equations to the experimental data. The resulting IC50 values are indicated. Data represent means and SE of 10–13 datasets, each, obtained in 4–7 independent experiments.
Electrophysiological properties of TRPC6 channel inhibition
As expected, ionic currents through mutant TRPC6 constructs resembled those of wild‐type TRPC6 channels in terms of current–voltage relationship and their activation by 50 μM OAG (Figure 4). With the exception of the E897K mutant, peak current densities were markedly higher than those seen in cells expressing the wild‐type TRPC6 channels. In all investigated channel constructs, the acute addition of 0.2 μM LC partly, and 1 μM LC almost completely blocked the OAG‐induced inward and outward currents measured at −100 and +100 mV respectively. The block by 0.2 or 1 μM LC developed within a few seconds, which was sufficiently fast to qualitatively discern the channel inhibition from the slower channel inactivation, which was observed in cells that were not exposed to the inhibitor (see grey traces in Figure 4B–H).
Figure 4.

Inhibition of ionic currents through FSGS‐related TRPC6 channel mutants by LC. Electrophysiological patch‐clamp recordings were obtained in the voltage‐clamped whole‐cell mode. (A) Voltage protocol applied in the experiments. Horizontal bars indicate the time spans used for averaging inward and outward currents at −100 and +100 mV respectively. The sweep frequency was 1 s−1, and the inter‐sweep holding potential was 0 mV. (B–H) Representative examples of whole‐cell currents elicited in HEK293 cells that were transiently transfected with expression plasmids encoding the indicated point‐mutated TRPC6 channel variants. Whole‐cell currents were recorded during stimulation with 50 μM OAG either without subsequent application of LC or during sequential addition of 0.2 and 1 μM LC. Left panels: examples of currents measured during the application of voltage ramps before (basal) and shortly after the addition of OAG. Right panels: time course of inward currents at V h = −100 mV (lower traces) and outward currents at V h = +100 mV (upper traces). Note the different scaling of current densities between cells expressing wild‐type (WT) or point‐mutated TRPC6 constructs.
To obtain more detailed information about the inhibition of TRPC6 channel currents by LC in an equilibrium state of inhibitor binding, we exposed stably transfected HEKhTRPC6‐YFP cells to various concentrations of LC prior to stimulating channel activity with 50 μM OAG. In voltage ramp protocols applied in 1 s intervals, both inward currents measured at −100 mV and outward currents at +100 mV were concentration‐dependently suppressed by LC (Figure 5A–C). The corresponding IC50 values were 118 and 120 nM respectively. Accordingly, currents measured during application of voltage ramps showed no signs of a voltage‐dependent inhibition, and reversal potentials remained unchanged (Figure 5B), indicating no major effects on the selectivity of conducted cations. In HEK293 cells expressing mutated TRPC6 constructs, preincubation with 1 μM LC for 1 min prior to OAG application significantly inhibited all tested TRPC6 channel variants (Figure 5D). As the inhibition amounted 70–95%, we conclude that, as for wild‐type TRPC6 channels, the IC50 of LC to inhibit FSGS‐related TRPC6 channel mutants is in a submicromolar concentration range.
Figure 5.

Pretreatment with LC suppresses ionic currents through TRPC6 channels concentration‐ dependently and potently inhibits FSGS‐related TRPC6 channel mutants. Electrophysiological recordings of whole‐cell currents were performed as in Figure 4, but with the indicated concentrations of LC preincubated 60 s before challenging cells with 50 μM OAG. (A) Representative recordings of inward (lower traces) and outward current densities (upper traces) elicited in stably transfected HEKhTRPC6‐YFP cells by 50 μM OAG in the absence (negative) or in the presence of the indicated concentrations of LC. (B) Current density–voltage relationship of OAG‐induced currents recorded during the respective outward current peaks in (A). Traces obtained in the presence of the indicated concentrations of LC are superimposed. (C) Summary of several experiments performed as shown in (A) Data shown are means ± SEM. OAG‐induced peak outward and inward current densities were determined in 6–13 cells preincubated for 1 min with various concentrations of LC. # P<0.05, significantly different from control values (without LC); unpaired Student´s t‐test. (D) Experiments and statistical analysis as in (A) and (C), but with transiently transfected HEK293 cells expressing either wild‐type (WT) or point‐mutated TRPC6 constructs. Outward and inward current densities (means ± SEM) were obtained without (−) or with (+) 1 μM LC, preincubated for 60 s prior to current induction with 50 μM OAG. # P<0.05, significantly different from control (0 μM LC); *P < 0.05, significantly different from corresponding WT values; unpaired Student´s t‐test.
Larixyl carbamate does not affect the membrane potential or TRPC6 expression
Because some pimarane compounds, which are chemically related to larixol, have been identified as modulators of large conductance Ca2+‐activated K+ (BK) channels (KCa1.1 channels), we investigated if LC could alter the membrane potential (E m) in rat PASMC that endogenously express BK channels and voltage‐dependent calcium channels (VDCC). Since the acute addition of 5 μM LC did not cause an increase in [Ca2+]i in fura‐2‐loaded PASMC (Figure 6A), an efficient activation of VDCC could be excluded. In PASMC loaded with the E m‐sensitive fluorescent dye DiBAC4(3), the direct TRPC6 channel activator GSK1702934A (10 μM) caused a significant increase in DiBAC4(3) fluorescence by 34 ± 17% (n = 8), indicating a depolarization. The known BK channel activator NS1619 (30 μM) decreased DiBAC4(3) fluorescence by 43 ± 11% (n = 7), indicating a hyperpolarization. By contrast, neither 5 μM LMA nor 5 μM LC caused a change in DiBAC4(3) fluorescence, compared with the solvent controls (Figure 6B, C).
To analyse possible effects of long‐term incubation with LC on the global expression of TRPC6 channels in recombinantly and in natively TRPC6 expressing cells, Western blot analyses were performed in samples obtained from stably transfected HEKhTRPC6‐YFP cells and from rat PASMCs (three independent experiments, each) that were grown for 24 h in the presence of 5 and 10 μM LC. The global abundance of heterologously expressed or of native TRPC6 channels remained largely unaffected by the TRPC6 channel inhibitor (Figure 6D–F). Furthermore, since OAG‐induced increases in [Ca2+]i measured in PASMC after long‐term (24 h) treatment with LC, followed by an acute washout of the inhibitor were not significantly different from those measured without preincubation of the TRPC6 inhibitor (see Figure 6A), we conclude that the availability of TRPC6 channels at the cell surface is presumably not grossly affected by long‐term treatment with LC.
Isolation of glomeruli and of primary podocyte cultures
The isolation of mouse or rat glomeruli from the renal cortex usually involves a fractional sieving technique. Critical differences may rely on the way how glomeruli are being detached from surrounding tissue. Different options have been described: first, a mechanical dissociation method by squeezing renal cortex through a mesh, and second, an enzymatic digestion of minced pieces of renal cortex. In our hands, the latter one was suitable to obtain short‐term cultures, which are highly enriched for podocytes. This observation was supported by the following evidence: (i) glomeruli fractions displayed a lower contamination with tubuli; (ii) Bowman's capsules were more efficiently removed, causing a strong increase in the relative abundance of podocin transcripts in quantitative RT‐PCR; and (iii) an efficient enrichment of podocin as seen in Western blot analyses (Figure 7A, B). Finally, immunofluorescence staining of glomeruli with antibodies raised against the podocyte‐specific marker podocin and the mesangial‐specific marker α‐SMA also confirmed the existence of podocytes and a well‐preserved structure of decapsulated rat or mouse glomeruli (Figure 7C–E). By culturing them, we obtained podocin‐positive podocyte cultures that exhibited the typical cobblestoned and, later on, the beginnings of an arborized morphology (Figure 7F–H). A few mesangial cells also grew out of glomeruli, but they show a more elongated morphology and were positive for α‐SMA staining (Figure 7I–K).
Figure 7.
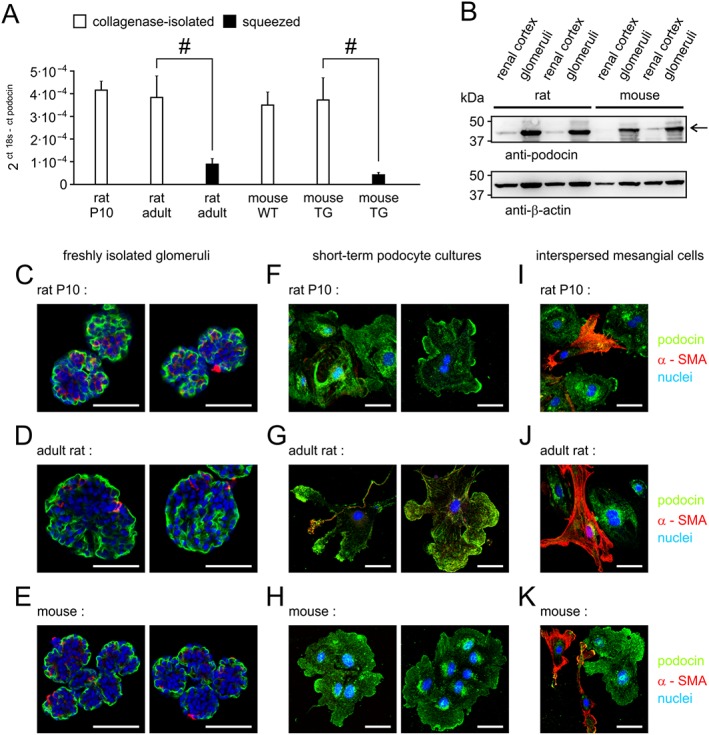
Isolation methods and culturing of glomeruli to obtain podocin‐expressing podocytes. Glomeruli from 10‐day‐old rats, adult rats or from mice were isolated from the renal cortex by fractional sieving. Purity and podocyte enrichment strongly depend on the dissociation method. (A) Relative levels of podocin transcripts respective to 18s RNA yield were determined by quantitative real‐time RT‐PCR after isolation by mechanical squeezing through the first sieve (squeezed) or by sieving after collagenase treatment and repetitive aspiration and suspension with a pipette (collagenase‐isolated). Data shown are means ± SEM of 5–7 preparations for each species. # P<0.05, significantly different as indicated; unpaired Student´s t‐test. (B) Typical Western blots show the enrichment of the podocyte‐specific marker podocin and of ß‐actin in glomeruli from rat and mouse kidneys obtained by the collagenase isolation method compared with the starting material (renal cortex). (C, F, I) Immunofluorescence staining and confocal imaging of podocin (green), α‐SMA (red) and nuclei (blue) in freshly isolated decapsulated (collagenase treatment) rat and mouse glomeruli. Same stainings, but applied to short‐term podocyte cultures, displaying pure podocyte groups (D, G, J) or cell groups with interspersed mesangial cells (E, H, K). White bars: 50 μm.
Ca2+ signalling in isolated rat and mouse podocytes and glomeruli
In short‐term cultures of enzymically isolated isolated rat and mouse podocytes, activation of P2Y(with ATP), PAR1 (with thrombin) or bradykinin receptors yielded the most robust [Ca2+]i signals (Figure 8A–E). As described earlier, functional expression of angiotensin AT1 receptors is rapidly lost in podocytes during the culturing. Accordingly, only in two out of nine experiments, a fraction of rat podocytes (up to 35%) still responded to 10 μM angiotensin II with a small Ca2+ mobilization signal. In mouse podocytes, no increases in [Ca2+]i were elicited by angiotensin II. During acute exposure to 100 μM OAG, we did not observe a statistically significant increase in [Ca2+]i in rat or mouse podocytes (see Figure 8C–E). As expected, preincubation of mouse podocytes with thapsigargin induced a transient increase in [Ca2+]i, but a subsequent challenge with 100 μM ATP, 10 μM bradykinin or 0.5 U·mL−1 thrombin failed to cause a significant second increase in [Ca2+]i (Supporting Information Figure S1), which would be expected if cells were expressing substantial amounts of TRPC6 channels. Likewise, the acute application of 5 μM LMA did not cause rapid decline of the [Ca2+]i in ATP‐stimulated, bradykinin‐stimulated or thrombin‐stimulated mouse podocyte cultures (Figure 8G) and even if 5 μM LC was preincubated, the GPCR‐induced [Ca2+]i peaks did not diminish (Figure 8F). The recently disclosed compound GSK1702934A is currently the most potent and effective direct activator of TRPC3 and TRPC6 channels. In multiwell calcium measurements, we obtained an EC50 of 1.8 μM for GSK1702934A to activate Ca2+ influx in stably transfected HEKhTRPC6‐YFP cells, whereas the EC50 of OAG and flufenamic acid (FFA) was 21.4 μM and over 200 μM (Supporting Information Figure S2). Moreover, FFA seemed to provoke non‐specific effects on parental HEK293 cells at high concentrations (see Supporting Information Figure S2A). Unfortunately, also 20 μM GSK1702934A failed to elicit [Ca2+]i signals in rat and mouse podocytes. By contrast, in PASMC prepared from the same animals, GSK1702934A induced a robust [Ca2+]i signal (see Supporting Information Figure S2C–F), demonstrating that the compound indeed activates native TRPC6‐bearing and/or TRPC3‐bearing channel complexes.
As expression of TRPC6 channels may be quickly down‐regulated after the cell isolation, we also sought to observe TRPC6‐related [Ca2+]i signals in acutely dissociated mouse or rat glomeruli. Rat glomeruli robustly responded upon stimulation with 100 μM carbachol (Figure 9A). However, acute addition of 5 μM LMA during the plateau phase of [Ca2+]i elevation did not significantly lower the [Ca2+]i (Figure 9B). Similar results were obtained with glomeruli isolated from transgenic B6.Cg‐Tg(NPHS2‐Trpc6) F419Walz/J mice (Figure 9C, D). In glomeruli from these mice, pretreatment with 5 μM LC also failed to exert a discernible impact on the size or on the kinetic properties of angiotensin II (10 μM)‐induced [Ca2+]i signals (Figure 9E–G).
Figure 9.

Ca2+ signals in acutely dissociated rat or mouse glomeruli are not significantly affected by LMA or LC. Glomeruli from 8‐week‐old Wistar rats (A, B) or from 4‐week‐old B6.Cg‐Tg(NPHS2‐Trpc6) F419Walz/J mice (C, D) were isolated by mechanical dissociation, collagenase treatment and fractional sieving. Glomeruli suspensions were loaded with fura‐2/AM washed and transferred to bath chambers for microfluorimetry (A–F) or loaded with fluo‐4/AM, washed and dispensed into microwell plates for imaging on a fluorescence plate imager (G). To elicit increases in [Ca2+]i via stimulation of a PLC‐coupled GPCR, rat glomeruli were stimulated with 100 μM carbachol, followed by addition of 5 μM LMA or its solvent. (A) Representative background‐corrected ratio images of F 340 nm/F 380 nm before (basal) and 30 s after addition of 100 μM carbachol encoded with a rainbow pseudocolour scale ranging from 0.2 to 1.0. (B) Time course of F 340 nm/F 380 nm in regions of interest defined within single glomeruli (grey traces) and averaged signals (black trace) during stimulation with carbachol without (solvent; left panel) or with subsequent addition of 5 μM LMA (middle panel). The right panel displays the statistical analysis of fluorescence ratios taken at the indicated time points (1, 2, 3) in 5–6 independent experiments. (C–F) Similar experiments as in (A, B), but with glomeruli from TRPC6‐overexpressing mice either stimulated with 100 μM carbachol (C, D) or with 10 μM angiotensin II (E, F). Note that angiotensin II‐induced [Ca2+]i responses were seen in some but not all glomeruli. (E) To level out inhomogenous responses, experiments were therefore repeated in fluo‐4‐loaded glomeruli suspensions measured in a microwell plate imager with and without preincubation with 5 μM LC (left panel). Statistical analysis of 16 measurements obtained in three independent experiments with glomeruli isolated from different animals. Signals with and without pretreatment with 5 μM LC did not reveal a significant LC‐sensitive component of angiotensin II‐induced [Ca2+]i signals (right panel). White bars in (A, C, E) indicate 100 μm.
To exclude the possibility that our isolation procedure with collagenase caused of the lack of a discernible activation, we also used the mechanical squeezing method. Regardless of the isolation method, the TRPC6 activator GSK1702934A did not cause a discernible Ca2+ influx in any cell type of freshly isolated rat or mouse glomeruli. By contrast, stimulation with carbachol or with angiotensin II was still effective (see Supporting Information Figure S2E–F), indicating that small peptides and chemical compounds can access the cells. Increasing the driving force for calcium entry through TRPC6 channels by elevating the CaCl2 concentration in the buffer from 1 to 2 mM had no effect. As LMA‐sensitive TRPC6‐like responses were previously seen in short‐term cultures of rat PASMC (Urban et al., 2016), which also responded to stimulation with the TRPC6 channel activator GSK1702934A (Supporting Information Figure S3C), the obvious question arose, how TRPC6 expression in podocytes compared with that in PASMC.
TRPC6 channel expression in rat and mouse podocyte cultures and glomeruli, compared with PASMC
First, quantitative RT‐PCR was applied to analyse the abundance of TRPC6‐encoding transcripts in podocyte cultures obtained from rats, from wild‐type mice or from transgenic mice, selectively overexpressing mouse TRPC6 in podocytes (under the control of a human podocin promoter/enhancer sequence). PCR products with the expected sizes for endogenously expressed rat or mouse TRPC6 were found in podocytes as well as in PASMC isolated from several investigated animals (Figure 10A, B). The selective detection of the transgene was positive in the TRPC6‐overexpressing transgenic mouse strain, but not in wild‐type mice (Figure 10C). Quantitative PCR normalized to ribosomal 18s RNA revealed that in podocytes from 10 days old or adult rats, TRPC6 mRNA was markedly less abundant than in rat PASMC (Figure 10D). Podocin expression was stronger in podocytes isolated from young animals, compared with podocytes from adult rats or to PASMC, which also showed the highest relative expression of α‐SMA (Figure 10E). In podocytes isolated from wild‐type mice, TRPC6 expression was again lower than in PASMC isolated from the same animals. As expected, the mRNA abundance of mouse TRPC6 tended to be higher in podocytes from mice expressing the TRPC6 transgene than in age‐matched wild‐type mice, but was still about sixfold lower than endogenous TRPC6 expression in mouse PASMC (Figure 10F). The expression profile of podocin and α‐SMA in wild‐type or transgenic mice was similar to that observed in adult rats (see Figure 10G).
Figure 10.

TRPC6 mRNA and protein abundance in murine podocytes and glomeruli compared with PASMC. Quantitative RT‐PCR was performed on RNA isolated from rat (A, D, E) and mouse (B, C, F, G) podocytes or PASMC to detect total TRPC6, the TRPC6 transgene, podocin and α‐SMA transcripts. Panels A–C depict PCR products obtained from podocyte and PASMC cultures of different animals, and a water control with no RNA added to the RT‐PCR (H2O). Total (B) and transgenic (C) mouse TRPC6 expression was detected in wild‐type (WT) and in transgenic B6.Cg‐Tg(NPHS2‐Trpc6) F419Walz/J (TG) mice. (D–G) Quantitative PCR results from n = 6–11 experiments were normalized to 18s rRNA and to the relative expression of the investigated mRNA in podocytes from adult wild‐type animals. # P < 0.05, significantly different as indicated; unpaired Student´s t‐test. (H–J) Western blot analysis of TRPC6, podocin, α‐SMA and GAPDH expression in acutely dissociated glomeruli, primary podocyte or PASMC cultures and in untransfected or in HEK293 cells that were transiently transfected with expression plasmids encoding the indicated TRP channels or enhanced YFP. If several lanes were loaded with the same condition, single lanes contain proteins obtained from a different animal. Representative blots of seven experiments with similar results, are shown.
At the protein level, demonstration of TRPC6 expression is limited by the quality of the antibodies. Western blot analyses clearly demonstrated TRPC6 expression in transiently transfected HEK293 cells, but two additional, non‐specific bands were also seen in untransfected cells, or in control‐transfected HEK293 cells expressing TRPC2‐HA, TRPC3‐HA or a soluble enhanced YFP (Figure 10H–J). Accepting the single specific band as an intraexperimental size marker for TRPC6, lysates of acutely dissociated rat or mouse glomeruli, podocyte or PASMC cultures were analysed. Specific signals were found in rat PASMC cultures, but absent or markedly less intense in lysates from glomeruli (Figure 10H, I) or podocyte cultures (Figure 10J). Controls for the tissue and cell preparations were performed by probing the membranes with anti‐podocin and anti‐α‐SMA antibodies. In addition, a loading control was included (anti‐GAPDH) in the experiments. From these data, we conclude that both mRNA and protein abundance of TRPC6 are differ markedly between PASMC and podocytes or glomeruli. Thus, the lack of TRPC6‐like global [Ca2+]i signals may be explained by the limited sensitivity of fluorometric analyses under conditions of low channel expression, which was not overcome by the moderate, podocyte‐specific TRPC6 overexpression in a transgenic B6.Cg‐Tg(NPHS2‐Trpc6)F419Walz/J mouse line.
Ionic currents in rat and mouse podocytes
The sensitivity of detecting very small TRPC6 currents may be higher in electrophysiological recordings than in fluorometric [Ca2+]i analyses. We therefore assessed the sensitivity of native TRPC6 channels to inhibition by LMA and LC by measuring whole‐cell currents in primary cultures of mouse and rat podocytes. Applying a voltage ramp protocol, an increase in ionic currents could be elicited by stimulation with OAG in 10 out of 34 patched rat podocytes. Figure 9A shows current densities in one of these cells and further examples are shown in Supporting Information Figure S1. The reversal potential was close to 0 mV, indicating a non‐selective conductance. Leak‐subtracted increases in current densities upon stimulation with 50 μM OAG were 0.648 ± 0.126 and 1.267 ± 0.359 pA·pF−1, measured at −100 and +100 mV respectively. In these podocytes, the acute addition of 5 μM LMA (see Supporting Information Figure S1A) or of 2.5 μM LC (Figure 11A and Supporting Information Figure S3B–D) caused a rapid decline of inward currents at −100 mV of 1.069 ± 0.321 pA·pF−1 and of outward currents at +100 mV of 2.161 ± 0.746 pA·pF−1. The LMA‐sensitive or LC‐sensitive current components again displayed a reversal potential close to 0 mV and outwardly rectifying properties, which is compatible with TRPC6 being the modulated channel entity.
Figure 11.

TRPC6‐like ionic currents in primary rat and mouse podocytes are inhibited by LC. Whole‐cell currents were recorded in primary podocytes obtained from a Wistar rat (A) or from a Tg(NPHS2‐Trpc6) F419Walz/J mouse, applying the voltage‐ramp protocol described in Figure 5. Left panels: current density–voltage relationships before (grey line; 1) and after sequential addition of 50 μM OAG (black line; 2) and 2.5 μM LC (blue line; 3) to the bath solution.Values shown are raw data without leak subtraction. Right panels: time course of inward currents at −100 mV (lower trace) and outward current densities at 100 mV over the whole experiment. Dotted lines: zero current level. Arrows and boxes indicate the time point of OAG and LC application respectively.
In podocyte cultures obtained from TPRC6‐overexpressing transgenic mice, similar results were obtained (Figures 11B and Supporting Information Figure S3E–H). Here, OAG induced increases in current densities in 20 out of 45 patched cells. Current density increases over basal currents amounted 0.563 ± 0.162 pA·pF−1 at −100 mV and 1.126 ± 0.213 pA·pF−1 at +100 mV. The acute addition of LMA or LC caused decreases in inward and outward current densities by 0.717 ± 0.173 and 1.753 ± 0.412 pA·pF−1, measured at −100 and +100 mV respectively. As found with rat podocytes, all mouse podocytes that displayed a discernible increase in current densities when stimulated with OAG also responded to the addition of LMA or LC with a current inhibition. From these data, we conclude that TRPC6‐like conductances in primary rodent podocyte cultures are small, but sensitive to the semi‐synthetic larixol derivatives. For comparison, the OAG‐activated non‐selective ion current densities measured under the same conditions in rat PASMC were −2.46 ± 0.93 and 21.27 ± 5.23 pA·pF−1 at −100 and +100 mV respectively (data not shown).
Discussion
Within canonical TRP channels, gain of function mutations of TRPC6 channels in familial forms of FSGS represent the best characterized channelopathy, which leads to an as yet untreatable FSGS, culminating in end‐stage kidney disease. Adding to this still unmet medical need, lung diseases, such as pulmonary hypertension, allergic airway hyperresponsiveness and ischaemia/reperfusion‐induced lung oedema, are potential fields of application for inhibitory pharmacological modulators of TRPC6 activity (Bon and Beech, 2013; Mene et al., 2013). We here propose LC, which is easily available as a semi‐synthetic larixol derivative, highly efficient and potent in suppressing TRPC6 channel‐mediated Ca2+ influx and ionic currents in both heterologous expression systems, as well as in native cell models of TRPC6 channel activity. The biological activity of LC was re‐assessed and demonstrable in various mutated TRPC6 channel constructs, carrying FSGS‐related non‐synonymous substitutions. During the process of validating the blocker efficiency in native cells, we faced the problem that native TRPC6‐like responses were hardly detectable in primary podocyte cultures or in freshly isolated glomeruli from rats or mice, including a transgenic mouse strain, which moderately overexpresses TRPC6 channels under the control of a podocyte‐specific promoter (Krall et al., 2010). To elucidate this apparent discrepancy, we assessed the mRNA and protein abundance in podocytes and glomeruli compared with pulmonary artery smooth muscle cells. We found a 20‐ to 50‐fold lower abundance of TRPC6 mRNA in podocytes and glomeruli, which would provide an explanation for the lack of strong TRPC6‐like signals in fluorometric [Ca2+]i assays. In electrophysiological patch‐clamp experiments, the expected low current densities were seen, and the efficiency of LC to inhibit these currents could be demonstrated. Thus, despite low levels of expression, up‐regulated wild‐type TRPC6 or mutated TRPC6 channel variants seem to play seminal roles in causing podocyte injury in diseased states. We expect that more selective and validated TRPC6 channel inhibitors will be crucial in exploring the therapeutic potential of pharmacological interference with this target.
Our development of new TRPC6 channel inhibitors originated from LMA (Urban et al., 2016) and showed LC to be a highly potent derivative, which is biologically active with respect to native TRPC6 channels as well as to six human TRPC6 variants carrying mutations known to cause FSGS. In comparison with some other TRPC6 channel inhibitors like norgestimate (Miehe et al., 2012) or compound 8009‐5364 (Urban et al., 2012), the selectivity of LMA or LC in inhibiting TRPC6 channels but not the closest related TRPC3 and TRPC7 channels, is considerably higher. The highly potent TRPC6 channel inhibitor SAR7334 (Maier et al., 2015) displays an even higher potency and selectivity than LC, but its efficiency and potency to inhibit FSGS‐related TRPC6 mutations have not been confirmed so far. Experiments with single‐cell [Ca2+]i measurements and electrophysiological trials demonstrated that high nanomolar or low micromolar concentrations of either LMA or LC were sufficient to inhibit the activity of FSGS‐related TRPC6 channel constructs to levels of wild‐type TRPC6 or below. Because TRPC6‐associated FSGS is an autosomal dominant disease in which a wild‐type allele coexists, and because mutations are located in intracellular domains that may affect the channel assembly, we explored if mutated TRPC6 channels still maintained their ability to form channel complexes together with the wild‐type subunits. FRET analyses clearly demonstrated that the investigated point mutations do not grossly affect the oligomerization properties of the channel. Thus, although some mutated TRPC6 channel variants seemed to require slightly higher LMA or LC concentrations for half‐maximal inhibition, a heteromeric complex formed by the gene products of the mutated and wild‐type alleles may further reduce these differences. Submicromolar IC50 values provide a promising starting point for a more detailed investigation in preclinical disease models and experimental therapies that critically involve TRPC6 channel activity. Featuring a carbamyl group rather than an ester‐bonded acetate, LC may resist intracellular esterases. Of note, the pharmacophore of LC is chemically unrelated to that of SAR7334. Thus, observing similar effects with both inhibitors would strengthen the evidence for an involvement of TRPC6 channels in biological activities that are modulated by either drug.
A medical need for inhibitors of TRPC6 channels is best exemplified by hereditary forms of FSGS that involve gain of function mutations in these ion channels. We therefore aimed at characterizing six of the previously described TRPC6 mutations that have been reported to cause hyperactive channel complexes (Reiser et al., 2005; Winn et al., 2005; Heeringa et al., 2009; Zhu et al., 2009; Hofstra et al., 2013). Our findings confirmed the phenotype of the P112Q, M132T, R175Q and Q889K variants that displayed significantly higher basal activity and OAG‐induced peaks in single‐cell [Ca2+]i measurements and larger current densities in electrophysiological patch‐clamp experiments. Interestingly, the apparent activity of the R895C variant showed a discrepancy between applied experimental methods. Basal [Ca2+]i and the OAG‐induced peak currents in electrophysiological experiments were significantly increased compared with wild‐type TRPC6 channels, which is compatible with previous reports (Reiser et al., 2005; Schlöndorff et al., 2009; Hofstra et al., 2013). However, we did not observe significantly elevated [Ca2+]i values after OAG addition in single‐cell [Ca2+]i measurements. In our experiments, the E897K mutation displayed no significant hyperactivity in either method. In carbachol‐stimulated HEK293‐M1 cells that stably express the M1 muscarinic receptor, Reiser et al. (2005) reported higher current densities for E897K‐mutated TRPC6 channels. Applying the same construct, Schlöndorff et al. (2009) have described a trend to lower basal current amplitudes, and an elevated basal [Ca2+]i was only seen in a subset of HEK293‐M1 cells that express the R895C or E897K variants. It is known that the receptor‐activated signals are significantly larger than those after direct activation of TRPC6 channels with the membrane‐permeable DAG mimetic, OAG (Estacion et al., 2004). Hence, the different modes of TRPC6 activation and differences in the cellular background may explain the differences. As LC efficiently inhibits Ca2+ entry and ionic currents through the E897K‐mutated TRPC6 channels, its use would still be justified, for example, in a preclinical disease model given by a transgenic mouse strain that overexpresses the E897K variant and develops FSGS‐like glomerular lesions (Krall et al., 2010).
In podocytes, TRPC6 is the predominant Ca2+‐permeable channel that promotes stress fibre formation via RhoA activity and thereby mediates the contractile phenotype in these cells (Tian et al., 2010). Furthermore, TRPC5 channels have been implicated in podocyte migration, by increasing Rac1 activation and a loss of stress fibres (Tian et al., 2010; Schaldecker et al., 2013). Under physiological conditions, both TRPC6 and TRPC5 channels are activated by angiotensin II acting at the AT1 receptor (Tian et al., 2010; Eckel et al., 2011), whereupon DAG is generated from phosphatidylinositol‐4,5‐bisphosphate by PLC directly and activates TRPC6 channels (Hofmann et al., 1999; Sonneveld et al., 2014). Performing microfluorimetric [Ca2+]i imaging experiments with podocytes, we therefore initially aimed at activating endogenous TRPC6 channels with the membrane‐permeable DAG analogue OAG. Surprisingly, we could not detect a significant increase in [Ca2+]i in primary podocyte cultures from rat and mice. Applying angiotensin II instead of OAG, we found that the [Ca2+]i signals were inconsistent and not significantly impaired by preincubation with LMA or LC. To activate other GPCRs that are known to be expressed in podocytes (Nitschke et al., 2001; Madhusudhan et al., 2012; Ilatovskaya et al., 2013; Roshanravan and Dryer, 2014), we also tested ATP, bradykinin, carbachol or thrombin as activators, but TRPC6‐like activities remained undetectable in microfluorimetric [Ca2+]i analyses. It is known that podocytes rapidly de‐differentiate under cell culture conditions. This process is characterized by a loss of foot processes and of podocyte‐specific proteins, such as synaptopodin, podocin or the AT1 receptor (Shankland et al., 2007). Hence, a small and inconsistent [Ca2+]i signal upon addition of angiotensin II was not unexpected. Other groups have faced the same problem and, to circumvent it, sometimes re‐introduced the AT1 receptor by transient transfection (Tian et al., 2010). The lack of a discernible activation of TRPC6 channels by OAG nonetheless intrigued us, because endogenously expressed TRPC6 channels are functionally detectable in freshly isolated PASMCs (Weissmann et al., 2006; Fuchs et al., 2011; Urban et al., 2016). We also obtained the transgenic mouse strain that overexpresses TRPC6 channels in podocytes and develops an FSGS‐like phenotype (Krall et al., 2010). Nevertheless, a TRPC6‐like Ca2+ influx was also not detectable in isolated podocytes from this mouse strain, applying OAG in fluorimetric assays. Compatible with the author's description of a twofold elevation of TRPC6 mRNA levels in glomeruli from this mouse and of low abundance of the TRPC6 protein (Krall et al., 2010), a mild podocyte‐specific increase in the expression of TRPC6 channels may still not suffice to augment TRPC6‐like Ca2+ influx signal above detection thresholds. Of note, all studies that demonstrate a robust OAG‐mediated Ca2+ influx in podocyte cultures used immortalized mouse or human podocyte cell lines rather than primary cultures (Möller et al., 2007; Nijenhuis et al., 2011; Yang et al., 2013; Sonneveld et al., 2014; Ambrus et al., 2015).
Cultured podocytes lose their cell microarchitecture, receptors or ion channels in vitro. We therefore next focused on freshly isolated intact glomeruli. Here, carbachol‐induced and angiotensin II‐induced increases in [Ca2+]i have been reported for rat and mouse glomeruli (Nitschke et al., 2000; Nitschke et al., 2001). Our data are in good agreement with these findings. However, the recently published inhibition of angiotensin II‐induced [Ca2+]i signals by SKF‐96365 (Ilatovskaya et al., 2014) was not reproducible with the TRPC6 channel inhibitors LMA or LC. In our hands, 1 μM SKF‐96365 was not sufficiently effective to block recombinant TRPC6 channels and single‐channel properties of TRPC6 channels are characterized by markedly shorter open times, very low spontaneous activity, an almost instantaneous opening after GPCR stimulation, a more rapid deactivation, a voltage dependence of their open probability and a larger unitary conductance (Hofmann et al., 1999; Urban et al., 2016). In rat glomeruli, the longer lasting, carbachol‐induced [Ca2+]i signal enabled an acute application of LMA, but again, the signal did not seem to critically depend on TRPC6 channels. Finally, our analyses of TRPC6 mRNA and protein in freshly isolated glomeruli and in cultured podocytes provided an explanation for the absence of robust TRPC6‐related [Ca2+]i signals. The 20‐ to 50‐fold lower abundance of TRPC6 mRNA in podocytes compared with PASMCs matched with electrophysiological findings. OAG‐induced current densities in PASMCs were about 20‐fold higher than in podocytes, which only reached about 1 pA·pF−1. Interestingly, few studies utilizing freshly isolated podocytes instead of the immortalized cell lines confirmed these very small current amplitudes upon stimulation with angiotensin II (Eckel et al., 2011; Kalwa et al., 2015).
The partial inhibition of TRPC6 channel activity by low concentrations of LMA or LC may be exploited to design experimental therapies in pulmonary and renal diseases. For example, about 0.5–2 μM LC suppressed ionic currents through the most strongly overactive TRPC6 channel mutations (P112Q, M132T and R175Q) to a level that corresponds to those of wild‐type TRPC6 channels. In lung diseases or to prevent ischaemia–reperfusion‐induced pulmonary oedema, for example, in a scenario of lung or combined heart–lung transplantation, a beneficial effect of inhibition of TRPC6 channels still needs to be demonstrated. Consequently, the required systemic plasma concentrations or tissue concentrations of TRPC6 inhibitors are not yet established. In the lung or in organ transplantation, however, topical application or addition to the preservation fluid may limit systemic effects of TRPC6 inhibitors and thereby increase the tolerability and safety of use. In familial forms of FSGS, a lifelong application of TRPC6 channel inhibitors, for example, in carriers of TRPC6 mutations may be considered to prevent or at least delay the onset of nephrotic syndrome and requirement of kidney transplantation. On the other hand, as TRPC6 channels may also exert protective functions in complement‐dependent forms of glomerular injury (Kistler et al., 2013), the risk to benefit ratio of the pharmacological inhibition of TRPC6 channels needs to be critically evaluated. Appropriate animal models of human kidney or lung diseases together with validated new TRPC6 of TRPC6 channel inhibitors, such as LC or aminoindanes (Maier et al., 2015), now provide a rational basis for the validation of TRPC6 of TRPC6 channels as a pharmacological target by designing preclinical models, assessment of the safety profile and by testing their efficacy and tolerability in experimental therapies.
Author contributions
M.S., J.R. and N.U. participated in research design and wrote the manuscript. S.N. and N.U. performed experiments and data analysis. A.H. and S.H. synthesized and analysed new chemical derivatives of larixol.
Conflict of interest
The authors declare no conflicts of interest.
Declaration of transparency and scientific rigour
This Declaration acknowledges that this paper adheres to the principles for transparent reporting and scientific rigour of preclinical research recommended by funding agencies, publishers and other organisations engaged with supporting research.
Supporting information
Figure S1 Lack of GPCR‐induced secondary increases in [Ca2+]i in storedepleted primary podocytes from B6.Cg‐Tg(NPHS2‐Trpc6) F419Walz/J mice. The time course of [Ca2+]i was measured in fura‐2‐loaded primary podocytes from B6.Cg‐Tg(NPHS2‐Trpc6) F419Walz/J mice during sequential addition of 2 μM thapsigargin to deplete inositol‐1,4,5‐trisphosphate‐sensitive intracellular Ca2+ stores, followed by the addition of either 100 μM ATP, 10 μM bradykinin or 0.5 units/mL thrombin as indicated. Left panels: time course of [Ca2+]i in single podocytes (grey traces), and averaged signals (black trace). Right panels: statistical analysis of [Ca2+]i measured at the indicated time points before (1, 3) and after (2, 4) exposure to thapsigargin (1, 2) and GPCR activators (3, 4) respectively. Data represent means and S.E. of 5–6 experiments each, performed as shown in the respective left panels. Note the lack of a significant [Ca2+]i increase during GPCR activation.
Figure S2 Stimulation of podocytes and glomeruli with the potent TRPC6 activator GSK1702934A. (A) Stably transfected HEK293 cells overexpressing human TRPC6 (left panel) and parental HEK293 cells (right panel) were investigated regarding their sensitivity to flufenamic acid (FFA), GSK1702934A and OAG by performing fluorometric Ca2+ assays as described in Figure 1 of the main manuscript. Shown are representative traces of the highest (solid lines) and the second highest (dashed lines) applied compound concentrations. (B) Concentration‐response curves of the known TRPC6 activators determined in 4–9 independent experiments with the HEKhTRPC6‐YFP cell line (means and S.E.). Note the poor potency and the cross‐activation of parental HEK293 cells by 250–500 μM FFA (C) Data represent single‐cell [Ca2+]i measurements in fura‐2‐loaded Wistar rat PASMC (dotted line), as well as in rat and mouse podocytes (black and grey line). At a saturating TRPC6‐activating concentration of 20 μM GSK1702934A (see panel B) failed to elicit increases in [Ca2+]i in rat or mouse podocytes, but caused robust [Ca2+]i signals in rat PASMC. Left panel: time course of 9–12 averaged [Ca2+]i recordings. Right panel: statistical analysis of basal and peak [Ca2+]i, signals respective to left panel. (D) Micrographs of fura‐2‐loaded rat and mouse glomeruli that were obtained either by squeezing renal cortex through a sieve (lower panel) or by digestion of renal cortex with collagenase (upper panel), taken at an excitation wavelength of 380 nm. Bars: 100 μm. Note the partial preservation of Bowman's capsules in squeeze‐dissociated glomeruli. (E,F) Rat and mouse glomeruli of both preparation variants shown in (D) were examined in similar experiments like in (C) but with HBS containing 2 mM CaCl2. The time course of [Ca2+]i in mechanically isolated, squeezed glomeruli (dashed traces) and in enzymatically isolated glomeruli (solid lines) is shown. After stimulation with 20 μM GSK1702934A, an additional stimulation with 100 μM carbachol for Wistar rat glomeruli (E) or 10 μM angiotensin II for B6.Cg‐Tg(NPHS2‐Trpc6) F419Walz/J transgenic mice glomeruli (F) was applied as a positive control. Left panels: averaged [Ca2+]i traces of whole glomeruli measured in 5–10 experiments with one imaging experiment containing data from 20–35 rat or 40–90 mouse glomeruli. Right panels: statistical analysis (means and SD) of time points indicated in left panels. #: P < 0.05 compared to the resting [Ca2+]i.
Table S1 Sequence of oligonucleotides used for mutagenesis and RTPCR.
Acknowledgements
We thank Anne‐Kathrin Krause for expert technical assistance and animal care and Thomas Rudolph for technical support of the chemical synthesis and analysis. This work was supported by the Deutsche Forschungsgemeinschaft (TRR 152 to M.S. and TRR 67 to J.R.).
Urban, N. , Neuser, S. , Hentschel, A. , Köhling, S. , Rademann, J. , and Schaefer, M. (2017) Pharmacological inhibition of focal segmental glomerulosclerosis‐related, gain of function mutants of TRPC6 channels by semi‐synthetic derivatives of larixol. British Journal of Pharmacology, 174: 4099–4122. doi: 10.1111/bph.13977.
References
- Abkhezr M, Kim EY, Roshanravan H, Nikolos F, Thomas C, Hagmann H et al (2015). Pleiotropic signaling evoked by tumor necrosis factor in podocytes. Am J Physiol Renal Physiol 309: F98–108. [DOI] [PubMed] [Google Scholar]
- Abramoff MD, Magalhaes PJ (2004). Image processing with ImageJ. Biophotonics Int 11: 36–42. [Google Scholar]
- Alexander SPH, Catterall WA, Kelly E, Marrion N, Peters JA, Benson HE et al (2015a). The Concise Guide to PHARMACOLOGY 2015/16: Voltage‐gated ion channels. Br J Pharmacol 172: 5904–5941. [DOI] [PMC free article] [PubMed] [Google Scholar]
- Alexander SPH, Fabbro D, Kelly E, Marrion N, Peters JA, Benson HE et al (2015b). The Concise Guide to PHARMACOLOGY 2015/16: Enzymes. Br J Pharmacol 172: 6024–6109. [DOI] [PMC free article] [PubMed] [Google Scholar]
- Ambrus L, Olah A, Olah T, Balla G, Saleem MA, Orosz P et al (2015). Inhibition of TRPC6 by protein kinase C isoforms in cultured human podocytes. J Cell Mol Med 19: 2771–2779. [DOI] [PMC free article] [PubMed] [Google Scholar]
- Anderson M, Roshanravan H, Khine J, Dryer SE (2014). Angiotensin II activation of TRPC6 channels in rat podocytes requires generation of reactive oxygen species. J Cell Physiol 229: 434–442. [DOI] [PubMed] [Google Scholar]
- Bon RS, Beech DJ (2013). In pursuit of small molecule chemistry for calcium‐permeable non‐selective TRPC channels – mirage or pot of gold? Br J Pharmacol 170: 459–474. [DOI] [PMC free article] [PubMed] [Google Scholar]
- Curtis MJ, Bond RA, Spina D, Ahluwalia A, Alexander SP, Giembycz MA et al (2015). Experimental design and analysis and their reporting: new guidance for publication in BJP. Br J Pharmacol 172: 3461–3471. [DOI] [PMC free article] [PubMed] [Google Scholar]
- Dietrich A, Gudermann T (2014). TRPC6: physiological function and pathophysiological relevance. Handb Exp Pharmacol 222: 157–188. [DOI] [PubMed] [Google Scholar]
- Eckel J, Lavin PJ, Finch EA, Mukerji N, Burch J, Gbadegesin R et al (2011). TRPC6 enhances angiotensin II‐induced albuminuria. J Am Soc Nephrol 22: 526–535. [DOI] [PMC free article] [PubMed] [Google Scholar]
- Edelstein A, Amodaj N, Hoover K, Vale R, Stuurman N (2010). Computer control of microscopes using microManager. Curr Protoc Mol Biol Chapter 14, Unit14. 20. https://doi.org/10.1002/0471142727.mb1420s92. [DOI] [PMC free article] [PubMed] [Google Scholar]
- El HS, Reiser J (2011). TRPC channel modulation in podocytes‐inching toward novel treatments for glomerular disease. Pediatr Nephrol 26: 1057–1064. [DOI] [PMC free article] [PubMed] [Google Scholar]
- Estacion M, Li S, Sinkins WG, Gosling M, Bahra P, Poll C et al (2004). Activation of human TRPC6 channels by receptor stimulation. J Biol Chem 279: 22047–22056. [DOI] [PubMed] [Google Scholar]
- Fuchs B, Rupp M, Ghofrani HA, Schermuly RT, Seeger W, Grimminger F et al (2011). Diacylglycerol regulates acute hypoxic pulmonary vasoconstriction via TRPC6. Respir Res 12: 20. [DOI] [PMC free article] [PubMed] [Google Scholar]
- Gigante M, Caridi G, Montemurno E, Soccio M, d'Apolito M, Cerullo G et al (2011). TRPC6 mutations in children with steroid‐resistant nephrotic syndrome and atypical phenotype. Clin J Am Soc Nephrol 6: 1626–1634. [DOI] [PubMed] [Google Scholar]
- Heeringa SF, Moller CC, Du J, Yue L, Hinkes B, Chernin G et al (2009). A novel TRPC6 mutation that causes childhood FSGS. PLoS One 4: e7771. [DOI] [PMC free article] [PubMed] [Google Scholar]
- Hellwig N, Albrecht N, Harteneck C, Schultz G, Schaefer M (2005). Homo‐ and heteromeric assembly of TRPV channel subunits. J Cell Sci 118: 917–928. [DOI] [PubMed] [Google Scholar]
- Hofmann T, Obukhov AG, Schaefer M, Harteneck C, Gudermann T, Schultz G (1999). Direct activation of human TRPC6 and TRPC3 channels by diacylglycerol. Nature 397: 259–263. [DOI] [PubMed] [Google Scholar]
- Hofmann T, Schaefer M, Schultz G, Gudermann T (2002). Subunit composition of mammalian transient receptor potential channels in living cells. Proc Natl Acad Sci U S A 99: 7461–7466. [DOI] [PMC free article] [PubMed] [Google Scholar]
- Hofstra JM, Lainez S, van Kuijk WH, Schoots J, Baltissen MP, Hoefsloot LH et al (2013). New TRPC6 gain‐of‐function mutation in a non‐consanguineous Dutch family with late‐onset focal segmental glomerulosclerosis. Nephrol Dial Transplant 28: 1830–1838. [DOI] [PubMed] [Google Scholar]
- Ilatovskaya DV, Palygin O, Chubinskiy‐Nadezhdin V, Negulyaev YA, Ma R, Birnbaumer L et al (2014). Angiotensin II has acute effects on TRPC6 channels in podocytes of freshly isolated glomeruli. Kidney Int 86: 506–514. [DOI] [PMC free article] [PubMed] [Google Scholar]
- Ilatovskaya DV, Palygin O, Levchenko V, Staruschenko A (2013). Pharmacological characterization of the P2 receptors profile in the podocytes of the freshly isolated rat glomeruli. Am J Physiol Cell Physiol 305: C1050–C1059. [DOI] [PMC free article] [PubMed] [Google Scholar]
- Ilatovskaya DV, Staruschenko A (2015). TRPC6 channel as an emerging determinant of the podocyte injury susceptibility in kidney diseases. Am J Physiol Renal Physiol 309: F393–F397. [DOI] [PMC free article] [PubMed] [Google Scholar]
- Kalwa H, Storch U, Demleitner J, Fiedler S, Mayer T, Kannler M et al (2015). Phospholipase C ε induced TRPC6 activation: a common but redundant mechanism in primary podocytes. J Cell Physiol 230: 1389–1399. [DOI] [PMC free article] [PubMed] [Google Scholar]
- Kilkenny C, Browne W, Cuthill IC, Emerson M, Altman DG (2010). Animal research: reporting in vivo experiments: the ARRIVE guidelines. Br J Pharmacol 160: 1577–1579. [DOI] [PMC free article] [PubMed] [Google Scholar]
- Kim EY, Anderson M, Dryer SE (2012). Insulin increases surface expression of TRPC6 channels in podocytes: role of NADPH oxidases and reactive oxygen species. Am J Physiol Renal Physiol 302: F298–F307. [DOI] [PMC free article] [PubMed] [Google Scholar]
- Kistler AD, Singh G, Altintas MM, Yu H, Fernandez IC, Gu C et al (2013). Transient receptor potential channel 6 (TRPC6) protects podocytes during complement‐mediated glomerular disease. J Biol Chem 288: 36598–36609. [DOI] [PMC free article] [PubMed] [Google Scholar]
- Krall P, Canales CP, Kairath P, Carmona‐Mora P, Molina J, Carpio JD et al (2010). Podocyte‐specific overexpression of wild type or mutant trpc6 in mice is sufficient to cause glomerular disease. PLoS One 5: e12859. [DOI] [PMC free article] [PubMed] [Google Scholar]
- Lenz JC, Reusch HP, Albrecht N, Schultz G, Schaefer M (2002). Ca2+‐controlled competitive diacylglycerol binding of protein kinase C isoenzymes in living cells. J Cell Biol 159: 291–302. [DOI] [PMC free article] [PubMed] [Google Scholar]
- Madhusudhan T, Wang H, Straub BK, Grone E, Zhou Q, Shahzad K et al (2012). Cytoprotective signaling by activated protein C requires protease‐activated receptor‐3 in podocytes. Blood 119: 874–883. [DOI] [PMC free article] [PubMed] [Google Scholar]
- Maier T, Follmann M, Hessler G, Kleemann HW, Hachtel S, Fuchs B et al (2015). Discovery and pharmacological characterization of a novel potent inhibitor of diacylglycerol‐sensitive TRPC cation channels. Br J Pharmacol 172: 3650–3660. [DOI] [PMC free article] [PubMed] [Google Scholar]
- McGrath JC, Lilley E (2015). Implementing guidelines on reporting research using animals (ARRIVE etc.): new requirements for publication in BJP. Br J Pharmacol 172: 3189–3193. [DOI] [PMC free article] [PubMed] [Google Scholar]
- Mene P, Punzo G, Pirozzi N (2013). TRP channels as therapeutic targets in kidney disease and hypertension. Curr Top Med Chem 13: 386–397. [DOI] [PubMed] [Google Scholar]
- Miehe S, Crause P, Schmidt T, Lohn M, Kleemann HW, Licher T et al (2012). Inhibition of diacylglycerol‐sensitive TRPC channels by synthetic and natural steroids. PLoS One 7: e35393. [DOI] [PMC free article] [PubMed] [Google Scholar]
- Möller CC, Wei C, Altintas MM, Li J, Greka A, Ohse T et al (2007). Induction of TRPC6 channel in acquired forms of proteinuric kidney disease. J Am Soc Nephrol 18: 29–36. [DOI] [PubMed] [Google Scholar]
- Nijenhuis T, Sloan AJ, Hoenderop JG, Flesche J, van Goor H, Kistler AD et al (2011). Angiotensin II contributes to podocyte injury by increasing TRPC6 expression via an NFAT‐mediated positive feedback signaling pathway. Am J Pathol 179: 1719–1732. [DOI] [PMC free article] [PubMed] [Google Scholar]
- Nitschke R, Henger A, Ricken S, Gloy J, Muller V, Greger R et al (2000). Angiotensin II increases the intracellular calcium activity in podocytes of the intact glomerulus. Kidney Int 57: 41–49. [DOI] [PubMed] [Google Scholar]
- Nitschke R, Henger A, Ricken S, Müller V, Köttgen M, Bek M et al (2001). Acetylcholine increases the free intracellular calcium concentration in podocytes in intact rat glomeruli via muscarinic M5 receptors. J Am Soc Nephrol 12: 678–687. [DOI] [PubMed] [Google Scholar]
- Reiser J, Polu KR, Möller CC, Kenlan P, Altintas MM, Wei C et al (2005). TRPC6 is a glomerular slit diaphragm‐associated channel required for normal renal function. Nat Genet 37: 739–744. [DOI] [PMC free article] [PubMed] [Google Scholar]
- Riehle M, Büscher AK, Gohlke BO, Kassmann M, Kolatsi‐Joannou M, Bräsen et al. (2016). TRPC6 G757D loss‐of‐function mutation associates with FSGS. J Am Soc Nephrol 27: 2771–2783. [DOI] [PMC free article] [PubMed] [Google Scholar]
- Roshanravan H, Dryer SE (2014). ATP acting through P2Y receptors causes activation of podocyte TRPC6 channels: role of podocin and reactive oxygen species. Am J Physiol Renal Physiol 306: F1088–F1097. [DOI] [PMC free article] [PubMed] [Google Scholar]
- Schaldecker T, Kim S, Tarabanis C, Tian D, Hakroush S, Castonguay P et al (2013). Inhibition of the TRPC5 ion channel protects the kidney filter. J Clin Invest 123: 5298–5309. [DOI] [PMC free article] [PubMed] [Google Scholar]
- Schlöndorff J, Del CD, Carrasquillo R, Lacey V, Pollak MR (2009). TRPC6 mutations associated with focal segmental glomerulosclerosis cause constitutive activation of NFAT‐dependent transcription. Am J Physiol Cell Physiol 296: C558–C569. [DOI] [PMC free article] [PubMed] [Google Scholar]
- Shankland SJ, Pippin JW, Reiser J, Mundel P (2007). Podocytes in culture: past, present, and future. Kidney Int 72: 26–36. [DOI] [PubMed] [Google Scholar]
- Sonneveld R, van der Vlag J, Baltissen MP, Verkaart SA, Wetzels JF, Berden JH et al (2014). Glucose specifically regulates TRPC6 expression in the podocyte in an AngII‐dependent manner. Am J Pathol 184: 1715–1726. [DOI] [PubMed] [Google Scholar]
- Southan C, Sharman JL, Benson HE, Faccenda E, Pawson AJ, Alexander SPH et al (2016). The IUPHAR/BPS Guide to PHARMACOLOGY in 2016: towards curated quantitative interactions between 1300 protein targets and 6000 ligands. Nucl Acids Res 44: D1054–D1068. [DOI] [PMC free article] [PubMed] [Google Scholar]
- Sprangers B, Meijers B, Appel G (2016). FSGS: diagnosis and diagnostic work‐up. Biomed Res Int 2016 4632768. [DOI] [PMC free article] [PubMed] [Google Scholar]
- Szabo T, Ambrus L, Zakany N, Balla G, Biro T (2015). Regulation of TRPC6 ion channels in podocytes – implications for focal segmental glomerulosclerosis and acquired forms of proteinuric diseases. Acta Physiol Hung 102: 241–251. [DOI] [PubMed] [Google Scholar]
- Tian D, Jacobo SM, Billing D, Rozkalne A, Gage SD, Anagnostou T et al (2010). Antagonistic regulation of actin dynamics and cell motility by TRPC5 and TRPC6 channels. Sci Signal 3: ra77. [DOI] [PMC free article] [PubMed] [Google Scholar]
- Urban N, Hill K, Wang L, Kuebler WM, Schaefer M (2012). Novel pharmacological TRPC inhibitors block hypoxia‐induced vasoconstriction. Cell Calcium 51: 194–206. [DOI] [PubMed] [Google Scholar]
- Urban N, Wang L, Kwiek S, Rademann J, Kuebler WM, Schaefer M (2016). Identification and validation of larixyl acetate as a potent TRPC6 inhibitor. Mol Pharmacol 89: 197–213. [DOI] [PubMed] [Google Scholar]
- Wang Z, Wei X, Zhang Y, Ma X, Li B, Zhang S et al (2009). NADPH oxidase‐derived ROS contributes to upregulation of TRPC6 expression in puromycin aminonucleoside‐induced podocyte injury. Cell Physiol Biochem 24: 619–626. [DOI] [PubMed] [Google Scholar]
- Weissmann N, Dietrich A, Fuchs B, Kalwa H, Ay M, Dumitrascu R et al (2006). Classical transient receptor potential channel 6 (TRPC6) is essential for hypoxic pulmonary vasoconstriction and alveolar gas exchange. Proc Natl Acad Sci U S A 103: 19093–19098. [DOI] [PMC free article] [PubMed] [Google Scholar]
- Winn MP, Conlon PJ, Lynn KL, Farrington MK, Creazzo T, Hawkins AF et al (2005). A mutation in the TRPC6 cation channel causes familial focal segmental glomerulosclerosis. Science 308: 1801–1804. [DOI] [PubMed] [Google Scholar]
- Yang H, Zhao B, Liao C, Zhang R, Meng K, Xu J et al (2013). High glucose‐induced apoptosis in cultured podocytes involves TRPC6‐dependent calcium entry via the RhoA/ROCK pathway. Biochem Biophys Res Commun 434: 394–400. [DOI] [PubMed] [Google Scholar]
- Zhu B, Chen N, Wang ZH, Pan XX, Ren H, Zhang W et al (2009). Identification and functional analysis of a novel TRPC6 mutation associated with late onset familial focal segmental glomerulosclerosis in Chinese patients. Mutat Res 664: 84–90. [DOI] [PubMed] [Google Scholar]
Associated Data
This section collects any data citations, data availability statements, or supplementary materials included in this article.
Supplementary Materials
Figure S1 Lack of GPCR‐induced secondary increases in [Ca2+]i in storedepleted primary podocytes from B6.Cg‐Tg(NPHS2‐Trpc6) F419Walz/J mice. The time course of [Ca2+]i was measured in fura‐2‐loaded primary podocytes from B6.Cg‐Tg(NPHS2‐Trpc6) F419Walz/J mice during sequential addition of 2 μM thapsigargin to deplete inositol‐1,4,5‐trisphosphate‐sensitive intracellular Ca2+ stores, followed by the addition of either 100 μM ATP, 10 μM bradykinin or 0.5 units/mL thrombin as indicated. Left panels: time course of [Ca2+]i in single podocytes (grey traces), and averaged signals (black trace). Right panels: statistical analysis of [Ca2+]i measured at the indicated time points before (1, 3) and after (2, 4) exposure to thapsigargin (1, 2) and GPCR activators (3, 4) respectively. Data represent means and S.E. of 5–6 experiments each, performed as shown in the respective left panels. Note the lack of a significant [Ca2+]i increase during GPCR activation.
Figure S2 Stimulation of podocytes and glomeruli with the potent TRPC6 activator GSK1702934A. (A) Stably transfected HEK293 cells overexpressing human TRPC6 (left panel) and parental HEK293 cells (right panel) were investigated regarding their sensitivity to flufenamic acid (FFA), GSK1702934A and OAG by performing fluorometric Ca2+ assays as described in Figure 1 of the main manuscript. Shown are representative traces of the highest (solid lines) and the second highest (dashed lines) applied compound concentrations. (B) Concentration‐response curves of the known TRPC6 activators determined in 4–9 independent experiments with the HEKhTRPC6‐YFP cell line (means and S.E.). Note the poor potency and the cross‐activation of parental HEK293 cells by 250–500 μM FFA (C) Data represent single‐cell [Ca2+]i measurements in fura‐2‐loaded Wistar rat PASMC (dotted line), as well as in rat and mouse podocytes (black and grey line). At a saturating TRPC6‐activating concentration of 20 μM GSK1702934A (see panel B) failed to elicit increases in [Ca2+]i in rat or mouse podocytes, but caused robust [Ca2+]i signals in rat PASMC. Left panel: time course of 9–12 averaged [Ca2+]i recordings. Right panel: statistical analysis of basal and peak [Ca2+]i, signals respective to left panel. (D) Micrographs of fura‐2‐loaded rat and mouse glomeruli that were obtained either by squeezing renal cortex through a sieve (lower panel) or by digestion of renal cortex with collagenase (upper panel), taken at an excitation wavelength of 380 nm. Bars: 100 μm. Note the partial preservation of Bowman's capsules in squeeze‐dissociated glomeruli. (E,F) Rat and mouse glomeruli of both preparation variants shown in (D) were examined in similar experiments like in (C) but with HBS containing 2 mM CaCl2. The time course of [Ca2+]i in mechanically isolated, squeezed glomeruli (dashed traces) and in enzymatically isolated glomeruli (solid lines) is shown. After stimulation with 20 μM GSK1702934A, an additional stimulation with 100 μM carbachol for Wistar rat glomeruli (E) or 10 μM angiotensin II for B6.Cg‐Tg(NPHS2‐Trpc6) F419Walz/J transgenic mice glomeruli (F) was applied as a positive control. Left panels: averaged [Ca2+]i traces of whole glomeruli measured in 5–10 experiments with one imaging experiment containing data from 20–35 rat or 40–90 mouse glomeruli. Right panels: statistical analysis (means and SD) of time points indicated in left panels. #: P < 0.05 compared to the resting [Ca2+]i.
Table S1 Sequence of oligonucleotides used for mutagenesis and RTPCR.