Abstract
Survival rate at low temperature becomes a crucial strategy since temperature change often leads to fluctuations in the insect population. Microbes play important roles in the process of resisting low temperature. In this study, we analyzed gut bacterial communities from Chinese white pine beetle Dendroctonus armandi which remained overwintering process under natural conditions from October 2015 to January 2016, monthly, in the Qinling Mountains, Shaanxi, China using Illumina MiSeq sequencing. A total of 835,227 high-quality sequences and 48 singleton operational taxonomic units were obtained. Gut bacterial communities showed variation in relative abundance during the overwintering stage. As ambient temperature declined, Proteobacteria (mostly γ-proteobacteria) became the predominant phylum in the larvae guts, and followed with Actinobacteria and Firmicutes, respectively. In particular, there was no Deinococcus-Thermus in January 2016. Thermoleophilia appeared in November and December 2015, but not for October 2015 and January 2016, nor did δ-proteobacteria. By contrast, gut bacterial community compositions increased in relative abundance in November and December 2015. This study provided initial evidence that gut bacterial communities were associated with the larvae overwintering process at low temperature. Moreover, no complementary studies combining overwintering process of Coleoptera insect and high-throughput sequencing were carried out, paying particular attention to insect in cold season.
Introduction
Bark beetle, especially Dendroctonus specie which causes serious damage to coniferous trees has been widely recognized for their ecological significance in forests1,2. Their damage results in enormous economic loss and becomes a dominating disruptive factor for the ecosystem3. Microbial communities, ranging from simple to complex, can be harbored by bark beetles4. Microbes make important contributions to the host insects’ life history and physiology5,6.
The Chinese white pine beetle Dendroctonus armandi Tsai and Li (Coleoptera: Curculionidae: Scolytinae) is the most damaging forest insect in the Qinling Mountains, Shaanxi, China7,8. D. armandi as a leading serious forest pest invades the phloem of Pinus armandi Franch and causes high mortality of healthy P. armandi in natural forest ecosystems, reaching epidemic proportions7,8. Various aspects of D. armandi’s biology and physiology have been studied because of its importance, such as its ecological niche9, life cycle10 and symbiotic fungi11. However, little is known about its larvae gut bacterial communities during overwintering stage at low temperature.
Insect faces a great challenge in surviving at low temperatures in frigid and temperate zones8,12,13. Insect survival rate in overwintering stage is a major factor limiting their population and distribution8. Hence, the lowest temperature in winter is considered as an vital element on insects’ range expansion and outbreak frequency8,14–16. The insects’ survival rates at low temperatures influence their population dynamics8,17 and geographical distribution8,18.
Gut microbiota play important roles in insects’ life histories contributing to effective reproduction rate, community interactions and survival rates by metabolizing toxins and providing protection against a variety of environmental stresses19–22. Bacteria can contribute to the insects which feed on a nutrient-poor food source by nutritional supplements23–26. Insects that exploited woody substrates are particularly nutrient poor and available to competitors once the woody substrate are depleted27–29. Bacteria can provide nutritional supplements such as amino acids23, essential vitamins24, nitrogen and carbon compounds25,26. Such relationships seem to be widespread among insects that exploit woody substrates. Host insects show slow growth and high mortality if they are short of symbiont30. Most of studies focus on the variation of endosymbionts during the insect development stage31–33; however, it is unknown if the composition of endosymbionts varies during the overwintering stage at low ambient temperature. A certain type of bacteria was first reported in stinkbugs (Plataspidae) via a “symbiont capsule” which was transmitted vertically34. We hypothesized that some relationships existed between gut bacterial community structure and the overwintering process of D. armandi larvae at low temperature. In order to understanding the roles of endosymbiont community members in bark beetles, the community composition should be defined in the first step35,36.
In our study, gut bacterial communities of D. armandi larvae at low temperatures were investigated using high-throughput sequencing method during overwintering stage. We quantified the composition and structure of gut bacterial communities in each month from October 2015 to January 2016 in winter.
Results
Environmental conditions
The average of daily total sunshine duration started with 5.285 ± 1.417 (s.d.) hours in October 2015 and declined to 3.218 ± 1.137 (s.d.), 3.837 ± 0.820 (s.d.) hours in November and December 2015, respectively. Finally, the value was up to 4.069 ± 0.818 (s.d.) hours in January 2016 (Table 1). The average daily rainfall was 1.016 ± 3.108 (s.d.) mm in October 2015. In December 2015 and January 2016, the value decreased to 0.023 ± 0.062 (s.d.) and 0.048 ± 0.146 (s.d.) mm, before it increased to 1.740 ± 2.416 (s.d.) mm in November 2015 (Table 1). The mean daily air temperature was around 0 °C, and ranged from −5.045 ± 2.314 (s.d.) to 5.069 ± 1.958 (s.d.) °C in December 2015. The mean daily maximum air humidity was 96.155 ± 3.593 (s.d.)% in October 2015 and the mean daily minimum air humidity was 34.326 ± 3.502 (s.d.)% in December 2015 (Table 1). The mean daily maximum and minimum air humidity were decreased during the winter and ranged from the lowest value of 34.643 ± 3.620 (s.d.)% to the highest value of 81.670 ± 5.986 (s.d.)% in January 2016 (Table 1).
Table 1.
Fundamental meteorological data from October 2015 to January 2016.
| Sampling Time | SunDur (Hour) | Rain (mm) | AirT_Max (°C) | AirT_Min (°C) | RH_Max (%) | RH_Min (%) |
|---|---|---|---|---|---|---|
| Oct. 2015 | 5.285 ± 1.417 | 1.016 ± 0.108 | 17.285 ± 1.073 | 6.026 ± 1.350 | 96.155 ± 3.593 | 47.837 ± 3.200 |
| Nov. 2015 | 3.218 ± 1.137 | 1.740 ± 0.416 | 9.118 ± 1.410 | 0.089 ± 0.426 | 93.492 ± 8.524 | 52.563 ± 5.032 |
| Dec. 2015 | 3.837 ± 0.820 | 0.023 ± 0.062 | 5.069 ± 1.958 | −5.045 ± 1.314 | 83.035 ± 9.095 | 34.326 ± 3.502 |
| Jan. 2016 | 4.069 ± 0.818 | 0.048 ± 0.146 | 5.711 ± 1.044 | −5.167 ± 1.365 | 81.670 ± 5.986 | 34.643 ± 3.620 |
SunDur, accumulated duration of sunshine; Rain, average rainfall; AirT_Max, maximum air temperature; AirT_Min, minimum air temperature; RH_Max, maximum relative humidity; RH_Min, minimum relative humidity.
Overview of sequencing analysis
The proportion which equaled the number of high quality sequences/valid sequences (Shared reads/Total reads) was over 90% in each month, expect for December 2015 (89.57%) in the current study (Table 2). After sequence trimming, quality filtering and removal of chimeras, 835,227 high-quality sequences remained, with an average length of 273 bases (Fig. 1). The mean number of sequences per sample was 208,807 ± 9,698 (s.d.). The rarefaction curves in four months had approached the plateau phase, and they were unlikely that more bacterial communities composition would be detected with additional sequencing efforts (Fig. 2). These high-quality sequences were clustered into different operational taxonomic units (OTUs) by the UPARSE pipeline using a threshold of 97% identity (200,833; 208,496; 188,307 and 237,592 OTUs for October, November, December 2015 and January 2016, respectively). Number of OTUs dramatically increased in January 2016 compared with October, November and December 2015 (F = 16.808, d.f. = 3, P < 0.001) (Fig. 3). These high-quality sequences were classified into 7 phyla, 15 classes, 28 oredrs, 54 families and 64 genera (Supplementary Tables S1, S2 and S3). In total, 835,227 OTUs were singletons. We classified 566,638 OTUs of high-quality sequences to the Proteobacteria, 232,256 OTUs to the Firmicutes, 22,727 OTUs to the Actinobacteria, 10,491 OTUs to the Tenericutes, 1,613 OTUs to the Bacteroidetes, 1,355 OTUs to the Acidobacteria and 147 OTUs to the Deinococcus-Thermus on the phylum level (Table 2). Detailed characteristics of each phylum were listed in Supplementary Tables S1, S2 and S3.
Table 2.
Shared seven phyla communities of Dendroctonus armandi larvae from October 2015 to January 2016.
| Phylum | Oct. 2015 | Nov. 2015 | Dec. 2015 | Jan. 2016 | SUM | Shared OTUs |
|---|---|---|---|---|---|---|
| Proteobacteria | 24,443 | 147,705 | 158,997 | 235,494 | 566,638 | 25 |
| Actinobacteria | 706 | 18,450 | 3,368 | 203 | 22,727 | 9 |
| Bacteroidetes | 78 | 575 | 918 | 42 | 1,613 | 4 |
| Firmicutes | 175,477 | 33,023 | 21,980 | 1,776 | 232,256 | 7 |
| Acidobacteria | 6 | 422 | 904 | 23 | 1,355 | 2 |
| Tenericutes | 122 | 8,319 | 1,996 | 54 | 10,491 | 1 |
| Deinococcus-Thermus | 1 | 2 | 144 | 0 | 147 | 0 |
| Total shared reads | 200,833 | 208,496 | 188,307 | 237,592 | 835,277 | 48 |
| Total reads | 200,912 | 209,647 | 210,228 | 237,721 | ||
| Shared reads/Total reads | 99.96% | 99.45% | 89.57% | 99.95% |
OTU,operational taxonomic unit.
Figure 1.
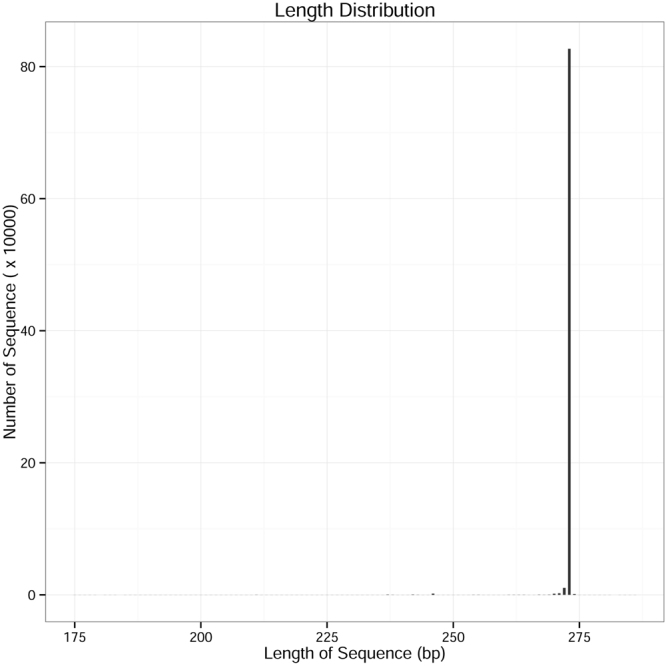
The length distribution of the high quality sequences.
Figure 2.
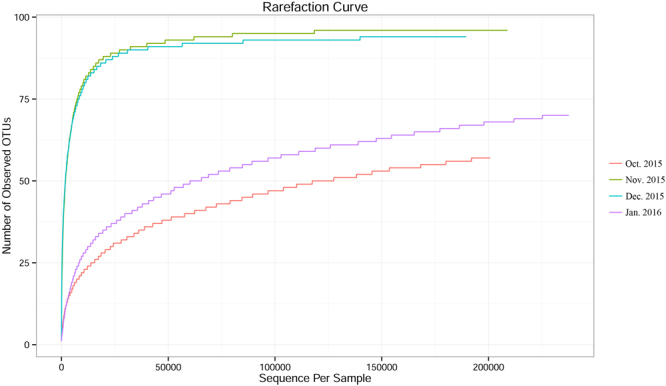
The rarefaction curve in each month from October 2015 to January 2016.
Figure 3.
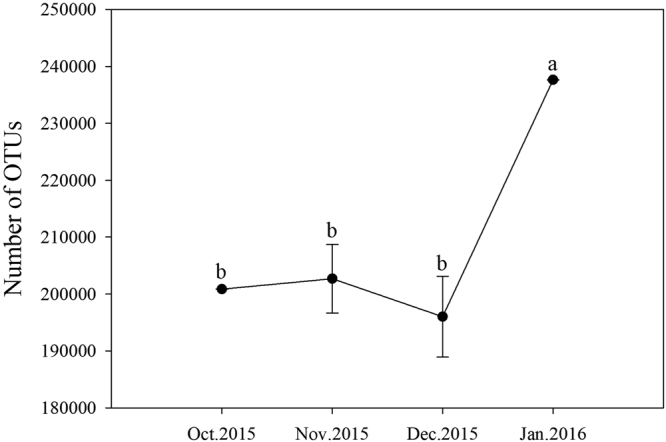
Number of OTUs in Dendroctonus armandi larval gut bacteria in each month from October 2015 to January 2016. Note: Values are presented as means ± SE. Values with the different lowercase letters in the contents are significantly different (P < 0.05, Tukey’s multiple comparisons test after analysis of variance).
Bacterial diversity during overwintering period
The community richness and community diversity for D. armandi larvae rapidly increased in November and December 2015 compared with the larvae collected in October 2015 and January 2016 (Table 3). A Venn diagram was used to compare the similarities and differences between the communities in the different months (Fig. 4). The communities among Oct. 2015, Nov. 2015, Dec. 2015 and Jan. 2016 had 48 OTUs in common altogether (Fig. 4), with the common OTUs comprising 99.96%, 99.45%, 89.57% and 99.95% of the sequences in the October, November, December 2015 and January 2016 communities, respectively (Table 2).
Table 3.
Biodiversity index values of Dendroctonus armandi larvae from October 2015 to January 2016.
| Sampling time | Chao | ACE | Shannon | Simpson |
|---|---|---|---|---|
| Oct. 2015 | 67.11111 | 70.6169 | 0.642307 | 0.225086 |
| Nov. 2015 | 96 | 96 | 2.313493 | 0.569439 |
| Dec. 2015 | 94.5 | 95.27586 | 2.286132 | 0.523645 |
| Jan. 2016 | 83.125 | 80.75568 | 0.135518 | 0.023940 |
Figure 4.
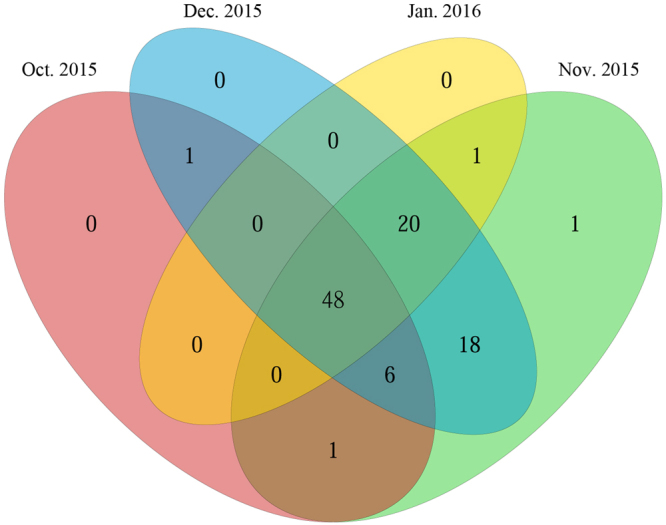
Shared operational taxonomic unit (OTU) analysis of the different communities.
Bacterial community composition and structure succession analysis
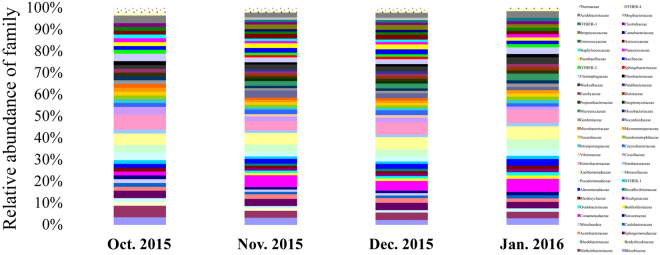
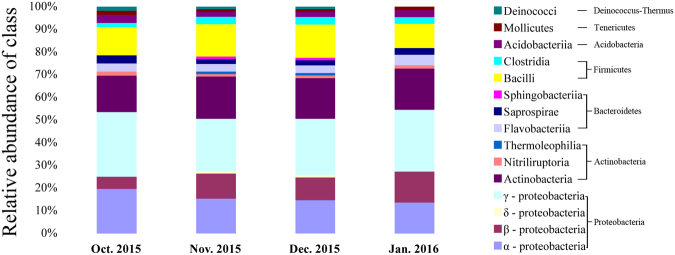
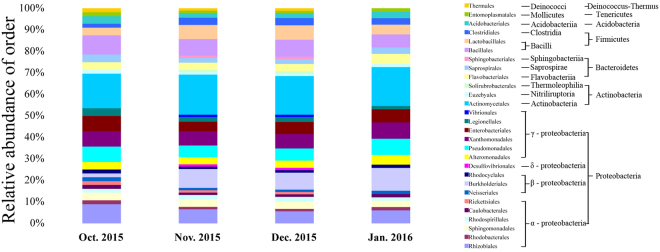
Gradually decreasing temperatures in winter resulted in a complicated metabolic process and also the enhancement of survival rate at low temperature13. To identify gut bacterial community structure succession at low temperature during overwintering stage, the 16 S ribosomal ribonucleic acid (rRNA) sequences were classified at the phylum, the class, the order and the family levels with quantitative polymerase chain reaction (qPCR) amplifcations. There were obvious trends and changes in the relative abundance of the different bacterial taxa in each month from October 2015 to January 2016 (Figs 5–8). During the overwintering stage at low ambient temperature, Proteobacteria was the dominant phylum at 51.99 ± 9.31 (s.d.)% and followed with Actinobacteria and Firmicutes at 19.87 ± 5.60 (s.d.)% and 16.28 ± 4.37 (s.d.)%, respectively (Fig. 5). There was no Deinococcus-Thermus in January 2016. However, Deinococcus-Thermus was contained in October, November and December 2015 (Fig. 5). At the class level, γ-proteobacteria (49.04 ± 8.52 (s.d.)%) was the dominant class compared with α-proteobacteria, β-proteobacteria and δ-proteobacteria (29.94 ± 8.91 (s.d.)%, 19.75 ± 6.15 (s.d.)% and 1.27 ± 0.84 (s.d.)%, respectively) (Fig. 6). Actinobacteria (90.00 ± 7.46 (s.d.)%) was the predominant of the Actinobacteria. Furthermore, Bacilli (81.63 ± 8.13 (s.d.)%) was ascendant of the Firmicutes. Thermoleophilia appeared in November and December 2015, but not for October 2015 and January 2016, nor did δ-proteobacteria (Fig. 6). Gut bacterial community compositions increased in relative abundance in November and December 2015 (Figs 7 and 8). At the class level, Desulfovibrionales, Vibrionales, Solirubrobacterales and Sphingobacteriales were specific in November and December 2015 (Fig. 7).
Figure 5.
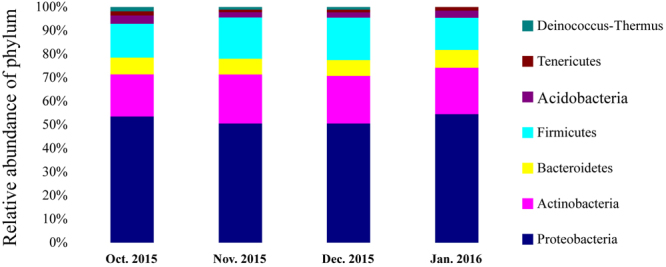
Bacterial community structure variation during overwintering stage at the phylum level of Dendroctonus armandi larvae.
Figure 8.
Bacterial community structure variation during overwintering stage at the family level of Dendroctonus armandi larvae.
Figure 6.
Bacterial community structure variation during overwintering stage at the class level of Dendroctonus armandi larvae.
Figure 7.
Bacterial community structure variation during overwintering stage at the order level of Dendroctonus armandi larvae.
There were obvious differences between bacterial community richness and community diversity. Chao and ACE index values which represented the bacterial community richness increased prior from 67.111 and 70.617 in October 2015 to both 96 in November 2015, slightly declined in December 2015 from 96 to 94.5 and 95.276, respectively, and finally decreased to 83.125 and 80.756. (Table 3). Shannon and Simpson index values which represented the bacterial community diversity had the same trends compared with Chao and ACE index values. The values increased prior from October 2015 to November 2015, slightly declined in December 2015 and finally decreased in January 2016 (Table 3).
Clustering patterns of samples during overwintering stage
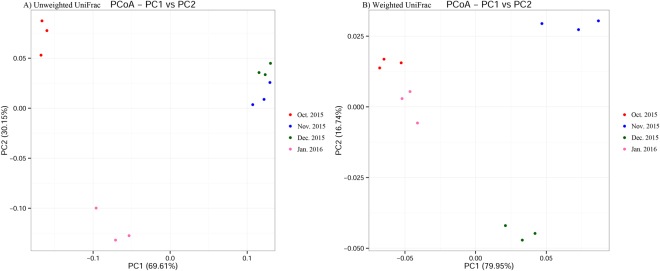
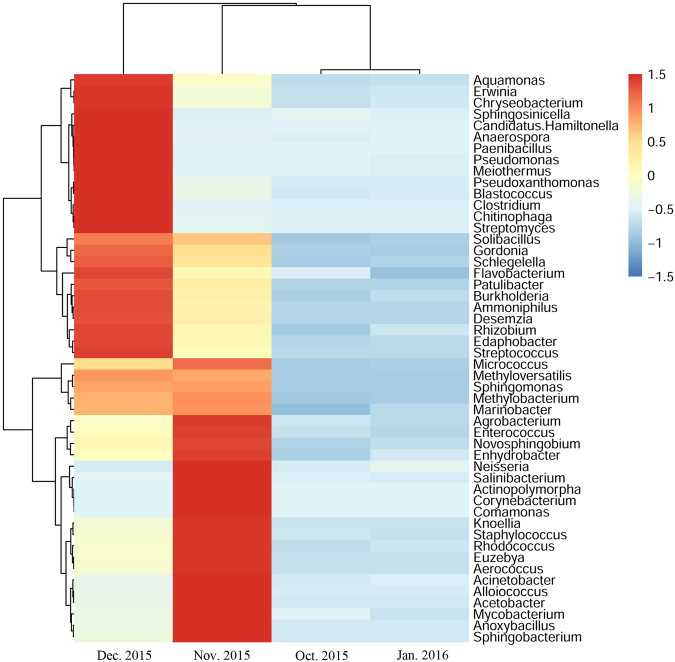
Principal coordinate analysis (PCoA) showed a distinct clustering of gut bacterial communities every month from overwintering larvae at low temperature (Fig. 9) PCoA revealed the overwintering pattern in four months for the unweighted and weighted unifrac distances (Fig. 9). According to the unweighted unifrac PCoA, larvae collected from November and December 2015 formed a unique cluster, separated from the other two months (Fig. 9). According to principal coordinate 1 (PC1) and PC2 analysis (69.61% and 30.15% of variance explained, respectively), the differences of gut bacterial communities at low temperature during overwintering stage were great between November, December 2015 and October 2015, January 2016, while the differences were little in November 2015 compared with December 2015 (Fig. 9). According to weighted unifrac PCoA, the larvae collected in November and December were separated and the gut bacterial communities (collected in October 2015 and January 2016) were clustered based on PC1 and PC2 analysis (79.95% and 16.74% of variance explained, respectively) (Fig. 9). At the genus level, the larvae collected in November and December 2015 generally also had more OTUs than those in October 2015 and January 2016, when the relative abundances of the top 50 OTUs were compared with Z-score method (Fig. 10). This analysis revealed similar results with Fig. 8. The larvae collected in November, December 2015 and: October 2015, January 2016 formed distinct clusters, while the larvae collected in October 2015 and January 2016 were more similar, so were the larvae collected in November and December 2015.
Figure 9.
Two-dimensional principal coordinates analysis (PCoA) plot of unweighted (A) and weighted (B) unifrac distance matrices for Dendroctonus armandi larvae in each month from October 2015 to January 2016.
Figure 10.
Heat maps of Dendroctonus armandi larval gut bacterial family in each month from October 2015 to January 2016.
Differences between samples among four months in the overwintering larvae
Differences in the gut bacterial communities composition among four months were tested using the Tukey’s tests for multiple comparisons (Supplementary Tables S4 and S5). For the overwintering larvae at low temperature, the genera Pseudomonas, Pseudoxanthomonas, Aquamonas, Anaerospora, Sphingosinicella, Brevundimonas and Steroidobacter which belonged to the Proteobacteria were more prevalent in December 2015, and Rhizobium, Burkholderia, Schlegelella, Enhydrobacter, Cellvibrio, Janthinobacterium and Achromobacter (Proteobacteria) were only absent in October 2015. Acetobacter, Sphingomonas, Stenotrophomonas and Photobacterium (Proteobacteria) only appeared in November and December 2015. Furthermore, the genera Corynebacterium, Knoellia, Rhodococcus, Euzebya, Mycobacterium and Propionibacterium which belonged to the Actinobacteria, Alloiococcus and Anoxybacillus which belonged to the Firmicutes were more important in November 2015. The genera Chryseobacterium, Chitinophaga and Flavobacterium belonged to the Bacteroidetes, Edaphobacter from Acidobacteria were enriched in December 2015. The genera Patulibacter, Streptomyces and Pimelobacter belonged to the Actinobacteria, Paenibacillus, Aerococcus, Desemzia, Streptococcus and Bacillus belonged to the Firmicutes, Sphingobacterium from Acidobacteria were absent in Octoer 2015 and January 2016. The genus Meiothermus from Deinococcus-Thermus appeared in October, November and December 2015, and was merely absent in January 2016.
Discussion
This study analyzed the gut bacterial communities structure and relative diversity with low temprature in each month from October 2015 to January 2016 during overwintering stage of D. armandi larvae. Low temprature is a leading factor of winter survival for most insects in frigid and temperate zones13,17,18. Insects survived at low temperature can keep vital bodily functions well and provides tolerance to low temperatures in adverse low ambient environment37. Freezing-tolerant insects can survive after the formation of internal ice, whereas most insect are freeze susceptible (freezing-intolerant) species which cannot tolerate the internal ice formation. These insects improved their supercooling capacity by increasing the contents of polyols or other forms of cryoprotectants8,38. Whether the gut bacterial communities composition and structure is vital for insects during winter is still unknown. In our study, the dominant phyla during overwintering stage were Proteobacteria, Firmicutes and Actinobacteria (Supplementary Tables S1 and S2), and the dominant classes were γ-proteobacteria, Actinobacteria, Bacilli and α-proteobacteria (Supplementary Tables S1, S2 and S3). The changes of gut bacterial relative diversity accorded with the OTU richness estimation on the whole. The special phyla was Deinococcus-Thermus which just existed in October, November and December 2015. Furthermore, the unique families were Desulfovibrionaceae, Vibrionaceae, Streptomycetaceae, Patulibacteraceae, Sphingobacteriaceae, Carnobacteriaceae and Mogibacteriaceae in November and December 2015. We hypothesized these families were associated with the insect overwintering process and resisting to low temperature.
The present results illuminated that gut bacterial communities differed during each month from October 2015 to January 2016. While, there were still some obvious similarities of insect communities as the result of similar environmental variables such as temperature36. So far, few studies analyzed the diversity of gut bacterial species from overwintering insects. Mostly, researchers coped with the gut bacterial communities composition in insects’ development stages33. Even further, there was no complementary researches combining overwintering process of Coleoptera insect and high-throughput sequencing to our knowledge, especially for insect in cold season.
Gut bacterial communities composition and diversity showed differences at low temperatures of Chinese white pine beetle larvae. The phyla of Proteobacteria, Actinobacteria, Bacteroidetes, Firmicutes, Acidobacteria and Tenericutes appeared in each month from October 2015 to January 2016, when the mean monthly ambient temperatures declined from 11.0 °C to 0.5 °C (Table 1). Meanwhile, gut bacterial communities from D. armandi larvae could be monitored immediately, annotating into 7 phyla, 15 classes, 28 orders, 54 families, 64 genera. Their appearances were possibly in correlation with overwintering process and environmental low temperature changes. Among these identified bacteria, γ-proteobacteria from Proteobacteria and Bacilli from Firmicutes exhibited higher presence at low ambient temperature during overwintering period.
The Proteobacteria was the most dominant, accounting for 67.84%, which was similar to the dominant bacteria for some insects such as Bactrocera minax (Diptera: Tephritidae)39, Ceratitis capitata (Diptera: Tephritidae)40, Lutzomyia longipalpis (Diptera: Psychodidae)41, Schistocerca gregaria (Orthoptera: Acrididae)42, Acyrthosiphon pisum (Hemiptera: Aphididae)43, Anoplophora glabripennis (Coleoptera: Cerambycidae)44, Riptortus clavatus (Hemiptera: Alydidae)45 and Saperda vestita (Coleoptera: Cerambycidae)44. However, the results were different with some other insects about dominant bacterium. The predominant bacteria of Drosophila species46, Lymantria dispar (Lepidoptera: Lymantriidae)35, Helicoverpa armigera (Lepidoptera: Noctuidae)47, Bombyx mori (Lepidoptera: Bombycidae)48 and Melolontha melolontha (Coleoptera: Scarabaeidae)49 was Firmicutes. Furthermore, Firmicutes and Bacteroidetes were the predominant bacterium of Musca domestica (Diptera: Muscidae)50, Firmicutes, Bacteroidetes and Spirochaetae were the predominant bacterium of Coptotermes formosanus (Isoptera: Rhinotermitidae)51,52, Proteobacteria and Actinobacteria were the predominant bacterium of Holotrichia parallela (Coleoptera: Scarabaeidae)53, Proteobacteria, Firmicutes, Actinobacteria and Bacteroidetes were the predominant bacterium of Anoplophora glabripennis (Coleoptera: Cerambycidae)44.
Environment changes including altitude, latitude, and ambient temperature influences insects’ survival rate in frigid and temperature zones because they are poikilothermic animals54,55. According to Bryant et al.56 and Singh et al.57, bacterial diversity was significantly correlated with elevation. This was not surprising that the larvae overwintering process was a temperature dependent biochemical process. This result supported our previous hypothesis that low temperature had an effect on larvae gut bacterial communities diversity on the Qinling Mountains due to the high altitude. Lastly, we attempted to identify the environmental variables which controlled larvae gut bacterial communities in order to understand their survival rates in winter. Low ambient temperature was previously shown to be the first priority predictor of variation in bacterial diversity. Therefore, studying the relationship between low ambient temperature and bacterial diversity during overwintering stage of Chinese white pine beetle larvae was the next purpose.
Materials and Method
Study sites
Overwintering D. armandi larvae were collected in the Huoditang Experimental Forest Station which located on the southern slope of the middle Qinling Mountains (33°17′–33°27′ N, 108°22′–108°40′ E) of Northwest Agricultural and Forestry University, Shaanxi, China.
Insect collection and dissection
Chinese white pine beetle (D. armandi) larvae were collected from host trees Chinese white pines (P. armandi) in each month from October 2015 to January 2016. The overwintering larvae were collected from three sample plots, 20 m × 20 m in each one, from the above site in each month. Five trees were selected by five-point sampling method in each sampling plot. The phloem, 20 cm × 20 cm, was peeled off from four directions. All overwintering D. armandi larvae were gathered into glass culture dishes with sterile moist paper using fine forceps and directly transported to the laboratory33. 150 larvae samples in each month were gathered for high-throughput sequencing analysis from attacked Chinese white pine (P. armandi).
The overwintering larvae were treated as following:(1)
rinsed with sterile water once; (2) surface sterilized for 3 min with 70% ethanol; (3) rinsed with sterile water twice; (4) dissected under a stereomicroscope using insect pins; (5) gathered the larval gut into 10 mM sterilized phosphate-buffered saline (Sangon Company, Shanghai, pH 7.4).
150 larvae guts in a month were transferred into three 1.5-mL microcentrifuge tubes (fifty larval guts in each tubes). These three 1.5-mL microcentrifuge tubes were homogenized several times before grinding in liquid nitrogen, and then vortexed at the speed of 2500 r/min for 3 min with 500 mL Tris-EDTA (Sangon Company, Shanghai, pH 8.0). The microbial cells were separated from gut wall tissues after centrifuging at the speed of 4000 r/min for 15 s. The supernatants contained gut bacteria and fungi were totally transferred into three new 1.5-mL microcentrifuge tubes for gut bacterial DNA extraction. All of the steps above were accomplished in a sterile environment with biological air clean bench (Suzhou Antai Airtech, Jiangsu, China).
Bacterial DNA extraction
The E.Z.N.A. Bacterial DNA Kit (Omega Biotech, USA) was used to extract overwintering D. armandi larval gut bacterial deoxyribonucleic acid (DNA) following the instruction booklet. The gut bacterial DNA was stored at −20 °C before using. DNA samples were mixed in equal concentrations, and the mixed DNA specimens were sent to JBYH Biotechnology Co.,Ltd (Wuhan, China) for analysis by MiSeq sequencing.
Bioinformatics and statistical analysis
Paired-end reads were truncated by cutting off the barcode and primer sequence based on their unique barcodes. Then, the single, longer sequences were merged by these paired-end reads using FLASH (Version 1.2.7)58. High-quality clean tags performed by quality filtering on the raw tags under specific filtering conditions by QIIME (Version 1.7.0) quality controlled process59,60. Chimeric sequences were detected and removed using the UCHIME algorithm61.
Clustering was performed using the UPARSE pipeline (version 7.0.1001)62, and similar sequences were assigned to OTUs using the threshold of 97% identity. A typical sequence was picked by selecting the longest sequence that had the largest number of hits to other sequences in the OTU. The RDP classifier (version 2.2)63 was used to annotate taxonomic information for each representative sequence. The typical sequences were aligned using the Greengenes database64, with a minimum identity of 80%. The differences in the dominant species were conducted using MUSCLE (Version 3.8.31) in order to study the phylogenetic relationships of different OTUs of different samples, multiple sequence alignments65.
The alpha diversity analysis included observed species, Ace and Chao estimators, Simpson and Shannon diversity indices estimate of coverage. Rarefaction curves were generated based on observed species. The beta diversity among overwintering D. armandi larval gut bacterial communities was evaluated using both weighted and unweighted unifrac distances66. UPGMA was used to accomplish the hierarchical clustering of samples. The Z-score method was used for heat maps. PCoA was performed to make the differences in larval gut bacterial community composition and structure concrete on the unifrac distances of the unweighted and weighted distance matrices, respectively. Statistical analyses of numbers of OTUs (expressed as the mean ± SE) in each month from October 2015 to January 2016 in D. armandi larval gut bacteria were performed using ANOVA followed by Tukey’s tests for multiple comparisons to detect significant differences performed with SPSS 18.0 (IBM SPSS Statistics, Chicago, IL, USA) and Sigma Plot 12.5 sofware (Systat Sofware Inc., San Jose, CA, USA).
Ethics approval and consent to participate
Our manuscript report data collected from insect named Chinese white pine beetle. The larvae Chinese white pine beetles were collected in the Huoditang Experimental Forest Station of Northwest A&F University. Huoditang Experimental Forest Station agreed us to collect insects for experiments, in order to find a way of controlling the damage.
Availability of data and materials
The datasets supporting the conclusions of this article included within the article (and its additional files) are available in the repository.
Electronic supplementary material
Acknowledgements
We acknowledge the financial support of the National Natural Science Foundation of China (31670658), The National Key Research and Development Program of China (2017YFD0600104) and The Natural Science Basic Research Plan in Shaanxi Province of China (2017ZDJC-03). We acknowledge the meteorological data support by Huoditang Experimental Forest Station, Northwest Agricultural and Forestry University, Shaanxi, China.
Author Contributions
J. Wang, M. Tang and H. Chen conceived the idea, designed the experiments. J. Wang performed the experiments, analyzed the data, and wrote the manuscript.
Competing Interests
The authors declare that they have no competing interests.
Footnotes
Electronic supplementary material
Supplementary information accompanies this paper at 10.1038/s41598-017-14724-y.
Publisher's note: Springer Nature remains neutral with regard to jurisdictional claims in published maps and institutional affiliations.
References
- 1.Haack, R. A. Nutritional ecology of wood-feeding Coleoptera, Lepidoptera, and Hymenoptera. Nutritional Ecology of Insects Mites Spiders & Related Invertebrates 449–486 (1987).
- 2.Rudinsky JA. Ecology of Scolytidae. Annu. Rev. Entomol. 2003;7:327–348. doi: 10.1146/annurev.en.07.010162.001551. [DOI] [Google Scholar]
- 3.Mitton, J. B. & Sturgeon, K. B. Bark beetles in north American conifers. A system for the study of evolutionary biology 315–349 (1982).
- 4.Cruden DL, Markovetz AJ. Microbial ecology of the cockroach gut. Annu. Rev. Microbiol. 1987;41:617–643. doi: 10.1146/annurev.mi.41.100187.003153. [DOI] [PubMed] [Google Scholar]
- 5.Dillon RJ, Vennard CT, Charnley AK. Pheromones: Exploitation of gut bacteria in the locust. Nature. 2000;403:851. doi: 10.1038/35002669. [DOI] [PubMed] [Google Scholar]
- 6.Moran NA, Tran P, Gerardo NM. Symbiosis and insect diversification: An ancient symbiont of sap-feeding insects from the bacterial phylum Bacteroidetes. Appl. Environ. Microbiol. 2005;71:8802–8810. doi: 10.1128/AEM.71.12.8802-8810.2005. [DOI] [PMC free article] [PubMed] [Google Scholar]
- 7.Chen H, Tang M, Liu L, Wang HZ, Li ZB. Cytochemical localization of acid phosphatase activity in tissues of Pinus armandi infested by Leptographium qinlingensis. Symbiosis. 2007;43:65–70. [Google Scholar]
- 8.Wang J, Gao GQ, Zhang RR, Dai LL, Chen H. Metabolism and cold tolerance of Chinese white pine beetle Dendroctonus armandi (Coleoptera: Curculionidae: Scolytinae) during the overwintering period. Agr. Forest Entomol. 2016;19:11–20. [Google Scholar]
- 9.Chen H, Tang M. Spatial and temporal dynamics of bark beetles in Chinese white pine in Qinling Mountains of Shaanxi Province, China. Environ. Entomol. 2007;36:1124–1130. doi: 10.1093/ee/36.5.1124. [DOI] [PubMed] [Google Scholar]
- 10.Yin HF, Li ZL. Economic insect fauna of China. Coleopt. Scolyt. 1984;29:26–35. [Google Scholar]
- 11.Tang M, Chen H. Effect of symbiotic fungi of Dendroctonus armandi on host trees. Sci. Silvae. Sin. 1999;35:63–66. [Google Scholar]
- 12.Lee RE, Richard E. Insect cold-hardiness: to freeze or not to freeze. BioScience. 1989;39:308–313. doi: 10.2307/1311113. [DOI] [Google Scholar]
- 13.Khani A, Moharramipour S, Barzegar M. Cold tolerance and trehalose accumulation in overwintering larvae of the codling moth, Cydia pomonella (Lepidoptera: Tortricidae) Eur. J. Entomol. 2007;104:385–392. doi: 10.14411/eje.2007.057. [DOI] [Google Scholar]
- 14.Campbell EM, Alfaro RI, Hawkes B. Spatial distribution of mountain pine beetle outbreaks in relation to climate and stand characteristics: a dendroecological analysis. J. Integr. Plant Biol. 2007;49:168–178. doi: 10.1111/j.1744-7909.2007.00423.x. [DOI] [Google Scholar]
- 15.Logan JA, Powell JA. Ghost forests, global warming, and the mountain pine beetle (Coleoptera: Scolytidae) Am Entomol. 2001;47:160–173. doi: 10.1093/ae/47.3.160. [DOI] [Google Scholar]
- 16.Aukema BH, et al. Movement of outbreak populations of mountain pine beetle: influences of spatiotemporal patterns and climate. Ecography. 2008;31:348–358. doi: 10.1111/j.0906-7590.2007.05453.x. [DOI] [Google Scholar]
- 17.Koštál V, et al. Physiological and biochemical analysis of overwintering and cold tolerance in two Central European populations of the spruce bark beetle. Ips typographus. J. Insect Physiol. 2011;57:1136–1146. doi: 10.1016/j.jinsphys.2011.03.011. [DOI] [PubMed] [Google Scholar]
- 18.Ma RY, Hao SG, Kong WN, Sun JH, Kang L. Cold hardiness as a factor for assessing the potential distribution of the Japanese pine sawyer Monochamus alternatus (Coleoptera: Cerambycidae) in China. Ann. Forest Sci. 2006;63:449–456. doi: 10.1051/forest:2006025. [DOI] [Google Scholar]
- 19.Douglas AE. The microbial dimension in insect nutritional ecology. Funct. Ecol. 2009;23:38–47. doi: 10.1111/j.1365-2435.2008.01442.x. [DOI] [Google Scholar]
- 20.Rossmassler K, et al. Metagenomic analysis of the microbiota in the highly compartmented hindguts of six wood- or soil-feeding higher termites. Microbiome. 2014;3:1–6. doi: 10.1186/s40168-015-0118-1. [DOI] [PMC free article] [PubMed] [Google Scholar]
- 21.Rahman NA, et al. A molecular survey of australian and north american termite genera indicates that vertical inheritance is the primary force shaping termite gut microbiomes. Microbiome. 2015;3:1–16. doi: 10.1186/s40168-014-0066-1. [DOI] [PMC free article] [PubMed] [Google Scholar]
- 22.Adams AS, Adams SM, Currie CR, Gillette NE, Raffa KF. Geographic variation in bacterial communities associated with the Red Turpentine Beetle (Coleoptera: Curculionidae) Environ. Entomol. 2010;39:406–414. doi: 10.1603/EN09221. [DOI] [PubMed] [Google Scholar]
- 23.Nogge G. Significance of symbionts for the maintenance of an optimal nutritional state for successful reproduction in hematophagous arthropods. Parasitology. 1981;82:101–104. [Google Scholar]
- 24.Douglas AE. Nutritional interactions in insect-microbial symbioses: Aphids and their symbiotic bacteria Buchnera. Annu. Rev. Entomol. 1998;43:17–37. doi: 10.1146/annurev.ento.43.1.17. [DOI] [PubMed] [Google Scholar]
- 25.Benemann JR. Nitrogen fixation in termites. Science. 1973;181:164–165. doi: 10.1126/science.181.4095.164. [DOI] [PubMed] [Google Scholar]
- 26.Dillon RJ, Dillon VM. The gut bacteria of insects: Nonpathogenic interactions. Annu. Rev. Entomol. 2004;49:71–92. doi: 10.1146/annurev.ento.49.061802.123416. [DOI] [PubMed] [Google Scholar]
- 27.Cardoza YJ, Klepzig KD, Raffa KF. Bacteria in oral secretions of an endophytic insect inhibit antagonistic fungi. Ecol. Entomol. 2006;31:636–645. doi: 10.1111/j.1365-2311.2006.00829.x. [DOI] [Google Scholar]
- 28.Geib SM, et al. Lignin degradation in wood-feeding insects. Proc. Natl Acad. Sci. USA. 2008;105:12932–12937. doi: 10.1073/pnas.0805257105. [DOI] [PMC free article] [PubMed] [Google Scholar]
- 29.Morales-Jiménez J, Zúñiga G, Villa-Tanaca L, Hernández-Rodríguez C. Bacterial community and nitrogen fixation in the red turpentine beetle, Dendroctonus valens LeConte (Coleoptera: Curculionidae: Scolytinae) Microb. Ecol. 2009;58:879–891. doi: 10.1007/s00248-009-9548-2. [DOI] [PubMed] [Google Scholar]
- 30.Fukatsu T, Hosokawa T. Capsule-transmitted gut symbiotic bacterium of the Japanese common plataspid stinkbug. Megacopta punctatissima. Appl. Environ. Microbiol. 2002;68:389–396. doi: 10.1128/AEM.68.1.389-396.2002. [DOI] [PMC free article] [PubMed] [Google Scholar]
- 31.Funk DJ, Bernays EA. Geographic variation in host specificity reveals host range evolution in Uroleucon ambrosiae aphids. Ecology. 2001;82:726–739. doi: 10.1890/0012-9658(2001)082[0726:GVIHSR]2.0.CO;2. [DOI] [Google Scholar]
- 32.Tsuchida T, Koga R, Shibao H, Matsumoto T, Fukatsu T. Diversity and geographic distribution of secondary endosymbiotic bacteria in natural populations of the pea aphid, Acyrthosiphon pisum. Mol. Ecol. 2002;11:2123–2135. doi: 10.1046/j.1365-294X.2002.01606.x. [DOI] [PubMed] [Google Scholar]
- 33.Hu X, Wang CY, Chen H, Ma JN. Differences in the structure of the gut bacteria communities in development stages of the Chinese white pine beetle (Dendroctonus armandi) Int. J. Mol. Sci. 2013;14:21006–21020. doi: 10.3390/ijms141021006. [DOI] [PMC free article] [PubMed] [Google Scholar]
- 34.Hosokawa T, Kikuch Y, Meng XY, Fukatsu T. The making of symbiont capsule in the plataspid stinkbug Megacopta punctatissima. FEMS Microbiol. Ecol. 2005;54:471–477. doi: 10.1016/j.femsec.2005.06.002. [DOI] [PubMed] [Google Scholar]
- 35.Broderick NA, Raffa KF, Goodman RM, Handelsman J. Census of the bacterial community of the gypsy moth larval midgut by using culturing and culture-independent method. Appl. Environ. Microbiol. 2004;70:293–300. doi: 10.1128/AEM.70.1.293-300.2004. [DOI] [PMC free article] [PubMed] [Google Scholar]
- 36.Lavinia I, David OC, Emily NJ, Cristina P. Using bacterial and necrophagous insect dynamics for post-mortem interval estimation during cold season: Novel case study in Romania. Forensic Sci. Int-Gen. 2015;254:106–117. doi: 10.1016/j.forsciint.2015.07.024. [DOI] [PubMed] [Google Scholar]
- 37.Park Y, Kim Y. RNA interference of glycerol biosynthesis suppresses rapid cold hardening of the beet armyworm, Spodoptera exigua. J. Exp. Biol. 2013;216:4196–4203. doi: 10.1242/jeb.092031. [DOI] [PubMed] [Google Scholar]
- 38.Storey KB, Storey JM. Insect cold hardiness: metabolic, gene, and protein adaptation. Can. J. Zool. 2012;90:456–475. doi: 10.1139/z2012-011. [DOI] [Google Scholar]
- 39.Wang AL, Yao ZC, Zheng WW, Zhang HY. Bacterial communities in the gut and reproductive organs of Bactrocera minax (Diptera: Tephritidae) based on 454 pyrosequencing. PLoS ONE. 2014;9:e106988. doi: 10.1371/journal.pone.0106988. [DOI] [PMC free article] [PubMed] [Google Scholar]
- 40.Behar A, Yuval B, Jurkevitch E. Gut bacterial communities in the Mediterranean fruit fly (Ceratitis capitata) and their impact on host longevity. J. Insect Physiol. 2008;54:1377–1383. doi: 10.1016/j.jinsphys.2008.07.011. [DOI] [PubMed] [Google Scholar]
- 41.Sant’Anna MRV, et al. Investigation of the bacterial communities associated with females of Lutzomyia sand fly species from South America. PLoS ONE. 2012;7:e42531. doi: 10.1371/journal.pone.0042531. [DOI] [PMC free article] [PubMed] [Google Scholar]
- 42.Dillon R, Charnley K. Mutualism between the desert locust Schistocerca gregaria and its gut microbiota. Microbiol. Res. 2002;153:503–509. doi: 10.1016/S0923-2508(02)01361-X. [DOI] [PubMed] [Google Scholar]
- 43.Haynes S, et al. Diversity of bacteria associated with natural aphid populations. Appl. Environ. Microbiol. 2003;69:7216–7223. doi: 10.1128/AEM.69.12.7216-7223.2003. [DOI] [PMC free article] [PubMed] [Google Scholar]
- 44.Schloss PD, I. D, Jr., Handelsman J, Raffa KF. Bacteria associated with the guts of two wood-boring beetles: Anoplophora glabripennis and Saperda vestit (Cerambycidae) Environ. Entomol. 2006;35:625–629. doi: 10.1603/0046-225X-35.3.625. [DOI] [Google Scholar]
- 45.Kikuchi Y, Hosokawa T, Fukatsu T. Insect-microbe mutualism without vertical transmission: a stinkbug acquires a beneficial gut symbiont from the environment every generation. Appl. Environ. Microbiol. 2007;73:4308–4316. doi: 10.1128/AEM.00067-07. [DOI] [PMC free article] [PubMed] [Google Scholar]
- 46.Wong ACN, Chaston JM, Douglas AE. The inconstant gut microbiota of Drosophila species revealed by 16S rRNA gene analysis. ISME J. 2013;7:1922–1932. doi: 10.1038/ismej.2013.86. [DOI] [PMC free article] [PubMed] [Google Scholar]
- 47.Xiang H, et al. Microbial communities in the larval midgut of laboratory and field populations of cotton bollworm (Helicoverpa armigera) Can. J. Microbiol. 2006;52:1085–1092. doi: 10.1139/w06-064. [DOI] [PubMed] [Google Scholar]
- 48.Xiang H, et al. Bacterial community in midguts of the silkworm larvae estimated by PCR /DGGE and 16S rDNA gene library analysis. Acta Entomologica Sinica. 2007;50:222–233. [Google Scholar]
- 49.Egert M, et al. Structure and topology of microbial communities in the major gut compartments of Melolontha melolontha larvae (Coleoptera: Scarabaeidae) Appl. Environ. Microbiol. 2005;71:4556–4566. doi: 10.1128/AEM.71.8.4556-4566.2005. [DOI] [PMC free article] [PubMed] [Google Scholar]
- 50.Gupta AK, et al. Phylogenetic characterization of bacteria in the gut of house flies (Musca domestica L.) FEMS Microbiol. Ecol. 2012;79:581–593. doi: 10.1111/j.1574-6941.2011.01248.x. [DOI] [PubMed] [Google Scholar]
- 51.Shinzato N, Muramatsu M, Matsui T, Watanabe Y. Molecular phylogenetic diversity of the bacterial community in the gut of the termite Coptotermes formosanus. Biosci. Biotechnol. Biochem. 2005;69:1145–1155. doi: 10.1271/bbb.69.1145. [DOI] [PubMed] [Google Scholar]
- 52.Shinzato N, Muramatsu M, Matsui T, Watanabe Y. Phylogenetic analysis of the gut bacterial microflora of the fungus-growing termite Odontoterme formosanus. Biosci. Biotechnol. Biochem. 2007;71:906–915. doi: 10.1271/bbb.60540. [DOI] [PubMed] [Google Scholar]
- 53.Huang SW, Sheng P, Zhang HY. Isolation and identification of cellulolytic bacteria from the gut of Holotrichia parallela larvae (Coleoptera: Scarabaeidae) Int. J. Mol. Sci. 2012;13:2563–2577. doi: 10.3390/ijms13032563. [DOI] [PMC free article] [PubMed] [Google Scholar]
- 54.Körner C. The use of “altitude” in ecological research. Trends Ecol. Evol. 2007;22:569–574. doi: 10.1016/j.tree.2007.09.006. [DOI] [PubMed] [Google Scholar]
- 55.Rowe RJ, Lidgard S. Elevational gradients and species richness: do methods change pattern perception? Global Ecol. Biogeogr. 2009;18:163–177. doi: 10.1111/j.1466-8238.2008.00438.x. [DOI] [Google Scholar]
- 56.Bryant JA, et al. Microbes on mountainsides: contrasting elevational patterns of bacterial and plant diversity. Proc. Natl Acad. Sci. USA. 2008;105:11505–11511. doi: 10.1073/pnas.0801920105. [DOI] [PMC free article] [PubMed] [Google Scholar]
- 57.Singh D, Takahashi K, Kim M, Chun J, Adams J. A Hump-backed trend in bacterial diversity with elevation on mount Fuji, Japan. Microb. Ecol. 2012;63:429–437. doi: 10.1007/s00248-011-9900-1. [DOI] [PubMed] [Google Scholar]
- 58.Magoc T, Salzberg SL. FLASH: fast length adjustment of short reads to improve genome assemblies. Bioinformatics. 2011;27:2957–2963. doi: 10.1093/bioinformatics/btr507. [DOI] [PMC free article] [PubMed] [Google Scholar]
- 59.Bokulich NA, et al. Quality-filtering vastly improves diversity estimates from Illumina amplicon sequencing. Nat. Methods. 2013;10:57–59. doi: 10.1038/nmeth.2276. [DOI] [PMC free article] [PubMed] [Google Scholar]
- 60.Caporaso JG, et al. QIIME allows analysis of high-throughput community sequencing data. Nat. Methods. 2010;7:335–336. doi: 10.1038/nmeth.f.303. [DOI] [PMC free article] [PubMed] [Google Scholar]
- 61.Edgar RC, Haas BJ, Clemente JC, Quince C, Knight R. UCHIME improves sensitivity and speed of chimera detection. Bioinformatics. 2011;27:2194–2200. doi: 10.1093/bioinformatics/btr381. [DOI] [PMC free article] [PubMed] [Google Scholar]
- 62.Edgar RC. UPARSE: highly accurate OTU sequences from microbial amplicon reads. Nat. Methods. 2013;10:996–998. doi: 10.1038/nmeth.2604. [DOI] [PubMed] [Google Scholar]
- 63.Wang Q, Garrity GM, Tiedje JM, Cole JR. Naive Bayesian classifier for rapid assignment of rRNA sequences into the new bacterial taxonomy. Appl. Environ. Microbiol. 2007;73:5261–5267. doi: 10.1128/AEM.00062-07. [DOI] [PMC free article] [PubMed] [Google Scholar]
- 64.DeSantis TZ, et al. Greengenes, a chimera-checked 16S rRNA gene database and workbench compatible with ARB. Appl. Environ. Microbiol. 2006;72:5069–5072. doi: 10.1128/AEM.03006-05. [DOI] [PMC free article] [PubMed] [Google Scholar]
- 65.Edgar RC. MUSCLE: multiple sequence alignment with high accuracy and high throughput. Nucleic Acids Res. 2004;32:1792–1797. doi: 10.1093/nar/gkh340. [DOI] [PMC free article] [PubMed] [Google Scholar]
- 66.Lozupone C, Knight R. UniFrac: a new phylogenetic method for comparing microbial communities. Appl. Environ. Microbiol. 2005;71:8228–8235. doi: 10.1128/AEM.71.12.8228-8235.2005. [DOI] [PMC free article] [PubMed] [Google Scholar]
Associated Data
This section collects any data citations, data availability statements, or supplementary materials included in this article.
Supplementary Materials
Data Availability Statement
The datasets supporting the conclusions of this article included within the article (and its additional files) are available in the repository.


