

Abstract
We applied isotopically nonstationary 13C metabolic flux analysis (INST-MFA) to compare the pathway fluxes of wild-type (WT) Synechococcus elongatus PCC 7942 to an engineered strain (SA590) that produces isobutyraldehyde (IBA). The flux maps revealed a potential bottleneck at the pyruvate kinase (PK) reaction step that was associated with diversion of flux into a three-step PK bypass pathway involving the enzymes PEP carboxylase (PEPC), malate dehydrogenase (MDH), and malic enzyme (ME). Overexpression of pk in SA590 led to a significant improvement in IBA specific productivity. Single-gene overexpression of the three enzymes in the proposed PK bypass pathway also led to improvements in IBA production, although to a lesser extent than pk overexpression. Combinatorial overexpression of two of the three genes in the proposed PK bypass pathway (mdh and me) led to improvements in specific productivity that were similar to those achieved by single-gene pk overexpression. Our work demonstrates how 13C flux analysis can be used to identify potential metabolic bottlenecks and novel metabolic routes, and how these findings can guide rational metabolic engineering of cyanobacteria for increased production of desired molecules.
Keywords: Synechococcus elongatus PCC7942, SA590, isobutyraldehyde, photoautotrophic metabolism, nonstationary 13C metabolic flux analysis, 13C INST-MFA, pyruvate kinase
1. Introduction
Recent studies have demonstrated the feasibility of converting energy from sunlight and carbon from CO2 directly into biofuels using photosynthetic microorganisms (Hays and Ducat, 2015; Oliver and Atsumi, 2014). Cyanobacteria have evolved efficient metabolic processes for harvesting light energy to produce organic molecules, and they can be cultivated in locations that do not compete with food production for land resources (Melis, 2009; Zhu et al., 2010). In addition to the growing number of heterologous pathways that have been engineered into cyanobacteria, molecular biology tools for genetic manipulation of cyanobacteria are also becoming increasingly available (Berla et al., 2013; Camsund and Lindblad, 2014; Markley et al., 2015; Nozzi et al., 2013). Despite these advances, the growth rates and productivities achieved by cyanobacterial cultures have not been fully optimized compared to heterotrophic bacteria (e.g., E. coli), and sustainable cyanobacterial bioprocesses have yet to be demonstrated as industrially feasible (Varman et al., 2013; Wang et al., 2013b).
One promising biofuel-producing pathway engineered into the cyanobacterium Synechococcus elongatus PCC 7942 involves the production of isobutyraldehyde (IBA) (Atsumi et al., 2009). In this prior work, the highest IBA-producing strain showed relatively high titer (1100 mg/L) and production rates that rival those of other competing biofuel platforms on a land-area basis (Sheehan, 2009). Additionally, IBA is a direct precursor of isobutanol, which has several properties that make it an attractive fuel substitute (Machado and Atsumi, 2012). While the direct biosynthesis of IBA from CO2 holds great promise from an environmental standpoint, we estimated that the previously engineered strain SA590 (Atsumi et al., 2009) diverts only 10–15% of fixed carbon toward IBA production during exponential growth. This finding suggests that there is potential to achieve significant improvements to specific productivity and titer of SA590 by diverting additional carbon and energy away from central metabolism and into the IBA biosynthetic pathway (Angermayr et al., 2015).
13C metabolic flux analysis (13C MFA) provides a rigorous approach to quantify host metabolic phenotypes by tracing the flow of carbon from labeled substrates into metabolic products. Application of 13C MFA to determine how fluxes change as new biosynthetic pathways are introduced has been an effective strategy to identify potential metabolic bottlenecks that limit strain productivity (Becker and Wittmann, 2012; Koffas and Stephanopoulos, 2005). In cyanobacteria, isotopic steady-state 13C MFA has been previously applied to assess heterotrophic and mixotrophic metabolism of Synechocystis sp. PCC 6803 (Schwarz et al., 2013; Yang et al., 2002a; Yang et al., 2002b; Yang et al., 2002c). In addition, we have previously developed novel experimental approaches (Jazmin et al., 2014) and software packages (Young, 2014) that enable flux estimation in photoautotrophic cyanobacteria cultures using isotopically nonstationary 13C MFA (INST-MFA). We applied these technologies to precisely quantify the rates of Calvin-Benson-Bassham (CBB) cycle and TCA pathway reactions in Synechocystis cultures, and we identified several “wasteful” side reactions that contributed to suboptimal photoautotrophic growth (Young et al., 2011).
Despite rapid advances in 13C flux analysis technologies, few prior studies have examined flux alterations that occur as a consequence of introducing heterologous pathways into cyanobacteria (Xiong et al., 2016; Xiong et al., 2015). We hypothesized that combining 13C MFA with rational metabolic engineering would provide an integrated strategy to identify and remove metabolic bottlenecks in recombinant cyanobacterial hosts. To test this, we applied INST-MFA to compare the metabolic network of wild-type S. elongatus with the IBA-producing strain SA590. Because S. elongatus only grows photoautotrophically (McEwen et al., 2013), transient isotope labeling studies and INST-MFA were required for flux determination. The flux analysis revealed a hidden bottleneck at the pyruvate kinase (PK) reaction, which catalyzes the conversion of phosphoenolpyruvate (PEP) to pyruvate, the major carbon precursor of IBA. Additionally, our results highlighted a natural three-step bypass pathway (PEPC→MDH→ME), which effectively circumvents the PK reaction. Because a specific mdh gene has not been annotated in the Synechococcus PCC 7942 genome, an enzymatic assay was developed to confirm the existence of endogenous MDH activity in SA590. Based on these results, we generated single-, double-, and triple-gene overexpression mutants in SA590 and observed significant improvements in aldehyde specific productivity. This research demonstrates how 13C MFA can be applied to discover new metabolic pathways and identify rational targets for cyanobacterial strain improvement, thus enabling a systematic ‘design-build-test-learn’ metabolic engineering cycle.
2. Materials and methods
2.1. Generation of overexpression constructs and engineered strains
S. elongatus sp. strain PCC 7942 (previously referred to as Anacystis nidulans R2 Pasteur Culture Collection no. 7942) was used as the wild-type (WT) strain (Bustos and Golden, 1991). The parental IBA-producing strain (SA590) was obtained from the Liao lab at UCLA (Atsumi et al., 2009). To overexpress genes of interest in the parental SA590 background, a neutral site III-targeting expression vector with a carbenicillin resistance marker, pNS3OX/Cb, was generated based on the pHN1-LacUV5 plasmid (Niederholtmeyer et al., 2010), in which a lac operon promoter (Plac) was included. The coding regions with or without 3′-flanking sequences for pyruvate kinase (pk gene accession number: SYNPCC7942_0098), phosphoenolpyruvate carboxylase (pepc gene accession number: SYNPCC7942_2252), and malic enzyme (me gene accession number: SYNPCC7942_1297) were amplified from S. elongatus PCC 7942 genomic DNA using PfuUltra High-fidelity DNA polymerase (Agilent Technologies, San Diego, CA) and corresponding primers with appropriate restriction linkers. The coding region with or without 3′-flanking sequences for malate dehydrogenase (mdh gene ID # 952416) was cloned from Synechocystis sp. PCC 6803 genomic DNA, and its codons were optimized to S. elongatus PCC 7942 as described by Xu et al. (2013) (Figure A1). For double or triple overexpression of these genes, the coding fragments of the me, mdh, and/or pepc genes harboring either an IPTG-derepressible heterologous trc promoter (Ptrc) or lac promoter (Plac) were constructed according to the Gibson Assembly Master Mix Protocol (New England Biolabs, Inc., Ipswich, MA). These single, double, or triple recombinant DNA fragments were cloned into pNS3OX/Cb downstream of Plac to produce pPK/OX-NS3, pPEPC/OX-NS3, pMDH/OX-NS3, pME/OX-NS3, pME-MDH/OX-NS3, and pPMM/OX-NS3, respectively. These constructs were then introduced into the neutral site III of SA590 to generate strains SA590-PK, SA590-PEPC, SA590-MDH, SA590-ME, SA590-MDH/ME, and SA590-PEPC/MDH/ME (Table 1). All DNA constructs and SA590 variants were confirmed by DNA sequencing, restriction digestion, and PCR analysis. Complete genome segregation of transgenes was confirmed by isolating single transformed colonies and verifying with PCR analyses (Figure A2).
Table 1.
Strains used in this study.
| Strain | Description | Reference |
|---|---|---|
| WT | Wild-type S. elongatus PCC 7942 | (Bustos and Golden, 1991) |
| SA590 | IBA-producing parental strain. Ptrc::kivd in NSI (SpecR), PLlacO1::alsS-alvC-alvD in NSII (KmR) | (Atsumi et al., 2009) |
| SA590-PK | SA590 Plac::pk in NS III (CbR) | This work |
| SA590-PEPC | SA590 Plac::pepc in NS III (CbR) | This work |
| SA590-MDH | SA590 Plac::mdh in NS III (CbR). The Synechocystis sp. PCC 6803 mdh gene was codon-optimized for expression in S. elongatus. | This work |
| SA590-ME | SA590 Plac::me in NS III (CbR) | This work |
| SA590-MDH/ME | SA590 Ptrc::mdh, Plac::me in NS III (CbR) | This work |
| SA590-PEPC/MDH/ME | SA590 Plac::pepc, Ptrc::mdh, Plac::me in NS III (CbR) | This work |
2.2. Medium and culture conditions
All strains were grown on modified BG-11 agar plates (Bustos and Golden, 1991) (1.5% w/v) with appropriate antibiotics (40 μg/mL spectinomycin, 10 μg/mL kanamycin, and/or 4 μg/mL carbenicillin). For liquid cultures, we used a modified BG-11 medium (pH 7.6) with addition of 50 mM NaHCO3. Liquid cultures were grown under 150 μmol photons m−2 s−1 light, supplied by 8 fluorescent lights (Build My LED, LLC, Austin, TX) at 30°C with rotary shaking at 120 rpm and air bubbling. Liquid pre-cultures were maintained at a lower light intensity of approximately 50 μmol photons m−2 s−1 light prior to experiments. Light was measured using a PAR quantum flux meter (Apogee Instruments, Logan, UT). Cell growth was monitored by measuring OD750 on a μQuant Microplate Spectrophotometer (Bio-Tek Instruments Inc, Winooski, VT). The following linear correlation was developed to calibrate OD750 readings to cell density in units of grams dry weight (gDW) per liter: Cell density (gDW/L) = 0.6836 × OD750.
2.3. Quantification of aldehyde production
Triplicate cultures were inoculated to an initial OD750=0.4 (0.27 gDW/L) in 75 mL modified BG-11 media in 125 mL Erlenmeyer flasks. Each culture flask was wrapped in foil and left to incubate in the dark for 12 hours. After the 12-hour dark period (t=0hr), the foil wraps were removed and the expression of the IBA pathway was induced by the addition of 75 μL of 1.0 M isopropyl-β-D-1-thiogalactoside (IPTG) to achieve a final concentration of 1mM in culture. All cultures were allowed to grow under continuous light with bubbled air for six hours (t=6hr). At t=6hr, 1-mL samples from each culture were harvested. The cultures were then sealed tightly with rubber stoppers and left to incubate under continuous light for 24 hours. After the 24-hour incubation period (t=30hr), all cultures were placed in the -20°C freezer for 10 minutes to condense the aldehydes in the culture headspace. Then, the rubber stoppers were carefully removed and 1-mL samples were collected from each culture. Cell growth was monitored throughout the entire experiment by measuring cell density at t=0hr, t=6hr, and t=30hr.
The 1-mL samples collected at t=6hr and t=30hr were centrifuged for 5 min at 15,000 rpm to pellet the cells. Then, 495 μL of the supernatant was mixed with 5 μL of 100 mM n-butyraldehyde (nBA) as an internal standard. The mixture was vortexed and directly analyzed on a GC-FID (Shimadzu GC-2010 system with flame ionization detector) using a DB-WAX column (30m, 0.20 mm ID, 0.20 μm film thickness) from Agilent Technologies (Santa Clara, CA). The injector and detector temperatures were maintained at 210°C and 250°C, respectively. Helium was used as the carrier gas, and the injection volume was 0.5 μL. The GC oven temperature was initially held at 30°C for 6 min and then raised to 60°C with a temperature ramp of 6°C/min. The GC oven was then maintained at 60°C for 2 min, raised to 220°C with a ramp of 40°C/min, and held at 220°C for 7 minutes before completion of the analysis. Column flow rate was 0.78 mL/min, and the purge flow rate was 0.5 mL/min. IBA and isovaleraldehyde (IVA) peaks were identified and normalized to the internal standard peak. Serial dilutions of IBA and IVA standards with concentrations in the range of 0.01–2 mM were used to construct calibration curves. The amounts of IBA and IVA in each sample were calculated based on the ratios of the integrated IBA/nBA and IVA/nBA peak areas using linear regression from the corresponding calibration curve. To calculate specific aldehyde productivities, cell density and aldehyde concentrations at t=6hr and t=30hr were used as inputs into the publicly available software package ETA (Murphy and Young, 2013).
2.4. 13C labeling experiments
Triplicate cultures of SA590 were inoculated to an initial OD750=0.4 (0.27 gDW/L) in 500mL modified BG-11 media in 1-L Erlenmeyer flasks. Each culture flask was wrapped in foil and left to incubate in the dark for 12 hours. After the 12-hour dark period, the foil wraps were removed and the expression of the IBA pathway was induced by the addition of 500 μL of 1.0 M IPTG (final concentration of 1 mM in culture) and left under continuous light and air bubbling for 30 hours. The labeling experiment was initiated 30 hours after the dark pulse, when cultures reached a cell density of approximately 0.41 gDW/L. A 20-mL sample corresponding to t=0 (unlabeled) was withdrawn from the flask using a syringe and Luer-Lock needle (12 gauge, 12″, Sigma-Aldrich). Airflow was stopped to prevent unlabeled CO2 from entering the system. A 50-mL aliquot of BG11 media with added NaH13CO3 (Cambridge Isotope Laboratories, 97% isotopic purity) was quickly introduced to the culture to achieve a final tracer concentration of 100 mM. Following this pulse, a series of 20-mL samples were withdrawn and rapidly cold-quenched at time points 30, 60, 120, 180, 300, 600, and 900 seconds. Each sample was quenched in a 50-mL centrifuge tube that contained 30 mL of partially-frozen PBS maintained at 0°C on ice. Each quenched sample was centrifuged for 15 min at 5000 rpm and –10°C. The supernatant was discarded and the cell pellet was extracted using a modified Folch extraction method, which utilizes a biphasic chloroform:methanol:water (8:4:3) solvent mixture (Folch et al., 1957). Norvaline was added as an internal standard to a final concentration of 6.67 μM in all extracts at the start of the extraction process. Polar metabolites were recovered in the methanol/water phase and dried down overnight under a steady stream of nitrogen gas at room temperature. Dried extracts were stored at –80°C prior to derivatization.
2.5. Sample preparation and derivatization
To initiate the derivatization process, dried extracts were carefully dissolved in 50 μL of methoxyamine reagent (MOX; Pierce, Rockford, IL) and placed in a room-temperature sonication bath for 30 min. This was followed by a 40°C incubation for 90 min. Subsequently, 70 mL of BSTFA + 10% TMCS (TMS; Pierce) was added, and the sample was left to incubate at 40°C for 30 min on a heating block. The samples were then removed from the heating block and left to incubate at room temperature overnight to ensure complete derivatization. Lastly, the samples were centrifuged at 14,000 rpm to pellet any undissolved residue, and the supernatant was carefully harvested and stored at 4°C. The resulting methoxime-trimethylsilyl (MOX-TMS) derivatives were analyzed by GC-MS.
2.6. GC-MS measurement of metabolite labeling and pool size
The GC-MS method was adapted from Young et al. (2011) and was performed on an Agilent 7890 gas chromatograph equipped with a DB-35ms column (30m × 0.25 mm i.d. × 0.25mm; Agilent J&W Scientific). The injection volume was 1 μL and all samples were run in splitless mode with an inlet temperature of 270°C. Helium flow rate was set to 1 mL/min, and a purge flow of 50 mL/min was set to activate 2 min after injection. The GC oven temperature was held at 80°C for 5 min, ramped at 10°C/min to 320°C, and held at 320°C for an additional 5 min. Mass spectra were obtained in scan mode over the range 100–800 m/z. Raw ion chromatograms were integrated using a custom MATLAB M-file that applies consistent integration bounds and baseline correction to each ion (Antoniewicz et al., 2007).
2.7. Isotopomer network model
An isotopomer model describing central carbon metabolism in S. elongatus PCC 7942 was adapted from a previous Synechocystis reaction network (Young et al., 2011). All isotopic measurements used for flux determination are listed in Table 2, and a list of the reactions included in the biochemical reaction network is provided in the Supplementary Materials. INST-MFA was used to estimate intracellular metabolic fluxes (Jazmin et al., 2014). Least-squares parameter regression and statistical and sensitivity analysis of the optimal solution were performed by using the publicly available software package INCA (Young, 2014), which runs within MATLAB™. Metabolic fluxes and pool sizes were estimated by minimizing the lack-of-fit between experimentally measured and computationally simulated mass isotopomer distributions (MIDs) (Young et al., 2008). Flux evaluation was repeated a minimum of 50 times from random initial values to obtain best-fit parameter estimates. All results were subjected to a chi-square statistical test to assess goodness of fit, and accurate 95% confidence intervals were computed for all estimated parameters by evaluating the sensitivity of the sum-of-squared residuals (SSR) to parameter variations (Antoniewicz et al., 2006).
Table 2.
Isotope labeling measurements used for metabolic flux determination.
| Metabolite | Mass | Carbons | Composition |
|---|---|---|---|
| 3PGA | 459 | 1 2 3 | C14 H36 O7 P Si4 |
| 3PGA | 357 | 2 3 | C11 H30 O5 P Si3 |
| F6P | 357 | 5 6 | C11 H30 O5 P Si3 |
| G6P | 471 | 3 4 5 6 | C16 H40 O6 P Si4 |
| G6P | 357 | 4 5 6 | C11 H30 O5 P Si3 |
| PEP | 369 | 1 2 3 | C11 H26 O6 P Si3 |
| ALA | 116 | 2 3 | C5 H14 N Si |
| 2PG | 357 | 1 2 | C10 H26 O6 P Si3 |
| 2PG | 328 | 2 | C10 H29 O4 P Si3 |
| GLY | 276 | 1 2 | C10 H26 N O2 Si3 |
| GLY | 174 | 2 | C7 H20 N Si2 |
| SER | 306 | 1 2 3 | C11 H28 N O3 Si3 |
| GA | 307 | 1 2 3 | C11 H27 O4 Si3 |
| GA | 292 | 2 3 | C11 H28 O3 Si3 |
| CIT | 465 | 1 2 3 4 5 6 | C17 H37 O7 Si4 |
| CIT | 363 | 1 2 3 4 5 | C14 H31 O5 Si3 |
| AKG | 304 | 1 2 3 4 5 | C11 H22 N O5 Si2 |
| SUC | 247 | 1 2 3 4 | C9 H19 O4 Si2 |
| FUM | 245 | 1 2 3 4 | C9 H17 O4 Si2 |
| MAL | 233 | 2 3 4 | C9 H21 O3 Si2 |
Abbreviations: 2PG, 2-phosphoglycolate; 3PGA, 3-phosphoglycerate; AKG, alpha-ketoglutarate; ALA, Alanine; CIT, citrate; F6P, fructose 6-phospate; FUM, fumarate; G6P, glucose 6-phosphate; GA, glycerate; GLY, glycine; MAL, malate; PEP, phosphoenolpyruvate; SUC, succinate.
The reaction networks for wild-type S. elongatus and SA590 were assumed to include the malate dehydrogenase (MDH) reaction (malate ↔ oxaloacetate). Although a specific MDH isoform has not been annotated in the genome of Synechococcus PCC 7942 (Broddrick et al., 2016), it has been previously assumed that another, unspecific dehydrogenase may be responsible for interconverting malate and oxaloacetate in this species (Schwarz et al., 2011). We were able to detect MDH activity in SA590 cell extracts using the assay described in Section 2.8 (see results in Table 3). Furthermore, when we removed the MDH reaction from our model, the weighted residuals of the TCA cycle intermediates malate, fumarate, citrate, and alpha-ketoglutarate increased to the point where the model fits became statistically unacceptable. Based on these results, we chose to include the MDH reaction to avoid the possibility of overconstraining the model-estimated flux solutions. This approach enabled the isotopomer measurements to determine the level of MDH flux in an unbiased way. However, the model-estimated fluxes should not be interpreted as definitive evidence of in vivo MDH activity in Synechococcus PCC 7942, since our labeling experiments were not specifically designed to distinguish MDH flux from alternative metabolic routes that might functionally substitute for MDH—for example, involving reactions in purine or arginine biosynthesis pathways that produce fumarate from oxaloacetate. Although these reactions have been implicitly included in our lumped growth equation (Table A1), fumarate production through this mechanism is stoichiometrically linked to growth and therefore cannot fully substitute for MDH in our model.
Table 3. In vitro enzyme assays of selected overexpression strains.
Assays were conducted in biological triplicates. Activities for ME are reported with NADP (top) and NAD (bottom) as cofactors. Data ± SD.
| Strain | Enzyme activity (A340 / min / ng crude protein)
|
||
|---|---|---|---|
| PK | MDH | ME | |
| SA590 | 0.096 ± 0.012 | 0.043 ± 0.013 | 0.063 ± 0.007 0.165 ±0.046 |
| SA590-PK | 0.139 ± 0.008 | – | – |
| SA590-MDH/ME | – | 0.759 ± 0.019 | 0.357 ± 0.026 0.144 ± 0.039 |
2.8. Enzymatic assays
Enzymatic assays were modified and adapted from previous studies and scaled down to 200-μL volumes to enable assays to be performed in 96-well plates. Crude protein isolation was adapted from other published work (Cheah et al., 2015; Wang et al., 2013a). Cultures were grown as described in Section 2.2, and 25-mL samples (containing approximately 10 mg of dry cell weight) were harvested 24 hours after IPTG induction. The cultures were centrifuged at 3500 rpm for 5 minutes, and the supernatants were removed by vacuum aspiration. The cell pellets were then re-suspended in 1 mL of the appropriate buffer (see below). Following cell lysis via sonication (4 cycles of 5s-on/5s-off) on ice, the samples were centrifuged at 10,000×g for 5 min at 4°C. Sample supernatants were harvested and kept on ice prior to the experiment.
Pyruvate kinase enzyme assay
The protocol from Angermayr et al. (2014) was followed with minor modifications. For this assay, 1 mL of pH 7.6 buffer containing 50 mM Tris-HCl, 100 mM KCl, and 5 mM MgCl2 was used to re-suspend the cell pellet. The protein concentration of the supernatant was determined with a BCA assay (Pierce). Each 200-μL assay contained 0.5 μg/μL of crude protein, 50 mM Tris-HCl, 100 mM KCl, 5 mM MgCl2, 0.6 mM ADP (Sigma A2754), 0.3 mM NADH (Roche 10107735001), and 12 units/mL rabbit muscle L-lactic acid dehydrogenase (Sigma L2500). The 96-well plate was incubated at 30°C for 5 min in a Cytation 3 Cell Imaging Multi-Mode Reader (Biotek, Winooski, VT). To initiate the reaction, PEP cyclohexylammonium (Sigma P3637) was added (to a final concentration of 5 mM) with a multichannel pipet. The rate of NADH consumption was monitored by measuring the absorbance at 340 nm for 30 min.
Malate dehydrogenase enzyme assay
The protocol from Bergmeyer et al. (1974) was modified and adapted for 96-well plates. For this assay, 1 mL of pH 7.5 buffer containing 100 mM potassium phosphate was used to re-suspend the cell pellet. The protein concentration of the supernatant was determined with a BCA assay (Pierce). Each 200-μL assay contained 0.5 μg/μL of crude protein, 100 mM potassium phosphate, and 0.26 mM NADH (Roche 10107735001). The 96-well plate was incubated at 30°C for 5min in a Cytation 3 Cell Imaging Multi-Mode Reader (Biotek, Winooski, VT). To initiate the reaction, oxaloacetic acid (Sigma O4126) was added (to a final concentration of 5 mM) with a multichannel pipet. The rate of NADH consumption was monitored by measuring the absorbance at 340 nm for 30 min.
Malic enzyme assay
The protocol from Geer et al. (1980) was modified and adapted for 96-well plates. For this assay, 1 mL of pH 7.4 buffer containing 67 mM triethanolamine HCl and 5 mM MnCl2 was used to re-suspend the cell pellet. The protein concentration of the supernatant was determined with a Bradford assay (Bio-Rad Laboratories). Each 200-μL assay contained 0.5 μg/μL of crude protein, 67 mM triethanolamine HCl, 5 mM MnCl2, and either 0.3 mM NADP (Sigma N0505) or 0.3 mM NAD (Sigma N7004). The 96-well plate was incubated at 30°C for 5 min in a Cytation 3 Cell Imaging Multi-Mode Reader (Biotek, Winooski, VT). To initiate the reaction, L-malic acid (Sigma M6413) was added (to a final concentration of 6.6 mM) with a multichannel pipet. The rate of NADPH or NADH formation was monitored by measuring the absorbance at 340 nm for 30 min.
3. Results
3.1. Growth and aldehyde production
Comparison of growth and aldehyde production between WT and SA590 strains was used to assess the metabolic impact of introducing IBA biosynthetic genes into S. elongatus (Figure 1). As expected, the WT strain did not produce IBA. We initially hypothesized that the introduction of new carbon-consuming pathways in the engineered strain would result in decreased growth, with carbon being potentially redirected away from biomass. However, the reduction in growth was not significant, indicating low metabolic burden due to IBA production. We also measured tolerance of WT S. elongatus to IBA in closed flasks and observed no significant effect on growth when exposed to 100 mg/L IBA (Figure A3).
Figure 1. (A) Growth rate and (B) aldehyde specific productivity in WT and SA590 strains.
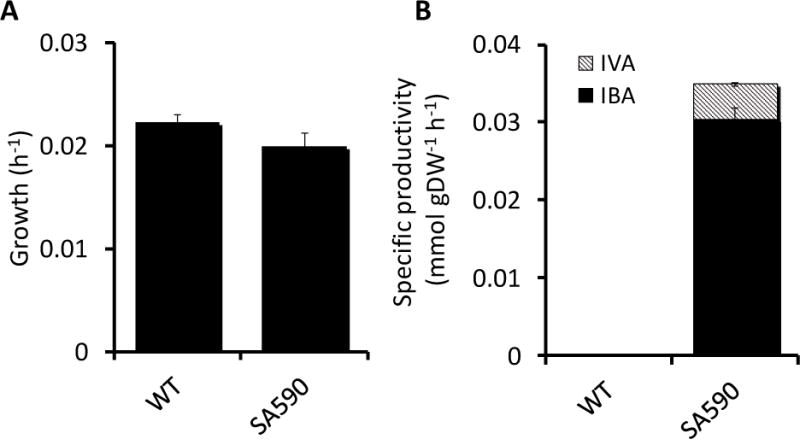
Data ± SE; n=3.
While analyzing samples for IBA production, we detected an additional aldehyde compound produced by SA590 cultures (Figure 1B). This compound was identified as isovaleraldehyde (IVA) through comparison to IVA standards. We hypothesize that the recombinant ketoisovalerate decarboxylase (kivd) enzyme, which converts ketoisovalerate to IBA, also facilitates the conversion of ketoisocaproate to IVA. Ketoisocaproate is a precursor found in the leucine biosynthesis pathway, which branches off from the valine biosynthesis pathway downstream of ketoisovalerate. The relative abundance of IVA was approximately 13% of the total aldehydes (IBA + IVA) produced by SA590.
3.2. Isotopically nonstationary metabolic flux analysis
INST-MFA was applied to characterize and compare the metabolic phenotypes of WT and SA590 strains. The measured MIDs, growth, and aldehyde production rates were used to construct comprehensive flux maps of photoautotrophic metabolism using a modified version of the reaction network developed by Young et al. (2011) for wild-type Synechocystis. The best-fit SA590 flux map is shown in Figure 2. The major carbon fluxes occurred in the CBB cycle, where carbon fixation takes place. We also observed little to no flux through the photorespiratory pathway, which is in agreement with previous studies (Kaplan and Reinhold, 1999). Additionally, there was minimal flux through the oxidative arm of the TCA cycle (citrate to α-ketoglutarate), which is consistent with previous flux analysis studies performed in cyanobacteria (You et al., 2014; Young et al., 2011). The fits were statistically acceptable based on a chi-square test of the SSR, which was assessed at the 95% confidence level with 358 and 345 degrees of freedom (DOF) for the WT and SA590 flux maps, respectively. The best-fit solutions resulted in SSR=411.1 for the WT flux map, falling within the expected range of [307.5, 412.3] and SSR=396.3 for the SA590 flux map, which was also within its expected range of [295.4, 398.4]. The full list of optimal parameter estimates including net fluxes, exchange fluxes, and pool sizes for both WT and SA590 can be found in the Supplementary Materials.
Figure 2. Flux map of SA590 strain determined under photoautotrophic conditions.
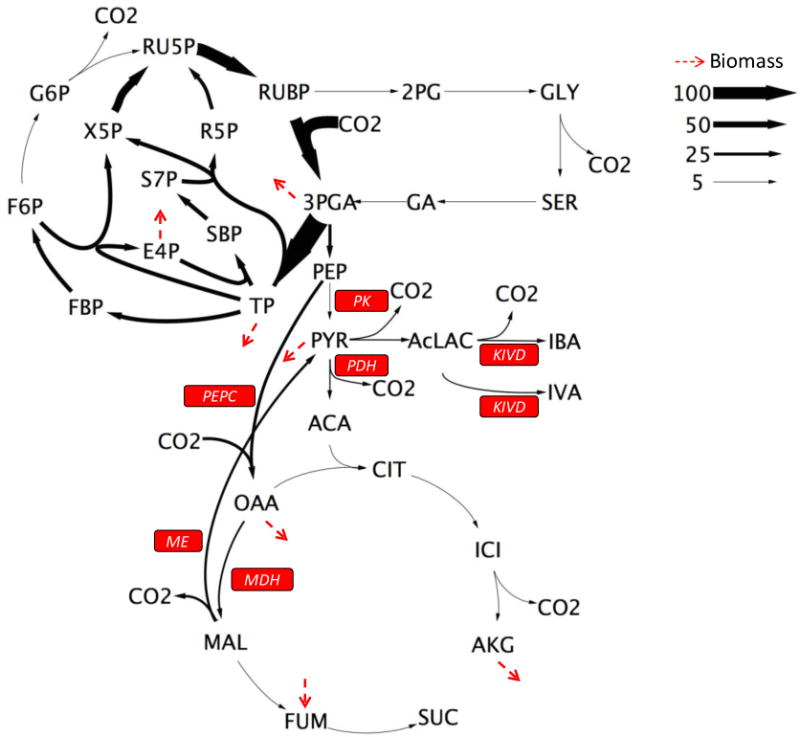
Fluxes are shown normalized to a net CO2 uptake rate of 100. Arrow thickness is scaled proportional to net flux. Dotted arrows indicate fluxes to biomass formation.
The flux analysis highlighted a natural metabolic route within cyanobacterial central carbon metabolism to bypass PK in both WT and SA590 strains. PK catalyzes the glycolytic conversion of PEP to pyruvate. High levels of ATP, produced in abundance during photosynthesis, have been found to inhibit PK activity (Knowles et al., 2001). The proposed PK bypass involves the routing of carbon through the PEPC, MDH, and ME reaction steps in series (Figure 2). The flux analyses of both the WT and SA590 strains indicate that the majority of PEP flux was directed through PEPC rather than PK (Figure 3). Comparison of the two strains revealed that significant increases in MDH and ME flux were necessary to supply pyruvate for IBA production in SA590. This finding reveals a major alternative route for pyruvate formation and suggests that flux to pyruvate through PK is inhibited during photoautotrophic growth of Synechococcus, as has been previously suggested for Synechocystis (Young et al., 2011).
Figure 3. Comparison of fluxes contributing to pyruvate availability in WT vs SA590.
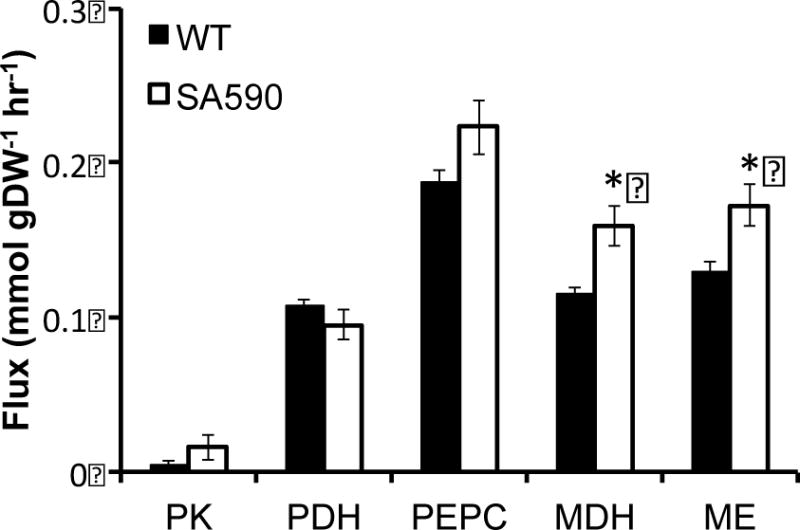
A comparison of INST-MFA determined fluxes through pyruvate kinase (PK), pyruvate dehydrogenase (PDH), PEP carboxylase (PEPC), malate dehydrogenase (MDH), and malic enzyme (ME) in WT vs SA590. Values are represented as Data ± SE, where SE represent standard error of the best-fit flux estimate. *p<0.05.
3.3. Single-gene overexpression strains
Because pyruvate supplies carbon for IBA production in SA590, we hypothesized that overexpressing pk or enzymes involved in the PK bypass pathway would relieve this metabolic bottleneck and increase flux towards IBA. Therefore, we generated the following single-gene overexpression strains in attempts to increase pyruvate availability in the SA590 parent: SA590-PK, SA590-PEPC, SA590-MDH, and SA590-ME (Table 1). The SA590-PEPC and SA590-ME strains exhibited significantly slower growth in comparison to the parental strain (Figure 4). While there were no significant differences in aldehyde production between the single-gene overexpressing strains, all showed significant increases in specific productivity compared to their SA590 parent (Figure 5). Interestingly, the SA590-PK strain showed the largest increase in aldehyde production relative to SA590. IVA productivity remained at approximately 10–13% of total aldehyde productivity in all strains examined.
Figure 4. Effect of enzyme overexpression on growth.
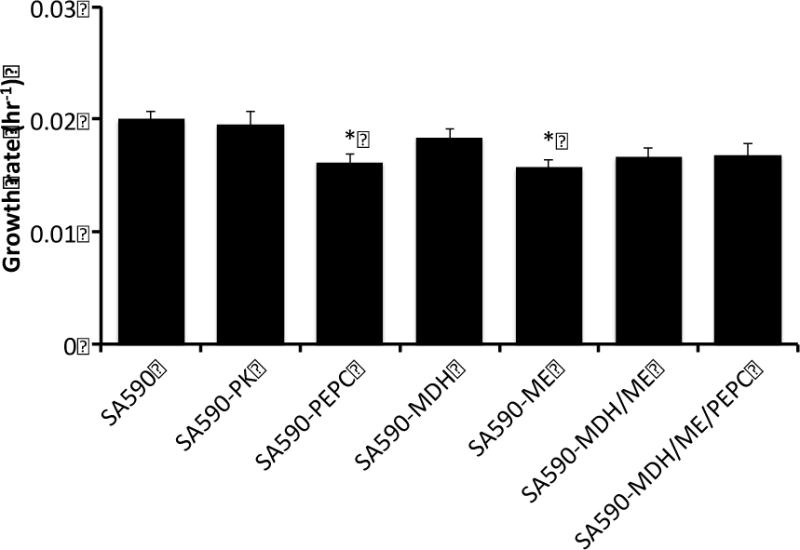
Growth was calculated by measuring optical density at the start (t=6hr) and end (t=30hr) of the capped flask aldehyde collection experiments. The parental SA590 strain served as control. Dunnett’s test was used to calculate significant differences. Data ± SE, n=3. *p<0.05.
Figure 5. Effect of enzyme overexpression on aldehyde production.
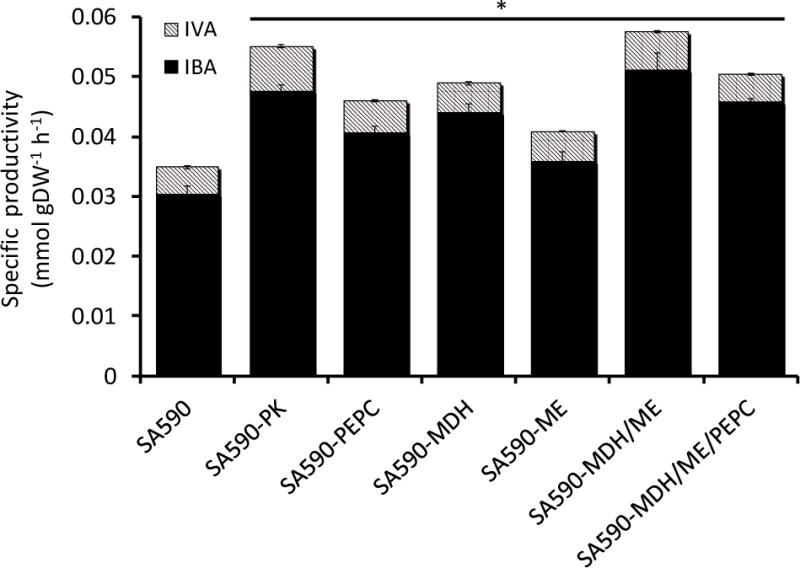
Aldehyde specific productivity was calculated by measuring aldehyde concentration and cell density at the start (t=6hr) and end (t=30hr) of capped flask collection experiments. These values were regressed using the ETA software package to determine specific rates (Murphy and Young, 2013). The parental SA590 strain served as control. Dunnett’s test was used to calculate significant differences. Data ± SE, n=3. *p<0.05.
3.4. Double and triple gene overexpression strains
Given the increased productivities observed in the single-gene overexpression strains, we hypothesized that the creation of double- or triple-gene overexpression strains could potentially push more flux towards aldehyde production by further increasing flux through the PK bypass pathway. We chose to overexpress mdh in combination with me (SA590-MDH/ME) because intermediate pool size measurements suggested flux imbalances at the malate node in both the mdh and me single-gene overexpression strains (Figure 6). In particular, mdh overexpression led to malate accumulation while me overexpression resulted in malate depletion. Therefore, we hypothesized that overexpressing both mdh and me simultaneously would balance flux through the PK bypass and restore malate to homeostatic levels. A triple overexpression strain (SA590-PEPC/MDH/ME) was also generated and tested in parallel to determine whether overexpressing all three PK bypass genes together would result in even further increases in aldehyde specific productivity.
Figure 6. Intracellular pool sizes of engineered strains relative to SA590.
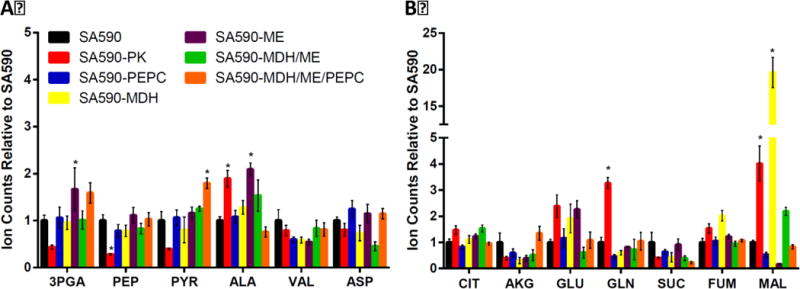
(A) Comparison of glycolytic intermediates and (B) TCA cycle intermediates. Metabolites were extracted and derivatized by MOX/TMS. Ion counts were normalized to an internal standard (norvaline) peak and to optical density (OD750) at time of sample measurement (t=30). Values are shown relative to SA590 (=1). Dunnett’s test was used to calculate significant differences. Data ± SE, n=3. *p<0.05. Abbreviations: 3PGA, 3-phosphoglycerate; AKG, alpha-ketoglutarate; ALA, Alanine; ASP, Aspartate; CIT, citrate; FUM, fumarate; GLN, glutamine; GLU, glutamate; MAL, malate; PEP, phosphoenolpyruvate; PYR, pyruvate; SUC, succinate; VAL, valine.
Both SA590-MDH/ME and SA590-PEPC/MDH/ME had similar growth rates and trended towards slower growth in comparison to the parental SA590 strain (Figure 4). The aldehyde specific productivity measurements showed that both the double and triple overexpression strains had increased production rates in comparison to the parental strain (Figure 5). Interestingly, the double overexpression strain had higher IBA productivity than the triple overexpression strain and had a slightly higher production rate than the best single overexpression strain, SA590-PK.
3.5. Pool size measurements
In addition to characterizing the growth and aldehyde production rates of the engineered strains, we also applied targeted pool size measurements to examine intracellular metabolite levels in each strain. Figure 6 shows the pool sizes of several metabolites in glycolysis and the TCA cycle for all strains in this study. Each analyte peak was normalized to OD750 at t=30hr and to a norvaline internal standard peak. The intracellular malate abundance varied significantly across the various engineered strains. In particular, overexpression of mdh led to an almost 20-fold increase in malate pool size compared to SA590. The combined expression of mdh and me reduced the malate pool size to about 2-fold higher than SA590, while overexpressing the entire PK bypass pathway restored malate levels to those observed in SA590 (Figure 6). In contrast, the triple-gene overexpression strain SA590-MDH/ME/PEPC exhibited the largest increase in pyruvate pool size among all of the engineered strains. Interestingly, however, this did not provide maximal aldehyde production (Figure 5), possibly due to the added metabolic burden of simultaneously overexpressing three enzymes. This result implies that the expression of enzymes within the PK bypass pathway needs to be carefully balanced in order to increase flux towards aldehyde production.
3.6 Enzyme activity measurements
To confirm that functional enzyme overexpression was achieved in the engineered strains, and also to determine the fold change in enzyme activities compared to the SA590 parent, we developed enzymatic assays for measuring PK, MDH, and ME activities in crude cyanobacterial extracts. Results are shown in Table 3 for SA590 and the two highest-producing engineered strains, SA590-PK and SA590-MDH/ME. Overexpression of the endogenous pk gene using the Plac promoter resulted in a 50% increase in PK enzyme activity in the SA590-PK strain. Interestingly, we were able to detect basal MDH activity in SA590, which has not been previously reported in Synechococcus PCC 7942. Although the genome of this cyanobacterial species does not contain an annotated mdh gene, the basal enzyme activity of MDH was similar in magnitude to PK and ME, which are encoded by known genes in Synechococcus. Overexpression of the codon-optimized mdh gene from Synechocystis PCC 6803 using the Ptrc promoter resulted in a nearly 18-fold increase in MDH enzyme activity in the SA590-MDH/ME strain. The endogenous me gene was overexpressed in this same strain using the Plac promoter, leading to a nearly 6-fold increase in NADP-dependent ME activity. The weak Plac promoter gave a much higher expression change in SA590-MDH/ME than in SA590-PK, possibly due to transcriptional read-through from the upstream mdh gene. We also detected NAD-dependent ME activity in the SA590 parent, but this activity was not significantly altered by me overexpression. Therefore, we concluded that the me gene overexpressed in our study (accession number: SYNPCC7942_1297) encodes an NADP-dependent ME isoform.
4. Discussion
This study demonstrates how knowledge of pathway fluxes can be used to guide rational metabolic engineering to improve strain performance. Using INST-MFA, we calculated fluxes that describe in vivo metabolic pathway activities of wild-type (WT) and recombinant (SA590) cyanobacterial strains under photoautotrophic conditions. A close examination of fluxes around the pyruvate node revealed substantial flux of PEP-derived carbon directed through PEPC rather than PK in both WT and SA590 (Figure 3). This result is comparable to prior INST-MFA results obtained in Synechocystis (Young et al., 2011), where the proposed PK bypass pathway was reported to channel carbon from PEP into malate before returning it to pyruvate through a series of reactions catalyzed by PEPC, MDH, and ME. While Young et al. reported an almost even distribution of flux at the PEP node—approximately 49% of the flux from PEP went through PEPC and 40% through PK (the remaining 11% went towards biomass production)—we found that the flux distribution at the PEP node was substantially skewed toward PEPC and away from PK in Synechococcus. This empirical observation led us to hypothesize that there is a potential bottleneck in the conversion of PEP to pyruvate that could limit flux to IBA.
We tested our hypothesis by overexpressing pk and enzymes in the PK bypass pathway. While all single-gene overexpression strains showed significant increases in aldehyde productivity compared to SA590 (Figure 5), the SA590-PK strain showed the largest increase in specific productivity. This result indicates that flux to IBA can be enhanced by simply increasing PK enzyme expression. The increase in aldehyde productivity we observed is consistent with a previous study that applied pk overexpression in S. elongatus PCC 7942 to enhance production of 2,3-butanediol, another pyruvate-derived product (Oliver and Atsumi, 2015). Although the abundance of several pyruvate-derived metabolites such as alanine and glutamine were significantly elevated in SA590-PK, the intracellular abundance of pyruvate was paradoxically reduced (Figure 6). This finding suggests that the productivity enhancement following PK overexpression may involve complex factors that accelerate conversion of pyruvate to IBA and amino acids, rather than a purely substrate-driven effect. Further 13C MFA studies are needed to fully elucidate the nature and extent of flux re-routing in the SA590-PK strain.
Previous studies have suggested that malic enzyme could be involved in a carbon concentrating mechanism that is similar to that found in C4 plants (Yang et al., 2002b). Additionally, other studies have shown that deletion of me in Synechocystis significantly reduced growth under both autotrophic and mixotrophic conditions, which could be rescued by providing exogenous pyruvate (Bricker et al., 2004; Shuvalov et al., 1986). Therefore, the high flux through ME may serve as a key route for pyruvate synthesis when PK activity is down-regulated due to reduced ADP/ATP ratios in the light. In spite of the apparent importance of ME flux, the SA590-ME strain showed the smallest increase in IBA productivity of all the single-gene overexpression strains, and it also exhibited a significant reduction in specific growth rate. The poor performance of the SA590-ME strain was likely due to intracellular depletion of malate (Figure 6B), suggesting that increasing the “pull” of flux from malate toward pyruvate must be balanced by simultaneously increasing the “push” of flux into malate. In contrast, single-gene overexpression of mdh led to substantial accumulation of malate (Figure 6B), leading us to further explore the interactions between the three PK bypass enzymes by constructing double- and triple-gene overexpression strains in the SA590 background.
Both double overexpression of mdh/me and triple overexpression of pepc/mdh/me showed substantial increases in aldehyde productivity when compared to the parental SA590 strain (Figure 5). The double overexpression strain had slightly higher aldehyde productivity than the SA590-PK strain, making it the highest producing strain examined in this study. These data suggest that the majority of flux control within the PK bypass pathway is distributed between the MDH and ME reaction steps, while PEPC does not represent a significant bottleneck. Both the mdh/me and pepc/mdh/me overexpressing strains exhibited malate levels that were similar to the SA590 parent strain, again emphasizing the importance of malate balancing to achieve maximal flux through the PK bypass pathway. Even though both the SA590-PK and SA590-MDH/ME strains showed similar specific productivities, the PK overexpressing strain still achieved slightly better growth, possibly due to the reduced metabolic burden of overexpressing one enzyme instead of two.
One potential concern with this study is that the heterologous IBA pathway may have been destabilized due to mutations in the alsS gene, as recently proposed by Nozzi and Atsumi (2015). We thoroughly investigated this possibility and found no evidence of genetic instability or leakiness of expression in the IBA pathway genes (Supplementary Materials and Figure A4). Another potential concern is that we did not attempt to systematically optimize the growth conditions of our cyanobacterial cultures, since this was not a goal of our study. As a result, the growth rate of SA590 was lower than previously reported by Atsumi et al. (2009). Differences in growth rates could be attributed to potential differences in media composition, CO2 content of the air mixture, initial seeding densities, light intensity, flask type, and pH adjustments. We performed all experiments under the standard culture conditions described in the Materials and Methods section, and there was no indication that the cultures were growing abnormally in our experiments. In searching the literature, however, we noted that two enzymes in the IBA biosynthetic pathway, encoded by alsS and kivd, require thiamin pyrophosphate for activity (de la Plaza et al., 2004; Snoep et al., 1992), and thiamin has been previously supplemented in the culture media of strains that overexpress these enzymes (Atsumi et al., 2009; Oliver and Atsumi, 2015). However, the effects of thiamin supplementation were not specifically examined in those prior studies. Therefore, we performed an additional experiment to investigate the effects of thiamin supplementation on the productivities of SA590 and the two highest-producing engineered strains, SA590-PK and SA590-MDH/ME (Figure A5). Compared to thiamin-free controls, supplementing 10mg/L of thiamin hydrochloride caused a significant decrease in growth of SA590-PK and SA590-MDH/ME but a significant increase in aldehyde productivity of all three strains examined. Importantly, the total aldehyde productivities of SA590-PK and SA590-MDH/ME were significantly higher than SA590 in both thiamin-free and thiamin-supplemented media. This result suggests that the effects of pk and mdh/me overexpression to enhance IBA production are maintained across different growth conditions.
One possible limitation of our study was that the quantification of aldehydes from cyanobacterial cultures was conducted in a closed-flask system rather than a continuously bubbled system. This approach allowed us to compare the performance of all strains in parallel, but it also introduced the risk that dissolved CO2 availability could become limited in culture and artificially reduce growth and aldehyde production of our strains. For example, Schwarz et al. (2011) have shown that limiting available carbon to cyanobacterial cells can decrease levels of malate and fumarate, while increasing levels of PEP, which would alter the availability of substrates for the PK, PEPC, and ME reactions. These changes in pool sizes could cause differences in performance between open- and closed-flask systems. To mitigate this risk, we supplemented the culture medium with 50 mM NaHCO3, which was previously found to be sufficient to sustain isobutanol production for 6 days in a closed-flask culture of Synechocystis (Varman et al., 2013). By monitoring the dissolved inorganic carbon content in our cultures, we found that approximately 50% of the supplied NaHCO3 was consumed over the period of the aldehyde assay, leaving excess carbon available at the end of the 30-hr incubation period (Figure A6). We confined our measurements to this period since we were interested in identifying metabolic engineering strategies to boost IBA production during the early growth phase when productivities are maximal, prior to the onset of severe light limitation, product inhibition, or product degradation. Because the values shown in Figures 4 and 5 were determined by measuring OD750 and aldehyde concentration at only two time points, we decided to confirm the results for SA590 and the two highest-producing engineered strains (SA590-PK and SA590-MDH/ME) by collecting samples at five time points. The linear increase in cell density and aldehyde titer over the 30-hr incubation period (Figure A7) indicates that aldehyde production was stable over this period. The aldehyde titers of both engineered strains were consistently higher than SA590 throughout the final 12 hours of the 30-hr batch cultivation. Future studies will directly evaluate whether the increases in aldehyde productivity observed in closed flasks are consistent with those observed in continuously bubbled open-flask cultures and whether the growth and aldehyde productivity of these strains are maintained over longer periods of time.
Finally, it is important to note that the isotopomer model used for 13C flux analysis in this study was based on certain assumptions about the metabolic network, some of which are yet to be fully validated. For example, the model allowed flux through the MDH reaction, although a specific MDH isoform has not been annotated in the genome of Synechococcus PCC 7942 (refer to Section 2.7 of Materials and methods). We confirmed the presence of significant MDH enzymatic activity in the parental SA590 strain (Table 3), which supports our choice to include MDH in the model and also reinforces the model prediction that MDH participates in a physiologically relevant PK bypass pathway. Also, few recent studies have attempted to estimate the complete biomass composition of this species. The growth equation used in our study was taken from Shastri and Morgan (2005) and is based on measurements of Synechocystis PCC 6803 composition. Broddrick et al. (2016) recently published a genome-scale model (GSM) of Synechococcus PCC 7942 that used a biomass composition that had been originally reported almost 50 years ago (Allen and Smith, 1969). The latter publication reported higher relative amounts of protein and lipids and lower amounts of carbohydrate and nucleic acids in comparison to the biomass composition used in our model. To further examine the effects of uncertainties in the biomass composition, we applied Monte Carlo analysis to assess the variation in flux estimates in response to relative errors of 20% in each of the growth equation coefficients. We found that net flux estimates were most strongly affected by changes in the growth equation, while the variations in exchange fluxes and pool sizes were contained within their respective 95% confidence ranges (Tables A3 and A4). Among the net fluxes, the largest variations occurred in the CBB cycle, TCA pathway, and anaplerotic fluxes (Table A6). These pathways are directly involved in carbon fixation and production of required biosynthetic precursors, both of which are stoichiometrically linked to the growth equation. It is recommended that future studies should directly quantify biomass composition under the growth conditions of interest, using recently developed methods that are more accurate and convenient than those previously available (Long and Antoniewicz, 2014).
5. Conclusion
Overall, this study illustrates the effectiveness of combining flux analysis with targeted pool size measurements to provide complementary datasets for optimizing product formation in engineered cyanobacterial host strains. 13C INST-MFA revealed a possible PK bypass pathway in both WT and IBA-producing S. elongatus strains and suggested that enzymes involved in pyruvate metabolism could be potential targets for debottlenecking flux towards aldehyde production. These targets were overexpressed in the parental SA590 strain, and further characterization of growth and aldehyde specific productivity showed that the SA590-PK and SA590-MDH/ME strains gave the largest increases in aldehyde production relative to SA590. Based on the prediction of significant MDH flux in the parental SA590 strain, we developed an MDH enzymatic assay and applied it to confirm the existence of endogenous MDH activity in Synechococcus PCC 7942, which has not been previously reported. Further flux analysis studies should be performed on the SA590-PK and SA590-MDH/ME strains to quantify changes in intracellular metabolic fluxes and to determine if these enzyme overexpressions unexpectedly affected other pathways of central carbon metabolism. In addition, future studies could examine additional engineering targets to increase pyruvate availability or shunt more carbon flux towards aldehyde production. Efforts to limit IVA production will also be beneficial to increase carbon flux towards IBA as the sole aldehyde product. This work demonstrates how application of 13C flux analysis to identify rational targets for strain improvement can be an integral part of a ‘design-build-test-learn’ metabolic engineering cycle.
Supplementary Material
Acknowledgments
This work was supported by the following grants: DOE award DE-SC008118 to JDY; NIH NIGMS awards R37 GM067152 and R01 GM107434 to CHJ. LJJ was supported by DOE DE-AC05-06OR23100. AOA and LJJ were partially supported by GAANN P200A090323.
References
- Allen MM, Smith AJ. Nitrogen chlorosis in blue-green algae. Arch Mikrobiol. 1969;69:114–20. doi: 10.1007/BF00409755. [DOI] [PubMed] [Google Scholar]
- Angermayr SA, Gorchs Rovira A, Hellingwerf KJ. Metabolic engineering of cyanobacteria for the synthesis of commodity products. Trends Biotechnol. 2015;33:352–61. doi: 10.1016/j.tibtech.2015.03.009. [DOI] [PubMed] [Google Scholar]
- Angermayr SA, van der Woude AD, Correddu D, Vreugdenhil A, Verrone V, Hellingwerf KJ. Exploring metabolic engineering design principles for the photosynthetic production of lactic acid by Synechocystis sp PCC6803. Biotechnology for Biofuels. 2014;7:15. doi: 10.1186/1754-6834-7-99. [DOI] [PMC free article] [PubMed] [Google Scholar]
- Antoniewicz MR, Kelleher JK, Stephanopoulos G. Determination of confidence intervals of metabolic fluxes estimated from stable isotope measurements. Metab Eng. 2006;8:324–37. doi: 10.1016/j.ymben.2006.01.004. [DOI] [PubMed] [Google Scholar]
- Antoniewicz MR, Kelleher JK, Stephanopoulos G. Accurate assessment of amino acid mass isotopomer distributions for metabolic flux analysis. Anal Chem. 2007;79:7554–9. doi: 10.1021/ac0708893. [DOI] [PubMed] [Google Scholar]
- Atsumi S, Higashide W, Liao JC. Direct photosynthetic recycling of carbon dioxide to isobutyraldehyde. Nat Biotechnol. 2009;27:1177–80. doi: 10.1038/nbt.1586. [DOI] [PubMed] [Google Scholar]
- Becker J, Wittmann C. Bio-based production of chemicals, materials and fuels - Corynebacterium glutamicum as versatile cell factory. Current Opinion in Biotechnology. 2012;23:631–640. doi: 10.1016/j.copbio.2011.11.012. [DOI] [PubMed] [Google Scholar]
- Bergmeyer HU, Gawehn K. Methods of Enzymatic Analysis. Academic Press, Inc; New York: 1974. [Google Scholar]
- Berla BM, Saha R, Immethun CM, Maranas CD, Moon TS, Pakrasi HB. Synthetic biology of cyanobacteria: unique challenges and opportunities. Frontiers in Microbiology. 2013;4 doi: 10.3389/fmicb.2013.00246. [DOI] [PMC free article] [PubMed] [Google Scholar]
- Bricker TM, Zhang S, Laborde SM, Mayer PR, 3rd, Frankel LK, Moroney JV. The malic enzyme is required for optimal photoautotrophic growth of Synechocystis sp. strain PCC 6803 under continuous light but not under a diurnal light regimen. Journal of Bacteriology. 2004;186:8144–8. doi: 10.1128/JB.186.23.8144-8148.2004. [DOI] [PMC free article] [PubMed] [Google Scholar]
- Broddrick JT, Rubin BE, Welkie DG, Du N, Mih N, Diamond S, Lee JJ, Golden SS, Palsson BO. Unique attributes of cyanobacterial metabolism revealed by improved genome-scale metabolic modeling and essential gene analysis. Proc Natl Acad Sci U S A. 2016;113:E8344–E8353. doi: 10.1073/pnas.1613446113. [DOI] [PMC free article] [PubMed] [Google Scholar]
- Bustos SA, Golden SS. Expression of the psbDII gene in Synechococcus sp. strain PCC 7942 requires sequences downstream of the transcription start site. J Bacteriol. 1991;173:7525–33. doi: 10.1128/jb.173.23.7525-7533.1991. [DOI] [PMC free article] [PubMed] [Google Scholar]
- Camsund D, Lindblad P. Engineered transcriptional systems for cyanobacterial biotechnology. Front Bioeng Biotechnol. 2014;2:40. doi: 10.3389/fbioe.2014.00040. [DOI] [PMC free article] [PubMed] [Google Scholar]
- Cheah YE, Zimont AJ, Lunka SK, Albers SC, Park SJ, Reardon KF, Peebles CAM. Diel light:dark cycles significantly reduce FFA accumulation in FFA producing mutants of Synechocystis sp PCC 6803 compared to continuous light. Algal Research-Biomass Biofuels and Bioproducts. 2015;12:487–496. [Google Scholar]
- de la Plaza M, de Palencia PF, Pelaez C, Requena T. Biochemical and molecular characterization of alpha-ketoisovalerate decarboxylase, an enzyme involved in the formation of aldehydes from amino acids by Lactococcus lactis. Fems Microbiology Letters. 2004;238:367–374. doi: 10.1016/j.femsle.2004.07.057. [DOI] [PubMed] [Google Scholar]
- Folch J, Lees M, Sloane Stanley GH. A simple method for the isolation and purification of total lipides from animal tissues. J Biol Chem. 1957;226:497–509. [PubMed] [Google Scholar]
- Geer BW, Krochko D, Oliver MJ, Walker VK, Williamson JH. A comparative study of the NADP-malic enzymes from Drosophila and chick liver. Comparative Biochemistry and Physiology Part B: Comparative Biochemistry. 1980;65:25–34. [Google Scholar]
- Hays SG, Ducat DC. Engineering cyanobacteria as photosynthetic feedstock factories. Photosynth Res. 2015;123:285–95. doi: 10.1007/s11120-014-9980-0. [DOI] [PMC free article] [PubMed] [Google Scholar]
- Jazmin LJ, O’Grady JP, Ma F, Allen DK, Morgan JA, Young JD. Isotopically nonstationary MFA (INST-MFA) of autotrophic metabolism. Methods Mol Biol. 2014;1090:181–210. doi: 10.1007/978-1-62703-688-7_12. [DOI] [PubMed] [Google Scholar]
- Kaplan A, Reinhold L. CO2 Concentrating Mechanisms in Photosynthetic Microorganisms. Annu Rev Plant Physiol Plant Mol Biol. 1999;50:539–570. doi: 10.1146/annurev.arplant.50.1.539. [DOI] [PubMed] [Google Scholar]
- Knowles VL, Smith CS, Smith CR, Plaxton WC. Structural and regulatory properties of pyruvate kinase from the Cyanobacterium synechococcus PCC 6301. J Biol Chem. 2001;276:20966–72. doi: 10.1074/jbc.M008878200. [DOI] [PubMed] [Google Scholar]
- Koffas M, Stephanopoulos G. Strain improvement by metabolic engineering: lysine production as a case study for systems biology. Current Opinion in Biotechnology. 2005;16:361–366. doi: 10.1016/j.copbio.2005.04.010. [DOI] [PubMed] [Google Scholar]
- Long CP, Antoniewicz MR. Quantifying biomass composition by gas chromatography/mass spectrometry. Anal Chem. 2014;86:9423–7. doi: 10.1021/ac502734e. [DOI] [PMC free article] [PubMed] [Google Scholar]
- Machado IM, Atsumi S. Cyanobacterial biofuel production. J Biotechnol. 2012;162:50–6. doi: 10.1016/j.jbiotec.2012.03.005. [DOI] [PubMed] [Google Scholar]
- Markley AL, Begemann MB, Clarke RE, Gordon GC, Pfleger BF. Synthetic biology toolbox for controlling gene expression in the cyanobacterium Synechococcus sp. strain PCC 7002. ACS Synth Biol. 2015;4:595–603. doi: 10.1021/sb500260k. [DOI] [PMC free article] [PubMed] [Google Scholar]
- McEwen JT, Machado IM, Connor MR, Atsumi S. Engineering Synechococcus elongatus PCC 7942 for continuous growth under diurnal conditions. Appl Environ Microbiol. 2013;79:1668–75. doi: 10.1128/AEM.03326-12. [DOI] [PMC free article] [PubMed] [Google Scholar]
- Melis A. Solar energy conversion efficiencies in photosynthesis: Minimizing the chlorophyll antennae to maximize efficiency. Plant Science. 2009;177:272–280. [Google Scholar]
- Murphy TA, Young JD. ETA: Robust software for determination of cell specific rates from extracellular time courses. Biotechnol Bioeng. 2013;110:1748–58. doi: 10.1002/bit.24836. [DOI] [PMC free article] [PubMed] [Google Scholar]
- Niederholtmeyer H, Wolfstadter BT, Savage DF, Silver PA, Way JC. Engineering Cyanobacteria To Synthesize and Export Hydrophilic Products. Applied and Environmental Microbiology. 2010;76:3462–3466. doi: 10.1128/AEM.00202-10. [DOI] [PMC free article] [PubMed] [Google Scholar]
- Nozzi NE, Atsumi S. Genome Engineering of the 2,3-Butanediol Biosynthetic Pathway for Tight Regulation in Cyanobacteria. Acs Synthetic Biology. 2015;4:1197–1204. doi: 10.1021/acssynbio.5b00057. [DOI] [PubMed] [Google Scholar]
- Nozzi NE, Oliver JW, Atsumi S. Cyanobacteria as a Platform for Biofuel Production. Front Bioeng Biotechnol. 2013;1:7. doi: 10.3389/fbioe.2013.00007. [DOI] [PMC free article] [PubMed] [Google Scholar]
- Oliver JW, Atsumi S. Metabolic design for cyanobacterial chemical synthesis. Photosynth Res. 2014;120:249–61. doi: 10.1007/s11120-014-9997-4. [DOI] [PubMed] [Google Scholar]
- Oliver JWK, Atsumi S. A carbon sink pathway increases carbon productivity in cyanobacteria. Metabolic Engineering. 2015;29:106–112. doi: 10.1016/j.ymben.2015.03.006. [DOI] [PubMed] [Google Scholar]
- Schwarz D, Nodop A, Huge J, Purfurst S, Forchhammer K, Michel KP, Bauwe H, Kopka J, Hagemann M. Metabolic and transcriptomic phenotyping of inorganic carbon acclimation in the Cyanobacterium Synechococcus elongatus PCC 7942. Plant Physiol. 2011;155:1640–55. doi: 10.1104/pp.110.170225. [DOI] [PMC free article] [PubMed] [Google Scholar]
- Schwarz D, Orf I, Kopka J, Hagemann M. Recent applications of metabolomics toward cyanobacteria. Metabolites. 2013;3:72–100. doi: 10.3390/metabo3010072. [DOI] [PMC free article] [PubMed] [Google Scholar]
- Shastri AA, Morgan JA. Flux balance analysis of photoautotrophic metabolism. Biotechnology Progress. 2005;21:1617–1626. doi: 10.1021/bp050246d. [DOI] [PubMed] [Google Scholar]
- Sheehan J. Engineering direct conversion of CO2 to biofuel. Nature Biotechnology. 2009;27:1128–1129. doi: 10.1038/nbt1209-1128. [DOI] [PubMed] [Google Scholar]
- Shuvalov VA, Vasmel H, Amesz J, Duysens LNM. Picosecond Spectroscopy of the Charge Separation in Reaction Centers of Chloroflexus-Aurantiacus with Selective Excitation of the Primary Electron-Donor. Biochimica Et Biophysica Acta. 1986;851:361–368. [Google Scholar]
- Snoep JL, Demattos MJT, Starrenburg MJC, Hugenholtz J. Isolation, Characterization, And Physiological-Role Of The Pyruvate-Dehydrogenase Complex And Alpha-Acetolactate Synthase Of Lactococcus-Lactis Subsp Lactis Bv Diacetylactis. Journal of Bacteriology. 1992;174:4838–4841. doi: 10.1128/jb.174.14.4838-4841.1992. [DOI] [PMC free article] [PubMed] [Google Scholar]
- Varman AM, Xiao Y, Pakrasi HB, Tang YJ. Metabolic engineering of Synechocystis sp. strain PCC 6803 for isobutanol production. Appl Environ Microbiol. 2013;79:908–14. doi: 10.1128/AEM.02827-12. [DOI] [PMC free article] [PubMed] [Google Scholar]
- Wang B, Pugh S, Nielsen DR, Zhang WW, Meldrum DR. Engineering cyanobacteria for photosynthetic production of 3-hydroxybutyrate directly from CO2. Metabolic Engineering. 2013a;16:68–77. doi: 10.1016/j.ymben.2013.01.001. [DOI] [PubMed] [Google Scholar]
- Wang W, Liu X, Lu X. Engineering cyanobacteria to improve photosynthetic production of alka(e)nes. Biotechnol Biofuels. 2013b;6:69. doi: 10.1186/1754-6834-6-69. [DOI] [PMC free article] [PubMed] [Google Scholar]
- Xiong W, Lee TC, Rommelfanger S, Gjersing E, Cano M, Maness PC, Ghirardi M, Yu JP. Phosphoketolase pathway contributes to carbon metabolism in cyanobacteria. Nature Plants. 2016;2 doi: 10.1038/nplants.2015.187. [DOI] [PubMed] [Google Scholar]
- Xiong W, Morgan JA, Ungerer J, Wang B, Maness PC, Yu JP. The plasticity of cyanobacterial metabolism supports direct CO2 conversion to ethylene. Nature Plants. 2015;1 [Google Scholar]
- Xu Y, Ma PJ, Shah P, Rokas A, Liu Y, Johnson CH. Non-optimal codon usage is a mechanism to achieve circadian clock conditionality. Nature. 2013;495:116–120. doi: 10.1038/nature11942. [DOI] [PMC free article] [PubMed] [Google Scholar]
- Yang C, Hua Q, Shimizu K. Integration of the information from gene expression and metabolic fluxes for the analysis of the regulatory mechanisms in Synechocystis. Appl Microbiol Biotechnol. 2002a;58:813–22. doi: 10.1007/s00253-002-0949-0. [DOI] [PubMed] [Google Scholar]
- Yang C, Hua Q, Shimizu K. Metabolic flux analysis in Synechocystis using isotope distribution from 13C-labeled glucose. Metab Eng. 2002b;4:202–16. doi: 10.1006/mben.2002.0226. [DOI] [PubMed] [Google Scholar]
- Yang C, Hua Q, Shimizu K. Quantitative analysis of intracellular metabolic fluxes using GC-MS and two-dimensional NMR spectroscopy. J Biosci Bioeng. 2002c;93:78–87. [PubMed] [Google Scholar]
- You L, Berla B, He L, Pakrasi HB, Tang YJ. 13C-MFA delineates the photomixotrophic metabolism of Synechocystis sp. PCC 6803 under light- and carbon-sufficient conditions. Biotechnol J. 2014;9:684–92. doi: 10.1002/biot.201300477. [DOI] [PubMed] [Google Scholar]
- Young JD. INCA: a computational platform for isotopically non-stationary metabolic flux analysis. Bioinformatics. 2014;30:1333–5. doi: 10.1093/bioinformatics/btu015. [DOI] [PMC free article] [PubMed] [Google Scholar]
- Young JD, Shastri AA, Stephanopoulos G, Morgan JA. Mapping photoautotrophic metabolism with isotopically nonstationary 13C flux analysis. Metab Eng. 2011;13:656–65. doi: 10.1016/j.ymben.2011.08.002. [DOI] [PMC free article] [PubMed] [Google Scholar]
- Young JD, Walther JL, Antoniewicz MR, Yoo H, Stephanopoulos G. An elementary metabolite unit (EMU) based method of isotopically nonstationary flux analysis. Biotechnol Bioeng. 2008;99:686–99. doi: 10.1002/bit.21632. [DOI] [PubMed] [Google Scholar]
- Zhu XG, Long SP, Ort DR. Improving Photosynthetic Efficiency for Greater Yield. Annual Review of Plant Biology. 2010;61:235–261. doi: 10.1146/annurev-arplant-042809-112206. Vol 61. [DOI] [PubMed] [Google Scholar]
Associated Data
This section collects any data citations, data availability statements, or supplementary materials included in this article.