Abstract
We developed a dynamic model of a rat proximal convoluted tubule cell in order to investigate cell volume regulation mechanisms in this nephron segment. We examined whether regulatory volume decrease (RVD), which follows exposure to a hyposmotic peritubular solution, can be achieved solely via stimulation of basolateral K+ and Cl− channels and cotransporters. We also determined whether regulatory volume increase (RVI), which follows exposure to a hyperosmotic peritubular solution under certain conditions, may be accomplished by activating basolateral Na+/H+ exchangers. Model predictions were in good agreement with experimental observations in mouse proximal tubule cells assuming that a 10% increase in cell volume induces a 4-fold increase in the expression of basolateral K+ and Cl− channels and cotransporters. Our results also suggest that in response to a hyposmotic challenge and subsequent cell swelling, cotransporters are more efficient than basolateral K+ and Cl− channels at lowering intracellular osmolality and reducing cell volume. Moreover, both RVD and RVI are predicted to stabilize net transcellular Na+ reabsorption, that is, to limit the net Na+ flux decrease during a hyposmotic challenge or the net Na+ flux increase during a hyperosmotic challenge.
Keywords: cell volume regulation, osmotic challenge, proximal tubule, mathematical model
1 Introduction
Animal cells lack a rigid cell wall and most have water-permeable membranes. Thus, an imbalance between intracellular and extracellular fluid osmolality drives water movement across the cell membrane, altering cell volume. Excessive changes in cell volume may impair the cell’s structural integrity and protein function.
Given the complex homeostatic mechanisms that act to maintain the composition of body fluids stable, most cells are bathed in extracellular fluid with an essentially constant osmolality. Nonetheless, there are important exceptions. Fluid osmolality in the renal medulla of the mammalian kidney can vary over a large range, reaching 1500–3000 mosm/(kg H2O) in a rat in an antidiuretic state [24]. The high salt and urea concentrations result in a hyperosmotic shock to the medullary epithelial cells, as well as to red blood cells passing through the renal medulla. Another example is the hypotonic shock experienced by intestinal epithelial cells after excessive water intake [16].
To avoid large fluctuations in cell volume, animal cells are endowed with regulatory mechanisms that adjust the rate of solute transport across cell membranes and/or cellular metabolism. The activation of transport pathways, including channels and coupled transporters, allows inorganic osmolytes to drive water flow [22]. The pathways that mediate cell volume regulation (CVR) differ among cell types. Regulatory volume decrease (RVD) mechanisms generally involve stimulation of K+ and Cl− channels, as well as K+-Cl− and other electroneutral cotransporters, leading to a loss of KCl and other solutes so as to reduce cell swelling. Regulatory volume increase (RVI) entails activating Na+-K+-2Cl− and/or Na+-Cl− cotransporters, Na+/H+ and exchangers, resulting in a gain of NaCl and other solutes to counteract cell shrinkage [7,8,22].
In this study, we examined the volume regulatory mechanisms of an epithelial cell of the proximal convoluted tubule, the nephron segment that connects Bowman’s capsule to the loop of Henle. The proximal convoluted tubule is situated in the cortex, that is, the outer portion of the kidney between the renal capsule and the renal medulla. Unlike in the renal medulla, in the cortex interstitial fluid osmolality is typically stabilized at plasma value. However, extracellular fluid composition may be altered in diseased states (e.g., in hyperglycemia) or after salt loading. We focused on this segment because of the crucial role it plays in renal water and solute transport: the proximal tubule is responsible for reabsorbing about two-thirds of the filtered loads of water and salt.
The mechanisms by which proximal tubule cells can theoretically maintain homeostasis have been explored in depth by Weinstein. In a series of studies based on control theory [29–32], Weinstein identified plausible mechanisms that would allow the proximal tubule cell to adapt to minute-by-minute variations in glomerular filtration without substantial changes in cell volume and composition. Simulations in which transport parameters were varied as a function of cell volume predicted that apical anion exchangers, basolateral Na+-dependent anion exchangers, and basolateral K+ channels have very little homeostatic efficiency, whereas modulation of peritubular K+-Cl− and cotransport dampens increases in cell volume without diminishing transcellular Na+ transport [30]. Ex vivo and in vitro observations suggest, however, that RVD in proximal tubule cells is mediated by basolateral K+ channels, Cl− channels, and co-transporters (see below). In the present work, we sought to determine whether the regulatory mechanisms that have been identified experimentally suffice to achieve cell volume regulation.
Studies on perfused and non-perfused tubules and on isolated cells have shown that in case of hyposmotic cell swelling, the proximal tubule cell decreases its volume via K+ loss [9]. The dumping of K+ is accomplished by increasing the conductance of basolateral K+ and Cl− channels [3,35], and may also involve basolateral co-transporters [26,27]. The response of proximal tubule cells to an increase in peritubular osmolality is less well-defined. In an ex vivo study, rabbit proximal tubule cells were found to shrink and to remain reduced in size following the sudden addition of NaCl to the bath, but partial volume recovery was observed following the sudden addition of mannitol (a metabolically inert, osmotic control solute that is used to elevate blood plasma or other fluid osmolality) [6]. In another ex vivo study, rabbit proximal cells were able to maintain a constant volume when extracellular osmolality was gradually increased by adding NaCl to the bath [15]. In non-perfused proximal tubules from mice, cells remained in a shrunken state following rapid exposure to a hyperosmotic mannitol solution. However, inhibition of P-glycoprotein (P-gp), a member of the ATP-binding cassette superfamily of transporters, restored RVI in these mouse cells, by activating basolateral Na+/H+ exchangers (NHE) [17,18]. It was further shown that the pathways by which P-gp modulates hyperosmotic mannitol-induced RVI involve PKC as well as components of the cytoskeleton such as microtubules and microfilaments [19].
The goals of this study were to determine whether the mechanisms described above are sufficient to maintain cell volume when extracellular fluid composition is changed, and to assess the contribution of individual transport pathways to CVR. To do so, we developed a dynamic model of a proximal convoluted tubule epithelial cell that includes CVR, and conducted simulations to predict the cell’s response to different osmotic challenges.
2 Model Formulation
Proximal tubule cells form a single-layer epithelium; adjacent cells are connected by tight junctions. In the present study, we examined CVR in a single proximal tubule cell. To do so, we used a previously published computational cell model [11], which built upon the work of Weinstein and colleagues [33]. The model represents 15 major solutes (Na+, K+, Cl−, , H2CO3, CO2, , urea, NH3, , H+, , H2CO2, and glucose) together with the associated transporters (Figure 1). Model equations are based on mass conservation and electroneutrality constraints. The proximal tubule cell is represented as a compliant cellular compartment, bounded by luminal and peritubular (bath) solutions as well as a lateral, paracellular space. All compartments are assumed to be well-stirred.
Fig. 1.
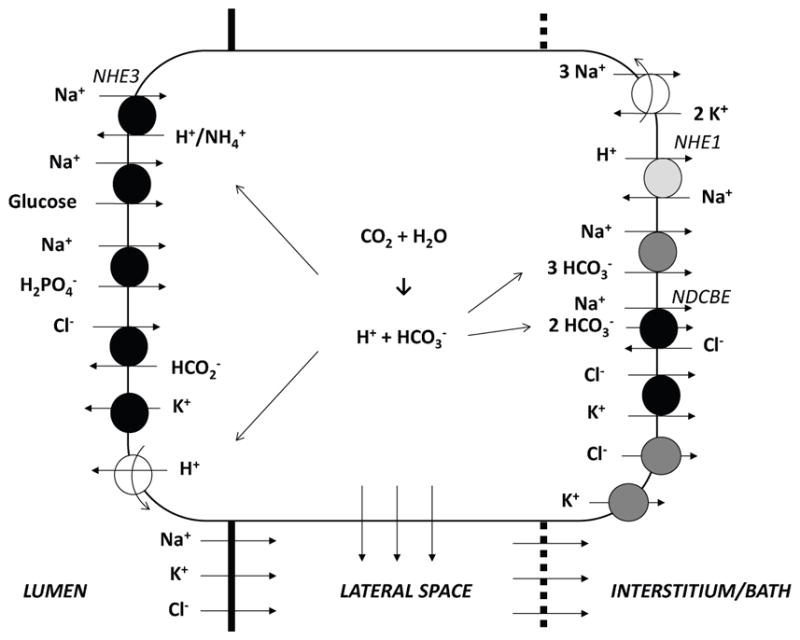
Model representation of a rat proximal convoluted tubule cell and the adjacent paracellular pathway. The transporters involved in regulatory volume decrease (RVD) and increase (RVI) are respectively shown in dark and light grey. The lateral membrane expresses the same transporters as the basal membrane.
2.1 Conservation equations
Water conservation in the cellular and paracellular (i.e., lateral) compartments (denoted by subscripts ‘C’ and ‘P’, respectively) is given by:
| (1) |
| (2) |
where the subscripts ‘L’ and ‘B’ denote lumen and bath, respectively, and ‘v’ denotes volume or water. In the above notations, water flux Jv,ij is taken positive from compartment i to j.
Conservation of non-reacting solute k is given by:
| (3) |
| (4) |
where Ck,i denotes the concentration of solute k in compartment i, and Jk,ij denotes the transmembrane flux of solute k from compartment i to j.
For the reacting solutes, conservation is applied to the total buffers:
| (5) |
| (6) |
| (7) |
| (8) |
where i corresponds to ‘C’ or ‘P’. Ĵk,i denotes the net flux of solute k into compartment i; specifically, Ĵk,C ≡ Jk,LC + Jk,BC + Jk,PC and Ĵk,P ≡ Jk,LP + Jk,BP + Jk,CP.
The buffer pairs are assumed to be in equilibrium:
| (9) |
where the buffer pairs (A,B) are ( , H2CO3), ( ,), (NH3, ), and ( ,H2CO2). pH is given by conservation of hydrogen ion:
| (10) |
where the summation index k is applied over the solutes H+, , H2CO3, and H2CO2.
Volume fluxes are calculated using the Kedem-Katchalsky equation. The transmembrane solute flux includes several components, depending on the solute: it is the net result of electrodiffusive transport (e.g., across ionic channels), coupled transport across cotransporters and/or exchangers, and primary active transport across ATP-driven pumps [11].
2.2 Regulatory Volume Decrease
We assume that proximal tubule cells achieve RVD by adjusting the membrane expression of basolateral K+ and Cl− channels as well as that of basolateral cotransporters, as observed experimentally [9,26,35]. To represent these mechanisms, we define target cotransporter, K+ channel, and Cl− channel expression levels, denoted x̄Na−HCO3, x̄K, and x̄Cl, which are taken to be increasing functions of cell volume V. In a study of RVD in cells from the outer medullary collecting duct (another nephron segment), Zarogiannis et al. [36] found that a parabolic dependence of model parameters on V yielded a good fit between model predictions and experimental data; similarly, we assume that:
| (11) |
| (12) |
| (13) |
In the above expressions, the superscript “0” denotes baseline values, and ΔV denotes the fractional deviation in cell volume, given by . The gain G is set to 4.0 and μ to 0.10 so that model predictions match the experimental data of Völkl and Lang [28]. The rates of change in the membrane expression of cotransporters, K+ channels, and Cl− channels are then given by:
| (14) |
| (15) |
| (16) |
where the time constant τ is set to 100 s.
As water enters the cell, the swelling of the cytoskeleton is opposed by membrane tension. The balance of these mechanical forces yields the following relation for intracellular hydrostatic pressure [23]:
| (17) |
where Kb is the drain bulk modulus, taken to be 600 Pa, or 4.5 mmHg [20]; km is the membrane elasticity constant, taken to be 6 × 10⁻⁶ N/s [21]; r0 is the reference effective cell radius, taken to be 10 μm. The factor e5(1+|ΔV )|/e5 represents the nonlinear relation between cell volume and membrane tension due to the membrane’s hyperelasticity. The hydrostatic pressure is taken as 12 and 0 mmHg, respectively, in the lumen and bath.
2.3 Regulatory Volume Increase
As described above, RVI is not observed in mouse proximal tubule cells unless P-gp is inhibited [17]. When it does happen, RVI is accomplished, at least partly, via stimulation of basolateral NHE [18]. To represent this activation, we define a target basolateral NHE expression level, denoted x̄NHE, that increases when cell volume decreases:
| (18) |
where G is set to 4.0 and ν is varied between 0.01 and 0.1. Fluxes across the basolateral NHE are computed using the non-linear thermodynamic formulation, and the baseline transporter density coefficient is set to 1x10⁻⁹ mmol2.J−1.s−1.cm−2. The rate of change in the membrane expression of basolateral NHE is given by
| (19) |
where the time constant τ is 100 s.
3 Simulation Results
The baseline composition of the bath and lumen solution is given in Table 1. These concentration values were chosen to be consistent with the experimental protocol in Ref. [28].
Table 1.
Baseline composition of solutions. Na-A, Na-acetate; G, glucose; M, mannitol; Osm, osmolality.
| NaCl | KCl | NaHCO3 | CaCl2 | MgCl2 | Na2HPO4 | Na-A | G | M | Osm | |
|---|---|---|---|---|---|---|---|---|---|---|
| Bath | 70 | 5 | 20 | 1.3 | 1 | 2 | 10 | 5 | 80 | 308 |
| Lumen | 120 | 5 | 20 | 1.3 | 1 | 2 | — | — | 5 | 308 |
Decreases in bath solution osmolality
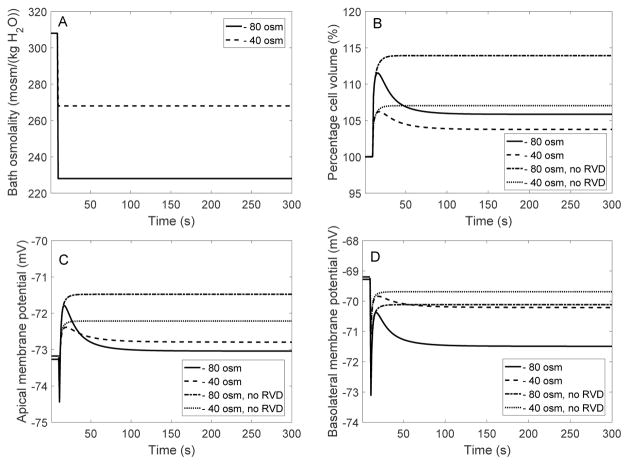
We first examined the model cell’s response to a hyposmotic challenge (referred to as “EXP I”). In two separate simulations, the osmolality of the bath solution was lowered by 40 and 80 mosm/(kg H2O) at time = 10 s, by changing the concentration of mannitol; see Figure 2A. For each of the experimental protocols, we conducted four simulations: (i) with full RVD (i.e., Eqs. 11, 12, and 13), (ii) with adjustment of cotransporter expression only (i.e., Eq. 11 but with xK and xCl set to and , respectively), (iii) with adjustment of K+ and Cl− channel expression only (i.e., Eqs. 12 and 13 but with xNa−HCO3 set to ), and (iv) without RVD (i.e., with xNa−HCO3, xK and xCl set to their respective reference values , and ). Key model predictions are summarized in Table 2.
Fig. 2.
EXP I. Dynamic response of cell volume and membrane potential to a hyposmotic challenge. A, bath osmolality was decreased by 40 and 80 mosm/(kg H2O) at time = 10 s. B, cell volume relative to baseline. C, apical membrane potential. D, basolateral membrane potential.
Table 2.
EXP I: Steady-state cell response to an osmotic challenge, obtained with full RVD, without change in K+ and Cl− channel density (“no ch”), without change in cotransporter density (“no NaBic”), and without RVD.
| Cell | Control | full RVD | no ch | no NaBic | no RVD |
|---|---|---|---|---|---|
| Bath osm −40 mosm/(kgH2O) | |||||
| Volume (%) | 100 | 103 | 104 | 104 | 107 |
| Vbl (mV) | −69 | −70 | −67 | −74 | −70 |
| Osm (mosm/(kgH2O)) | 310 | 302 | 302 | 302 | 304 |
| [K+] (mM) | 159 | 154 | 155 | 155 | 157 |
|
| |||||
| Bath osm −80 mosm/(kgH2O) | |||||
| Volume (%) | 100 | 105 | 107 | 109 | 114 |
| Vbl (mV) | −69 | −71 | −63 | −80 | −70 |
| Osm (mosm/(kgH2O)) | 310 | 295 | 296 | 297 | 302 |
| [K+] (mM) | 159 | 150 | 152 | 152 | 157 |
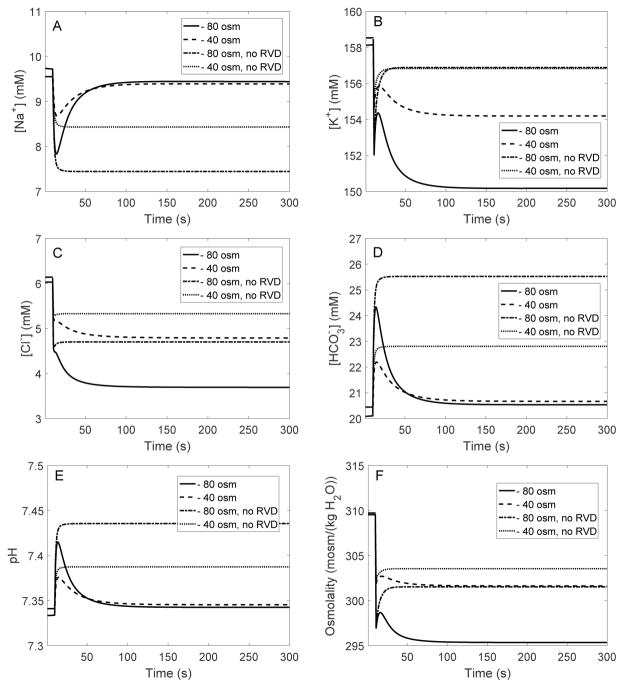
When bath osmolality was reduced by 40 and 80 mosm/(kg H2O), in the absence of RVD cell volume increased until it was 7 and 14% larger than its baseline value, respectively. See results in Table 2, columns labeled “no RVD”, and Fig. 2B. Water influx lowered the intracellular concentrations of most solutes, except for some acid-base species such as , whose concentration increased due to cell alkalinization (Figure 3).
Fig. 3.
EXP I. Changes in intracellular [Na+] (A), [K+] (B), [Cl−] (C), [ ] (D), pH (E), and osmolality (F), in response to a hyposmotic challenge.
With fully active RVD, cell swelling was significantly attenuated. When bath osmolality was reduced by 40 and 80 mosm/(kg H2O), the model cell underwent a transient volume expansion of 6 and 11%, respectively, before settling down to a steady-state volume that is 3 and 5%, respectively, above control. See results in Table 2, columns labeled “full RVD”, and Fig. 2B. The predicted fractional volume expansion is approximately 1/3 of the corresponding values without RVD (see above). These results are in agreement with the observations of Völkl and Lang [28], who observed a 6% increase in cell volume in perfused mouse proximal straight tubules after a 80 mosm/(kg H2O) decrease in bath solution osmolality. Similarly, in cultured mouse proximal convoluted tubule cells, cell volume returned to 105% of its original value when the osmolality of the surrounding solution was reduced by 100 mosm/(kg H2O) [3].
In accordance with observations in isolated proximal tubules [9,26,35], the model assumes that cell swelling induces stimulation of K+ and Cl− channels, as well as upregulation of basolateral cotransporters. Note that the conductance of the basolateral membrane to Cl− is taken to be 20 times lower than that to K+ [11] and therefore has a much smaller impact on cell homeostasis. The cotransporter has a 1 stoichiometry, and its equilibrium potential is about −25 mV, that is higher (less negative) than the basolateral potential (denoted Vbl); conversely, the equilibrium potential of K+ is lower than Vbl. Exposure to a hypotonic bath is predicted to slightly hyperpolarize the basolateral membrane (Fig. 2D).
The higher basolateral K+ and Cl− conductances augment K+ and Cl− loss from the cell (Fig. 3B–C), which, together with enhanced efflux via cotransporters, reduces intracellular fluid osmolality (Fig. 3F) and limits cell volume expansion. The predicted steady-state basolateral membrane potential, intracellular [K+], and intracellular osmolality are also shown in Table 2. Relative to the case without RVD, intracellular [K+] and [Cl−] obtained with full RVD are significantly lower (see Fig. 3B–C). Conversely, intracellular [Na+] and [ ] return to values that are much closer to control, compared to the case without RVD (Fig. 3A–D).
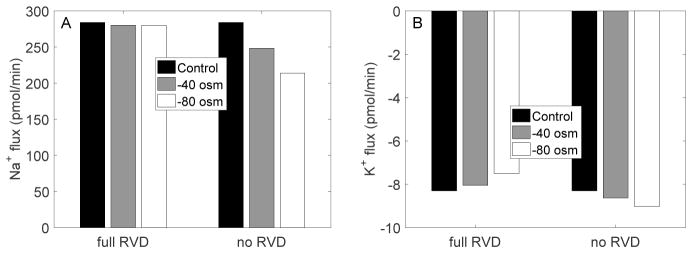
Figure 4 shows steady-state transcellular Na+ and K+ fluxes, obtained with and without RVD. In the absence of RVD, when bath fluid osmolality was decreased from 320 to 240 mosm/(kg H2O), the transcellular reabsorption of Na+ decreased by 20%, whereas the transcellular secretion of K+ increased by 8%. When RVD was active, the hyposmotic challenge had only a minimal impact on Na+ transport at steady-state, and it reduced transcellular K+ secretion (in contrast to the case without RVD), by 9%, owing to activation of the basolateral K+ conductance, which mediates K+ reabsorption (Fig. 1).
Fig. 4.
EXP I. Steady-state transcellular Na+ and K+ fluxes with and without RVD.
The parameters that describe the dependence of transporter expression on cell volume, i.e., the gain G and denominator μ in Eqs. 11–13, were adjusted so as to fit the experimental data of Völkl and Lang [28]. To assess the sensitivity of model results to parameter values, we computed the steady-state and peak values of cell volume, osmolality, [K+], and Vbl following a 80 mosm/(kgH2O) decrease in bath osmolality, assuming a 10% increase or decrease in G, μ, and the bulk modulus Kb (Eq. 17). We computed the percentage deviation as:
| (20) |
where xnew and xbase denote the predicted values with and without the parameter variation, respectively, and xctrl denotes the control value, i.e., without the osmolality challenge. As shown in Table 3, deviations were < 8% for cell volume, and < 4% for cell osmolality, [K+], and Vbl. A 20% increase or decrease in G, μ, or Kb approximately doubled the % deviation (results not shown). Note that the membrane elasticity constant km has a negligible effect on model results.
Table 3.
Impact of parameter values on the cell response to a 80 mosm/(kgH2O) decrease in bath osmolality, assuming full RVD. Results are shown as percentage deviation from the baseline case (corresponding to G = 4.0, μ = 0.10, and Kb = 600 Pa).
| End of EXP I values | Peak values | |||||||
|---|---|---|---|---|---|---|---|---|
| Vol | Vbl | Cell osm | [K+] | Max vol | Min Vbl | Min cell osm | ||
| G | +10% | −4.4 | 2.0 | 0.7 | 1.9 | −1.9 | 0.2 | 0.5 |
| −10% | 5.2 | −2.4 | −0.9 | −2.3 | 1.8 | −0.2 | −0.5 | |
| μ | +10% | 6.9 | −3.1 | −1.1 | −3.1 | 1.6 | −0.2 | −0.6 |
| −10% | −7.5 | 3.3 | 1.2 | 3.2 | −3.4 | 0.3 | 1.0 | |
| Kb | +10% | −0.6 | 0.0 | −1.3 | −1.5 | −1.7 | 0.2 | −2.1 |
| −10% | 0.6 | 0.0 | 1.3 | 1.5 | 1.7 | −0.1 | 2.2 | |
What are the relative contributions of cotransporters and K+ and Cl− channels to RVD?
The fractional increase in membrane expression induced by cell swelling was taken to be the same for these 3 transporters in the simulations described above. We then conducted separate simulations in which the expression level of cotransporters or that of K+ and Cl− channels was held constant. Key simulation results are shown in Table 2, columns labeled “no NaBic” and “no ch,” respectively.
When the cotransporter density was fixed during a hyposmotic challenge (i.e., the “no NaBic” case), the reduced efflux of ions, relative to full RVD, resulted in a higher intracellular osmolality. Moreover, the lower flux across the electrogenic cotransporter, relative to full RVD, yielded a more negative basolateral membrane potential (Table 2), which limited K+ efflux and resulted in higher intracellular [K+].
Conversely, when K+ and Cl− channel adjustment was disabled (i.e., the “no ch” case), the enhanced efflux through upregulated cotransporters generated significant depolarization: when bath osmolality was reduced by 80 mosm/(kg H2O), Vbl was 8 mV higher than in the full RVD case. Nevertheless, steady-state intracellular [K+] was higher than in the full RVD case, owing to the lower basolateral K+ permeability. Relative to the “no NaBic” case, the predicted steady-state cell volume was smaller (Table 2), which suggests that cotransporters are more efficient than basolateral K+ and Cl+ channels in mediating RVD.
Isotonic increase in bath solution [K+]
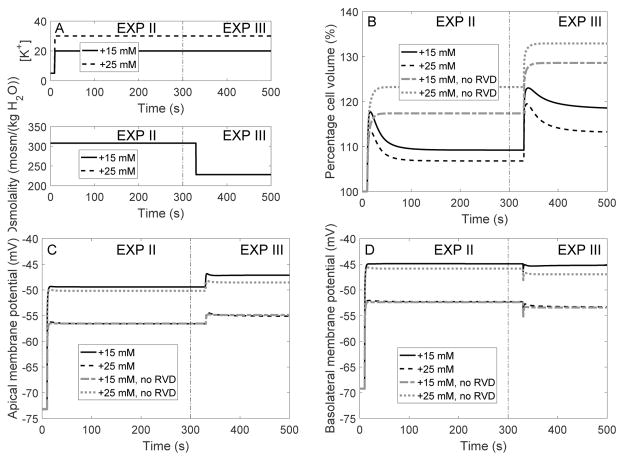
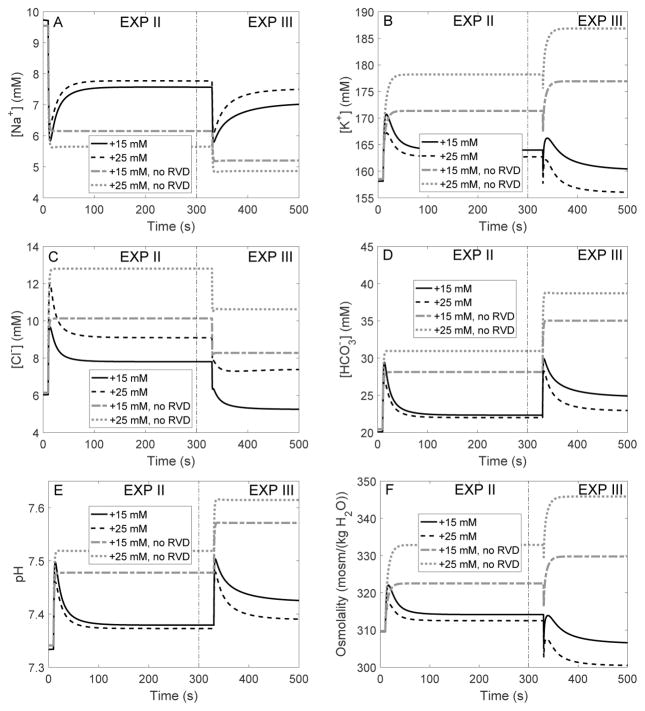
We then conducted simulations in which bath solution [K+] was increased at time = 10 s; bath [Na+] was decreased by the same amount to maintain isotonicity. Time profiles of bath [K+] are shown in Figure 5A. Simulations were conducted with full RVD, without RVD, with adjustment in K+ and Cl− channel expression only, and with adjustment in cotransporter expression only. Key results are shown in Table 4, under “EXP II.”
Fig. 5.
Dynamic response of cell volume and membrane potential to an increase in bath [K+] (EXP II) followed by a reduction in bath osmolality (EXP III). A, bath [K+] was increased by 15 and 25 mM at time = 10 s, then bath osmolality was reduced by 80 mosm/(kg H2O) at time = 350 s. B, cell volume relative to baseline. C and D, apical and basolateral membrane potential.
Table 4.
EXP II and EXP III: Steady-state cell response to bath [K+] increase followed by an hyposmotic challenge, obtained with full RVD, without change in K+ and Cl− channel density (“no ch”), without change in cotransporter density (“no NaBic”), and without RVD.
| Cell | Control | full RVD | no ch | no NaBic | no RVD |
|---|---|---|---|---|---|
| EXP II: Bath [K+] +15 mM | |||||
| Volume (%) | 100 | 106 | 108 | 113 | 117 |
| Vbl (mV) | −69 | −52 | −47 | −58 | −52 |
| Osm (mosm/(kgH2O)) | 310 | 313 | 313 | 318 | 323 |
| [K+] (mM) | 159 | 163 | 164 | 168 | 171 |
|
| |||||
| EXPII: Bath [K+] +25 mM | |||||
| Volume (%) | 100 | 109 | 111 | 121 | 123 |
| Vbl (mV) | −69 | −45 | −40 | −49 | −46 |
| Osm (mosm/(kgH2O)) | 310 | 314 | 316 | 328 | 333 |
| [K+] (mM) | 159 | 164 | 166 | 175 | 178 |
|
| |||||
| EXP III: Bath [K+] +15 mM, osm −80 mosm/(kgH2O) | |||||
| Volume (%) | 100 | 112 | 117 | 128 | 129 |
| Vbl (mV) | −69 | −53 | −45 | −59 | −53 |
| Osm (mosm/(kgH2O)) | 310 | 300 | 306 | 327 | 330 |
| [K+] (mM) | 159 | 156 | 161 | 174 | 177 |
|
| |||||
| EXPIII: Bath [K+] +25 mM, osm −80 mosm/(kgH2O) | |||||
| Volume (%) | 100 | 118 | 122 | 134 | 133 |
| Vbl (mV) | −69 | −45 | −39 | −50 | −47 |
| Osm (mosm/(kgH2O)) | 310 | 306 | 313 | 349 | 346 |
| [K+] (mM) | 159 | 160 | 166 | 188 | 187 |
In the absence of RVD, raising bath [K+] to 15 and 25 mM rapidly depolarized the cell and raised intracellular [K+] to 171 and 178 mM, respectively (Table 4, column “no RVD”, and Figure 6B). The depolarization in turn led to increases in intracellular [Cl−] and [ ] (Fig. 6C–D). The change in cellular composition elevated cytosolic osmolality (from 310 to 323 and 333 mosm(kg H2O), respectively; see Table 4 and Fig. 6F), resulting in water entry and cell swelling. As a result, cell volume increased to 17 and 23% above control, respectively (Table 4 and Fig. 5B).
Fig. 6.
EXP II and EXP III. Intracellular solute concentrations (A–D), pH (E), and fluid osmolality (F), as a function of time, in response to an increase in bath [K+] at time = 10 s, followed by a reduction in bath osmolality by 80 mosm/(kg H2O) at time = 350 s.
RVD did not significantly modify the cell’s initial response (the first 20 s). However, as the cell begun to swell, the regulatory mechanisms induced an increase in the membrane expression of basolateral K+ and Cl− channels and cotransporters, thereby reducing intracellular [K+], [Cl−] and [ ] (Fig. 6). Intracellular [K+] was lowered to almost control level (Table 4, column “full RVD”). The resulting decrease in intracellular fluid osmolality limited water entry. As a result, when bath solution [K+] was raised by 15 and 25 mM, RVD restored the cell volume to 6 and 9%, respectively, above control (Table 4 and Fig. 5B).
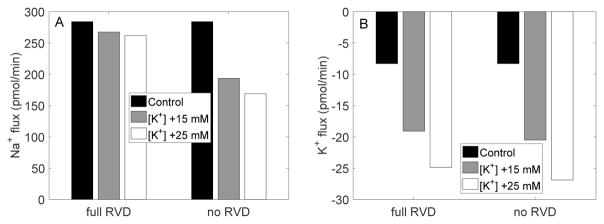
Figure 7 shows steady-state transcellular Na+ and K+ fluxes, obtained with and without RVD. In the absence of RVD, when bath fluid [K+] was increased by 25 mM, the transcellular reabsorption of Na+ decreased by 41%, whereas the transcellular secretion of K+ increased 3.2-fold. When RVD was active, the transcellular Na+ flux was similar to control; in contrast, the increase in transcellular K+ secretion was little affected.
Fig. 7.
EXP II. Steady-state transcellular Na+ and K+ fluxes with and without RVD.
We also assessed the sensitivity of model results to parameter values following a 25 mM increase in bath fluid [K+]. A 10% increase or decrease in G, μ, or Kb altered model predictions by 8.3% at most, as shown in Table 5, and a 20% increase or decrease in G, μ, or Kb approximately doubled the % deviation (results not shown). The variable most sensitive to changes in parameter values was cell osmolality.
Table 5.
Impact of parameter values on the cell response to a 25 mM increase in bath fluid [K+], assuming full RVD. Results are shown as percentage deviation from the baseline case (corresponding to G = 4.0, μ = 0.10, and Kb = 600 Pa).
| End of EXP II values | Peak values | |||||||
|---|---|---|---|---|---|---|---|---|
| Vol | Vbl | Cell osm | [K+] | Max vol | Max cell osm | Max [K+] | ||
| G | +10% | −4.2 | 0.0 | −5.0 | −4.4 | −1.7 | −3.2 | −2.4 |
| −10% | 4.8 | 0.0 | 6.2 | 5.2 | 1.9 | 3.5 | 2.6 | |
| μ | +10% | 6.5 | 0.0 | 8.3 | 7.0 | 2.5 | 4.7 | 3.5 |
| −10% | −6.9 | 0.0 | −8.3 | −7.3 | −3.0 | −5.4 | −4.0 | |
| Kb | +10% | −0.7 | −0.1 | 8.0 | 4.1 | −1.9 | 6.1 | 3.5 |
| −10% | 0.7 | 0.1 | −8.1 | −4.2 | 2.1 | −6.5 | −3.8 | |
To assess the relative importance of cotransporters versus that of basolateral K+ and Cl− channels in RVD when bath [K+] is increased, we performed simulations in which the expression of only one transporter type was adjusted as cell volume changed. Model predictions are summarized in Table 4, columns labeled “no ch” and “no NaBic”. The effectiveness of RVD when bath [K+] is raised can be attributed primarily to changes in cotransporter density. Suppressing changes in K+ and Cl− channel density yielded small changes in steady-state intracellular osmolality, volume, and [K+], even though the basolateral membrane was more depolarized than in the full RVD case.
Isotonic increase in bath solution [K+] followed by decrease in bath osmolality
We then mimicked another experiment performed by Völkl and Lang [28] on perfused proximal tubules from mice. After the cell reached an approximate steady-state following the increase in bath [K+] described above, bath osmolality was decreased by 80 mosm/(kg H2O) by lowering the concentration of mannitol. The predicted cellular responses are shown in Table 4, under “EXP III,” and in Figs. 5 and 6, in the time interval labelled “EXP III.” Consider the case where bath [K+] was increased by 25 mM under isotonic conditions, followed by a 80 mosm/(kg H2O) reduction in osmolality. When the bath solution was diluted, the model cell underwent a transient volume expansion, before settling down to a steady-state volume that was 18% above control when RVD was fully active, and 33% above control without RVD. The change in cell volume predicted by the model with full RVD is similar to the experimental result of Völkl and Lang [28], who observed a 16% increase in cell volume using a similar protocol. When only the density of co-transporters was adjusted, steady-state cell volume was predicted to be 22% above control, similar to the full RVD case. In contrast, when only the density of K+ and Cl− channels was adjusted, RVD was significantly impaired, with steady-state cell volume predicted to be 34% above control, similar to what was obtained without RVD.
Increases in bath solution osmolality
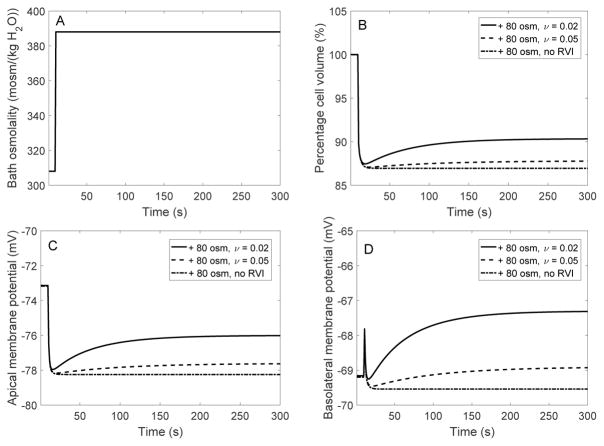
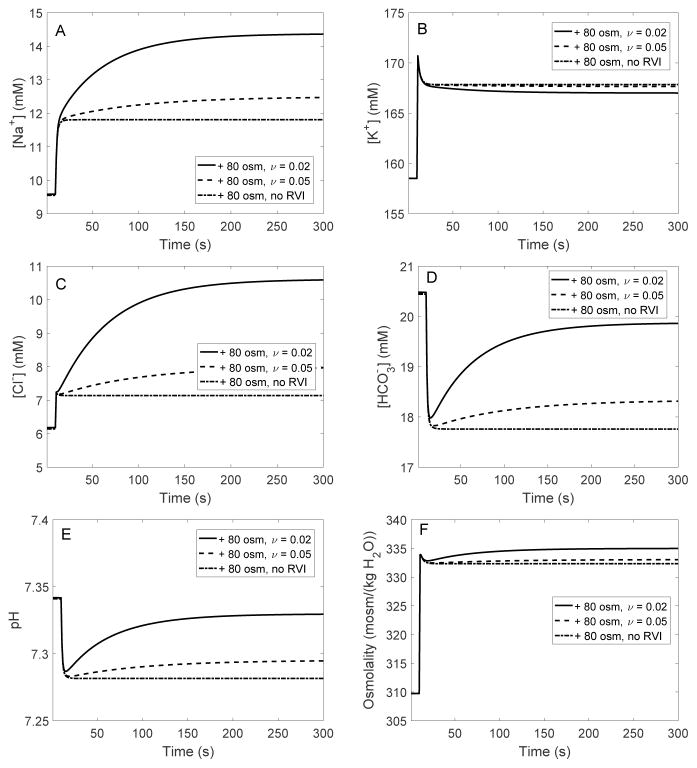
When cells from non-perfused mouse proximal tubules were suddenly exposed to a hypertonic solution with high mannitol, their volume decreased with no subsequent recovery. However, their capacity for RVI was unmasked under specific conditions, in particular when P-gp was fully inhibited or removed [17]. In the absence of P-gp activity, hyperosmotic mannitol activated basolateral Na+/H+ exchangers [18], most likely the ubiquitous isoform NHE1 [1]. To determine whether stimulation of basolateral NHE may indeed account for RVI in proximal tubule cells, we simulated a hypertonic challenge assuming that the membrane expression of the exchanger increases with decreasing cell volume, as given by Eq. 18. When bath osmolality was augmented by 80 and 200 mOsm/(kg H2O), in the absence of RVI cell volume decreased until it was 13 and 25 % lower than control, respectively. These reductions in fractional volume are similar to values measured in non-perfused proximal tubules from rabbits (+80 mOsm/(kg H2O)) [6] and wild-type mice (+200 mOsm/(kg H2O)) [17]. Our model suggests that a hyperosmotic challenge in the absence of RVI induces changes that are the opposite of those induced by a hyposmotic challenge in the absence of RVD: as illustrated in Figures 8 and 9, cell shrinkage raises the intracellular concentrations of most solutes, increases fluid osmolality, and acidifies the cell.
Fig. 8.
EXP IV. Dynamic response of cell volume and membrane potential to a hyperosmotic challenge. A, bath osmolality was increased by 80 mosm/(kg H2O) at time = 10 s. B, cell volume relative to baseline. C, apical membrane potential. D, basolateral membrane potential. Results are shown for 3 cases: in the presence of RVI with ν = 0.02, in the presence of RVI with ν = 0.05, and in the absence of RVI; ν characterizes the activation of basolateral NHE membrane expression.
Fig. 9.
EXP IV. Changes in intracellular [Na+] (A), [K+] (B), [Cl−] (C), [ ] (D), pH (E), and osmolality (F), in response to a hyperosmotic challenge.
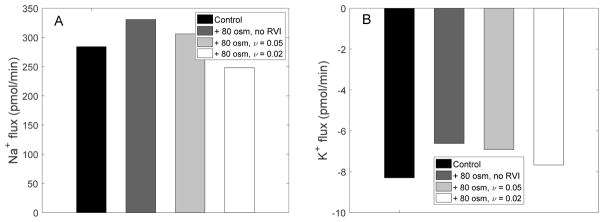
When RVI was active, the model predicted significant volume recovery assuming a large increase in the membrane expression of basolateral NHE. The gain G was fixed at 4.0 (as for RVD), and ν was varied (Eq. 18). With ν set to 0.1 (as for RVD), when bath osmolality was raised by 80 mOsm/(kg H2O), cell volume decreased by 13% and did not recover. With ν set to 0.05, cell volume transiently decreased by 13% before rising slightly and stabilizing at a value 12% below control. With ν set to 0.02, cell volume transiently decreased by 12% and stabilized at a value 10% below control (Fig. 8).
As cell shrinkage upregulated basolateral NHE, intracellular [Na+] increased more than in the absence of RVI (Fig. 9A), and intracellular pH and [ ] recovered partially after their initial decrease (Fig. 9D–E). This in turn increased the flux across the basolateral Na+-dependent exchanger (NDCBE), thereby augmenting Cl− influx into the cell and raising [Cl−] further (Fig. 9C). As a result, the model predicted a more significant increase in intracellular fluid osmolality than in the absence of RVI, which acted to reduce cell shrinkage (Fig. 9F).
The steady-state transcellular fluxes of Na+ and K+ following a hyperosmotic challenge are shown in Figure 10, with and without RVI. When bath fluid osmolality was raised from 320 to 400 mosm/(kg H2O), in the absence of RVI the transcellular reabsorption of Na+ increased by 16%, and the transcellular secretion of K+ decreased by 20%. When RVI was active, K+ secretion diminished less, owing to stimulation of Na+/K+-ATPase transport (following the large increase in intracellular [Na+]). Conversely, Na+ reabsorption increased less, since enhanced Na+ influx via basolateral NHE partly counteracted Na+ efflux across other basolateral Na+ transporters. In fact, when ν was set equal to 0.02, the transcellular Na+ flux was lower than its control (pre-hyperosmotic challenge) value.
Fig. 10.
EXP IV. Steady-state transcellular Na+ and K+ fluxes with and without RVI.
4 Discussion
In this study, we investigated CVR mechanisms in the proximal convoluted tubule of the rat kidney. The proximal convoluted tubule is found within the renal cortex. Whereas interstitial fluid osmolality in the renal medulla may vary several-fold depending on the hydration status of the animal, the composition of the interstitial fluid in the cortex is typically maintained close to that of plasma. Thus, relative to renal medullary epithelial cells, proximal tubular cells are surrounded by a relatively stable interstitial environment. Nonetheless, disturbances in blood osmolality and composition may occur due to hydration, blood loss, hyperglycemia, excessive salt ingestion, and plain water ingestion.
To study the proximal tubule’s responses to cell volume changes, we incorporated CVR into a previously published computational cell model [11]. The model predicts cell volume, intracellular solute concentrations, membrane potentials, and transmembrane solute and water fluxes as a function of time. The proximal tubule cell is assumed to be well-stirred and compliant. In accordance with experimental observations, we assumed that the membrane expression of specific transporters is regulated by cell volume, and we simulated osmotic challenges by varying bath composition. Note that cells have a volume set point, which is defined as the cell volume above or below which transport systems are activated. This set point depends on the functional state of the cell [8]. Since it has been investigated only for a few cells types and transport systems, we did not account for the volume set point in this study.
Proximal tubule cell homeostasis has been analyzed in great detail by Weinstein [29–32], in particular to gain insight into the mechanisms underlying glomerulo-tubular balance, whereby a constant fraction of the filtered load is reabsorbed by the proximal tubule over a range of filtration rates. Using control theory, Weinstein undertook a systematic exploration of a proximal tubule model to identify which membrane transporters, modulated by which cytosolic signals, could enhance Na+ reabsorption without perturbating cell volume and composition. His results suggested that volume-mediated increases in basolateral K+-Cl− or cotransport should preserve cellular volume when luminal Na+ entry is augmented; modulation of basolateral K+ permeability was predicted to be insufficient to maintain cell volume within narrow limits [29,30,32].
In contrast with this optimization approach, in the present work we examined whether reported changes in transporter expression (see below) can explain experimental observations of cell volume regulation following changes in peritubular composition.
Kirk and co-workers perfused rabbit proximal straight tubules ex vivo and observed that the transient cell swelling that followed a hyposmotic challenge was completely reversed via cell volume regulatory mechanisms [9,10]. The rate of RVD was reduced by maneuvers that attenuate the K+ electrochemical potential gradient across the basolateral membrane [9], providing evidence to support the role of K+ dumping. Beck et al. demonstrated in rabbit proximal convoluted tubules that hyposmotic shock increases the basolateral K+ conductance [4]. Breton et al. showed, also in rabbit proximal convoluted tubules, that RVD activates the basolateral conductances of both K+ and Cl− [5]. Völkl and Lang perfused proximal straight tubules of mouse kidney and reported time-dependent changes in cell volume when bath osmolality or [K+] was changed [28]. Their observations, including the finding that RVD is impaired in the absence of extracellular , strongly suggested that co-transport is also involved in cell volume regulation [26,27]. More recent experiments on isolated mouse proximal tubule cells have confirmed the role of K+ and Cl− channels in RVD, and shown more specifically the implication of TASK2 K+ channels [2,3].
As noted above, the proximal tubule cell model used in this study is based on the rat kidney. Unfortunately, the mechanisms of cell volume regulation have not been studied in the rat proximal tubule. RVD measurements are available for rabbits and mice (see above). Given the key physiological differences between rabbits and rodents (e.g., the former are herbivorous), we chose to fit our model parameters using the data obtained by Völkl and Lang in mouse proximal tubules [28]. Our results suggest that adjusting the membrane expression of basolateral K+ and Cl− channels and that of cotransporters in response to cell swelling is sufficient to match experimentally observed RVD responses in mice.
We assumed in this study that the conductances of basolateral K+ and Cl− channels exhibit the same dependence on cell volume (Eqs. 12–13). Under normal conditions, the basolateral Cl− conductance is very small relative to the basolateral K+ conductance [25,34]. It has been postulated that Cl− channels may in fact be inactive at certain cell volume levels and activated by cell swelling [25,34]. In the rabbit proximal tubule, a hypotonic challenge increased both the absolute and the fractional basolateral Cl− conductances [35]. It is possible that in the rat proximal tubule as well, cell swelling raises the basolateral Cl− conductance more than the basolateral K+ conductance.
According to our simulations, increasing cotransport is a more efficient RVD mechanism than increasing basolateral K+ and Cl− conductances. Likewise, Weinstein predicted that modulation of basolateral K+ permeability does not, per se, significantly blunt challenges to cell volume [30]. Our results suggest that volume-mediated increases in basolateral K+ and Cl− conductances may serve to stabilize membrane potential; indeed, they counteract the basolateral membrane depolarization that would otherwise result from enhanced efflux across cotransporters, as shown in Tables 2 and 4.
As described in the Introduction, the response of proximal tubules cells to increases in bath osmolality varies between studies. Whether RVI is observed depends on the solute that is added to the external solution (e.g., mannitol versus NaCl), on the rapidity of the change in external osmolality [6,14,15], as well as, at least in mouse cells, on the activity of P-gp [17]. Even though gradual variations in external osmolality may be more physiological [15], we focused here on the impact of rapid changes given the availability of mouse data under such conditions [17]. Model results indicate that RVI may be achieved through activation of basolateral Na+/H+ exchangers, as suggested by the experimental observations of Miyata et al. [18].
It should be noted that the model cell exhibited a significant RVI response only when we assumed that cell shrinkage elicits a very large (~ 100-fold) increase in the expression of basolateral NHE. This is not surprising, given that at steady-state the Na+ flux across basolateral NHE is 10–100 times lower than Na+ fluxes across apical NHE3, basolateral cotransporters, and NDCBE. It would be more efficient for the cell to upregulate NHE3. Our simulations suggest that if peritubular osmolality were raised by 80 mOsm/(kg H2O), a 5-fold increase in the membrane expression of NHE3 would restore cell volume to 6% of its control value; in contrast, the same volume target requires a 500-fold increase in basolateral NHE expression. Nevertheless, many studies (reviewed in Ref. [8]) have shown that NHE3 is in fact inhibited by cell shrinkage and conversely stimulated by cell swelling in different types of epithelial cells. However, the volume sensitivity of NHE3 in rat proximal tubule cells has not been specifically examined, to our knowledge.
Our model suggests that cell volume regulatory mechanisms stabilize transcellular Na+ fluxes. In the absence of RVD, a hyposmotic challenge induces water entry, thereby lowering intracellular [Na+] (Fig. 3A) and transcellular Na+ reabsorption (Fig. 4A). RVD limits water entry and variations in intracellular [Na+] when bath osmolality is decreased, thereby stabilizing net transcellular Na+ transport (Figs. 3A and 4A). Weinstein similarly found that modulation of cotransport blunts increases in cell volume without reducing Na+ reabsorption [30]. Conversely, in the absence of RVI, a hyperosmotic challenge elicits cell shrinkage, which raises intracellular [Na+] and transcellular Na+ reabsorption. RVI enhances basolateral Na+ entry into the cell, which further raises intracellular Na+ (Fig. 9A) but counteracts basolateral Na+ efflux, thereby reducing net transcellular Na+ transport. The proximal tubule is responsible for reabsorbing two-thirds of the filtered loads of salt and water. Thus, changes in salt and water transport along this segment (other than variations due to glomerulo-tubular balance) would likely have a drastic impact on water and solute delivery to downstream segments, as well as urine excretion. However, it must be noted that changes in transport along the upper portion of the proximal tubule might be partially compensated by variations in transport along the downstream portion of the segment. Thus, the overall impact of CVR on whole-nephron transport and urinary excretion would be more accurately assessed using computational models of the entire proximal tubule (e.g., [11]) and of the whole nephron (e.g., [12,13]).
We represented here short-term adjustments to changes in cell volume. Cells adapt to long-term volume perturbations by regulating the uptake and synthesis of organic (non-ionic) osmolytes, thereby avoiding prolonged and non-physiological changes in intracellular ionic concentrations [22]. Long-term exposure to hypertonic conditions stimulates the transcription of osmoregulatory genes that code for transporters of organic osmolytes such as amino acids (e.g., taurine), polyalcohols (e.g., sorbitol), and methylamines, as well for enzymes involved in the metabolism of these osmolytes. Organic osmolytes play a key role in the renal medulla, where the osmolality of the interstitial and tubular fluids can be as high as 5 times that of plasma.
Acknowledgments
This research was supported by the National Institutes of Health, National Institute of Diabetes and Digestive and Kidney Diseases, via grant R01DK106102 to AT Layton.
Contributor Information
Aurélie Edwards, Department of Biomedical Engineering, Boston University, Boston, MA 02215, USA.
Anita T. Layton, Departments of Mathematics and Biomedical Engineering, Duke University, Durham, NC 27708-0320, USA
References
- 1.Azuma K, Balkovetz D, Magyar C, Lescale-Matys L, Zhang Y, Chambrey R, Warnock D, McDonough A. Renal Na+/H+ exchanger isoforms and their regulation by thyroid hormone. Am J Physiol Renal Physiol. 1996;270:C585–C592. doi: 10.1152/ajpcell.1996.270.2.C585. [DOI] [PubMed] [Google Scholar]
- 2.Barrière H, Belfodil R, Rubera I, Tauc M, Lesage F, Poujeol C, Guy N, Barhanin J, Poujeol P. Role of TASK2 potassium channels regarding volume regulation in primary cultures of mouse proximal tubules. The Journal of General Physiology. 2003;122(2):177–190. doi: 10.1085/jgp.200308820. [DOI] [PMC free article] [PubMed] [Google Scholar]
- 3.Barrière H, Rubera I, Belfodil R, Tauc M, Tonnerieux N, Poujeol C, Barhanin J, Poujeol P. Swelling-activated chloride and potassium conductance in primary cultures of mouse proximal tubules. implication of KCNE1 protein. The Journal of Membrane Biology. 2003;193(3):153–170. doi: 10.1007/s00232-003-2014-z. [DOI] [PubMed] [Google Scholar]
- 4.Beck J, Breton S, Giebisch G, Laprade R. Potassium conductance regulation by pH during volume regulation in rabbit proximal convoluted tubules. Am J Physiol Renal Physiol. 1992;263:F453–F458. doi: 10.1152/ajprenal.1992.263.3.F453. [DOI] [PubMed] [Google Scholar]
- 5.Breton S, Marsolais M, Lapointe JY, Laprade R. Cell volume increases of physiologic amplitude activate basolateral K and Cl conductances in the rabbit proximal convoluted tubule. J Am Soc Nephrol. 1996;7(10):2072–2087. doi: 10.1681/ASN.V7102072. [DOI] [PubMed] [Google Scholar]
- 6.Gagnon J, Ouimet D, Nguyen H, Laprade R, Grimellec CL, Carriere S, Cardinal J. Cell volume regulation in the proximal convoluted tubule. Am J Physiol Renal Physiol. 1982;243:F408–F415. doi: 10.1152/ajprenal.1982.243.4.F408. [DOI] [PubMed] [Google Scholar]
- 7.Hoffman E, Dunham P. Membrane mechanisms and intracellular signalling in cell volume regulation. Int Rev Cytol. 1995;161:173–262. doi: 10.1016/s0074-7696(08)62498-5. [DOI] [PubMed] [Google Scholar]
- 8.Hoffman E, Lambert I, Pedersen S. Physiology of cell volume regulation in vertebrates. Physiol Rev. 2009;89:193–277. doi: 10.1152/physrev.00037.2007. [DOI] [PubMed] [Google Scholar]
- 9.Kirk K, DiBona D, Schafer J. Regulatory volume decrease in perfused proximal nephron: Evidence for a dumping of cell K+ Am J Physiol Renal Physiol. 1987;252:F933–F942. doi: 10.1152/ajprenal.1987.252.5.F933. [DOI] [PubMed] [Google Scholar]
- 10.Kirk K, Schafer J, DiBona D. Parallel activation of K+ and Cl− channels. Am J Physiol Renal Physiol. 1987;252:F922–F932. [Google Scholar]
- 11.Layton A, Vallon V, Edwards A. Modeling oxygen consumption in the proximal tubule: effects of NHE and SGLT2 inhibition. Am J Physiol Renal Physiol. 2015;308(12):F1343–F1357. doi: 10.1152/ajprenal.00007.2015. [DOI] [PMC free article] [PubMed] [Google Scholar]
- 12.Layton A, Vallon V, Edwards A. A computational model for simulating solute transport and oxygen consumption along the nephron. Am J Physiol Renal Physiol. 2016;311:F1378–F1390. doi: 10.1152/ajprenal.00293.2016. [DOI] [PMC free article] [PubMed] [Google Scholar]
- 13.Layton A, Vallon V, Edwards A. Predicted consequences of diabetes and SGLT inhibition on transport and oxygen consumption along a rat nephron. Am J Physiol Renal Physiol. 2016;310(11):F1269–F1283. doi: 10.1152/ajprenal.00543.2015. [DOI] [PMC free article] [PubMed] [Google Scholar]
- 14.Lohr J, Grantham J. Isovolumetric regulation of isolated S2 proximal tubules in anisotonic media. J Clin Invest. 1986;78:1165–1172. doi: 10.1172/JCI112698. [DOI] [PMC free article] [PubMed] [Google Scholar]
- 15.Lohr J, Sullivan L, Jr, Grantham ECJ. Volume regulation determinants in isolated proximal tubules in hypertonic medium. Am J Physiol Renal Physiol. 1989;256:F622–F631. doi: 10.1152/ajprenal.1989.256.4.F622. [DOI] [PubMed] [Google Scholar]
- 16.Mignen O, Le Gall C, Harvey B, Thomas S. Volume regulation following hypotonic shock in isolated crypts of mouse distal colon. J Physiol. 1999;515(2):501–510. doi: 10.1111/j.1469-7793.1999.501ac.x. [DOI] [PMC free article] [PubMed] [Google Scholar]
- 17.Miyata Y, Asano Y, Muto S. Effects of P-glycoprotein on cell volume regulation in mouse proximal tubule. Am J Physiol Renal Physiol. 2001;280:F829–F837. doi: 10.1152/ajprenal.2001.280.5.F829. [DOI] [PubMed] [Google Scholar]
- 18.Miyata Y, Asano Y, Muto S. Hyperosmotic mannitol activates basolateral NHE in proximal tubule from P-glycoprotein null mice. Am J Physiol Renal Physiol. 2002;282:F718–F729. doi: 10.1152/ajprenal.00183.2001. [DOI] [PubMed] [Google Scholar]
- 19.Miyata Y, Okada K, Ishibashi S, Asano Y, Muto S. P-gp-induced modulation of regulatory volume increase occurs via PKC in mouse proximal tubule. Am J Physiol Renal Physiol. 2002;282:F65–F76. doi: 10.1152/ajprenal.0036.2001. [DOI] [PubMed] [Google Scholar]
- 20.Moeendarbary E, Valon M, Fritzsche M, Harris A, Moulding D, Thrasher A, Stride E, Mahadevan L, Charras G. The cytoplasm of living cells behaves as a poroelastic material. Nat Mater. 2013;12:253–261. doi: 10.1038/nmat3517. [DOI] [PMC free article] [PubMed] [Google Scholar]
- 21.Mohandas N, Evans E. Mechanical properties of the red cell membrane in relation to molecular structure and genetic defects. Annu Rev Biophys Biomol. 1994;23:787–818. doi: 10.1146/annurev.bb.23.060194.004035. [DOI] [PubMed] [Google Scholar]
- 22.Okada Y. Ion channels and transporters involved in cell volume regulation and sensor mechanisms. Cell Biochemistry Biophysics. 2004;41:233–258. doi: 10.1385/CBB:41:2:233. [DOI] [PubMed] [Google Scholar]
- 23.Sachs F, Sivaselvan M. Cell volume control in three dimensions: Water movement without solute movement. The Journal of General Physiology. 2015:373–380. doi: 10.1085/jgp.201411297. [DOI] [PMC free article] [PubMed] [Google Scholar]
- 24.Sands J, Layton H. The urine concentrating mechanism and urea transporters. In: ARJ, HSC, editors. Seldin and Giebisch’s The Kidney: Physiology and Pathophysiology. 4. Elsevier; New York: 2008. pp. 1143–1178. [Google Scholar]
- 25.Schild L, Aronson P, Giebisch G. Basolateral transport pathways for K+ and Cl− in rabbit proximal tubule: effects on cell volume. Am J Physiol (Renal Fluid Electrolyte Physiol 12) 1991;260:F101–F109. doi: 10.1152/ajprenal.1991.260.1.F101. [DOI] [PubMed] [Google Scholar]
- 26.Völkl H, Lang F. Electrophysiology of cell volume regulation in proximal tubules of the mouse kidney. Pflugers Archives. 1988;411:514–519. doi: 10.1007/BF00582372. [DOI] [PubMed] [Google Scholar]
- 27.Völkl H, Lang F. Ionic requirement for regulatory cell volume decrease in renal straight proximal tubules. Pflugers Archives. 1988;412:1–6. doi: 10.1007/BF00583723. [DOI] [PubMed] [Google Scholar]
- 28.Völkl H, Lang F. Effect of potassium on cell volume regulation in renal straight proximal tubules. J Membrane Biol. 1990;117:113–122. doi: 10.1007/BF01868678. [DOI] [PubMed] [Google Scholar]
- 29.Weinstein A. Coupling of entry to exit by peritubular K+ permeability in a mathematical model of rat proximal tubule. Am J Physiol Renal Physiol. 1996;271:F158–F168. doi: 10.1152/ajprenal.1996.271.1.F158. [DOI] [PubMed] [Google Scholar]
- 30.Weinstein A. Modeling epithelial cell homeostasis: steady-state analysis. Bull Math Biol. 1999;61:1065–1091. doi: 10.1006/bulm.1999.0127. [DOI] [PubMed] [Google Scholar]
- 31.Weinstein A. Modeling epithelial cell homeostasis: accessing recovery control mechanisms. Bull Math Biol. 2004;66:1201–1240. doi: 10.1016/j.bulm.2003.12.002. [DOI] [PubMed] [Google Scholar]
- 32.Weinstein A, Sontag E. Modeling proximal tubule cell homeostasis: tracking changes in luminal flow. Bull Math Biol. 2009;71:1285–1322. doi: 10.1007/s11538-009-9402-1. [DOI] [PMC free article] [PubMed] [Google Scholar]
- 33.Weinstein A, Weinbaum S, Duan Y, Du ZP, Yan QS, Wang T. Flow-dependent transport in a mathematical model of rat proximal tubule. Am J Physiol Renal Physiol. 2007;292:F1164–F1181. doi: 10.1152/ajprenal.00392.2006. [DOI] [PubMed] [Google Scholar]
- 34.Welling P, Linshaw M. Importance of anion in hypotonic volume regulation of rabbit proximal straight tubule. Am J Physiol Renal Physiol. 1988;255:F853–F860. doi: 10.1152/ajprenal.1988.255.5.F853. [DOI] [PubMed] [Google Scholar]
- 35.Welling P, O’Neil R. Cell swelling activates basolateral membrane Cl and K conductances in rabbit proximal tubule. Am J Physiol Renal Physiol. 1990;258(4):F951–F962. doi: 10.1152/ajprenal.1990.258.4.F951. [DOI] [PubMed] [Google Scholar]
- 36.Zarogiannis S, Ilyaskin A, Baturina G, Katkova L, Medvedev D, Karpov D, Ershov A, Solenov E. Regulatory volume decrease of rat kidney principal cells after successive hypo-osmotic shocks. Mathematical Biosciences. 2013;244:176–187. doi: 10.1016/j.mbs.2013.05.007. [DOI] [PubMed] [Google Scholar]


