

Abstract
Plasma amyloid-β (Aβ) levels have been proposed as biomarkers of Alzheimer’s disease (AD), but studies have produced inconsistent results. We present a meta-analytic review of cross-sectional studies that examined plasma Aβ levels in AD and cognitively normal subjects, and longitudinal studies that used baseline plasma Aβ levels to predict conversion from normal cognition to AD. Medline and EMBASE databases were searched to generate an initial list of relevant studies, and selected authors approached for additional data. Twelve cross- sectional studies (n = 1483) and seven longitudinal (n = 3920) met the inclusion criteria for meta-analysis. Random effects model was used to calculate the weighted mean difference (WMD) by Review Manager Version 4.2. In longitudinal studies, cognitively normal individuals who converted to AD had higher baseline Aβ1-40 and Aβ1-42 levels (WMD: 10.29, z = 3.80, p = 0.0001 and WMD: 8.01, z = 2.76, p = 0.006, respectively), and non-significantly increased Aβ1-42/Aβ1-40 ratio (WMD: 0.03, z = 1.65, p = 0.10). In cross sectional studies, compared to cognitively normal individuals, AD patients had marginally but non-significantly lower Aβ1-42 levels (WMD:−2.84, z = 1.73, p = 0.08), but Aβ1-40 levels were not significantly different (WMD: 3.43, z = 0.40, p = 0.69). Our systematic review suggests a model of differential longitudinal changes in plasma Aβ levels in cognitively stable individuals versus those who go on to develop AD dementia. Baseline Aβ1-40 and Aβ1-42 levels in cognitively normal elderly individuals might be predictors of higher rates of progression to AD, and should be further explored as potential biomarkers.
Keywords: Alzheimer’s disease, amyloid-β, meta-analysis, plasma
INTRODUCTION
Alzheimer’s disease (AD) is the most common cause of dementia and is generally diagnosed in old age. Pathophysiological changes of AD, however, start many years and possibly even decades before cognitive impairment becomes clinically apparent [1, 2]. The amyloid cascade hypothesis is currently the dominant explanation of AD etiology. This hypothesis suggests that a chronic imbalance between production and clearance of the amyloid-β (Aβ) peptide results in plaque deposition [3]. Markers of abnormal Aβ processing may therefore represent early, and even preclinical, markers of AD, especially the more pathogenic 42-amino-acid isoform Aβ1-42.
There is growing evidence that low Aβ1-42 in cere-brospinal fluid (CSF) could be a biomarker for the diagnosis of AD. Several studies have consistently shown that the concentration of Aβ1-42 in CSF is low in AD patients compared with healthy controls [4–7]. A meta-analysis of CSF studies showed that levels of Aβ1-42 were significantly lower in AD [6] and this change was also related to the conversion from mild cognitive impairment (MCI) to AD [8, 9].
Plasma sampling is simpler and less invasive than a lumbar puncture, and particularly well suited to use in aging samples or when multiple measures are required, such as in clinical trials. However, the published data on plasma Aβ levels in AD is conflicting. In cross-sectional studies, plasma Aβ levels of AD have been reported to be higher, lower, or unchanged, and there are few large-scale longitudinal studies that relate plasma Aβ to the prospective risk of dementia. To our knowledge, no meta-analysis of plasma Aβ levels in AD has been completed. We therefore performed a meta-analysis to examine: 1) whether plasma Aβ levels were significantly different between AD and cognitively normal subjects in cross-sectional studies, and 2) whether baseline plasma Aβ levels were associated with conversion from cognitively normal to incident AD in longitudinal studies.
METHODS
Data sources
A systematic literature search of MEDLINE, EMBASE, the Cochrane Library, and Psychoinfo was conducted for studies published in the period from January 1989 to July 2010. Our search strategy included the Medical Subject Headings (MeSH) and text keywords: amyloid beta protein or amyloid beta, plasma and Alzheimer’s disease. It generated a total of 119 articles. Abstracts were reviewed, and a large number of these were excluded on the grounds of covering an irrelevant topic or lacking original data. The remaining thirty four studies underwent further assessment for suitability. Two reviewers (F.S. and A.P.) independently collected data, and data disagreement was resolved through discussion. Where additional information was required, the corresponding authors were contacted for clarification or additional data. Of the seven studies for which the corresponding author was contacted, authors of five studies replied with relevant data and information [10–14].
Study selection
We chose to focus on AD and excluded studies of any other type of dementia. For longitudinal studies, we chose those studies with cognitively normal subjects at the baseline with progression to AD. A study was included if it met the following criteria:
Provided detailed procedure and criteria for the diagnosis of AD.
Total number of participants >30.
Reported Mean, Standard Deviation (SD) or Standard Error (SE) on plasma Aβ1-40, Aβ1-42 levels.
If cross-sectional, the study provided both control and AD Aβ levels.
If longitudinal, the study provided information about conversion to AD from a baseline of cognitively normal status.
Included both males and females.
Did not include studies of familial AD.
Twelve cross sectional and seven longitudinal studies met the inclusion criteria and were used in this meta-analysis. If a study fulfilled all inclusion criteria but did not report all relevant data, we contacted the authors to obtain the additional data. (For data details, see Tables 1, 2).
Table 1.
Cross sectional studies used for the meta-analysis
| Study | Diagnosis (n) | Age |
APOE ε4 (%) |
Plasma Aβ1-40 (pg/ml) |
Plasma Aβ1-42 (pg/ml) |
Aβ1-42/1-40 | Aβ1-40/1-42 | Methods | Fasting type (anticoagulation, storage) |
|---|---|---|---|---|---|---|---|---|---|
| Buerger 2009 [15] | Control (15) | 70.2 ±10.6¶ | 46.7 | 208 ± 52 | 24 ± 7 | Aβ1-40 (ELISA, The Genetics Company, Switzerland) | N/A (EDTA, −80°C) | ||
| AD (17) | 52.9 | 166 ± 42 | 20 ± 8 | Aβ1-42 (ELISA, Innogenetics, Ghent, Belgium) | |||||
| Roher 2009 [11] | Control (21) | 75.8 ± 7.1 | 47.6 | 344.41 ± 132.43 | 124.71 ± 42.34 | 0.44 ± 0.30 | Aβ1-40 (ELISA, Immunobiological Laboratories, Minneapolis, MN) | Fasting (N/A) | |
| AD (17) | 81.4 ± 5.3 | 64.7 | 424.06 ± 147.73 | 139.91 ± 77.82 | 0.16 ± 0.29 | Aβ1-42 (ELISA, Innogenetics, Ghent, Belgium) | |||
| Giedraitis 2007 [16] | Control (18) | 65.9 ± 8.6 | 27.8 | 280.1 ± 73.5* | 114.7 ± 124.6* | Aβ1-40 (antibody:BNT77/ BA27) | N/A (heparin, −80°C) | ||
| AD (39) | 65.9 ± 7.9 | 44.9 | 260.2 ± 56.6* | 97.5 ± 86.2* | Aβ1-42 (antibody:BNT77/BC05) (ELISA, Takeda Pharmaceuticals, Osaka, Japan) | ||||
| Abdullah 2007 [17] | Control (146) | 74.15 ± 0.69 | N/A | 80.66 ± 22.47† | 5.66 ± 3.75† | 0.06 ± 0.006† | Aβ1-40, Aβ1-42 (ELISA, Invitrogen, CA, USA) | N/A (EDTA, −80°C) | |
| AD (67) | 76.16 ± 0.96 | 103.38 ± 34.95† | 4.53 ± 4.26† | 0.05 ± 0.008† | |||||
| Fagan 2007 [18] | Control (65) | 73.3 ± 8.4 | 32 | 191 ± 61.3 | 36 ± 29.4 | 8.64 ± 8.9 | Aβ1-40 (antibody: m266/m2G3, ELISA)€ | Fasting (EDTA, −84°C) | |
| AD (16) | 75.2 ± 5.8 | 37 | 214 ± 90.3 | 36 ± 37.2 | 9.25 ± 7.0 | Aβ1-42 (antibody: m266/m21F12, ELISA) | |||
| Kulstad 2006 [19] | Control (50) | 70.5 ± 1.1 | N/A | 502.7 ± 248.9† | 41.8 ± 25.46† | Aβ1-40, Aβ1-42(ELISA, Signet Laboratories, Dedham, MA) | Fasting (N/A) | ||
| AD (59) | 71.4 ± 1.0 | 567.3 ± 268.1† | 31.2 ± 25.35† | ||||||
| Sobow 2005 [20] | Control (35) | 75.0 ± 2.9 | N/A | 160.1 ± 15.2 | 36.3 ± 6.3 | 4.5 ± 0.6 | Aβ1-40, Aβ1-42(ELISA, BioSource Intl, Inc) | Fasting (EDTA, −70°C) | |
| AD (54) | 77.5 ± 4.4 | 168.7 ± 32.2 | 37.8 ± 10.3 | 4.6 ± 0.9 | |||||
| Fukumoto 2003 [21] | Control (92) | 69.4 ± 10.3 | 1.1 | 211.4 ± 74.4* | 31.6 ± 14.0* | Aβ1-40(antibody:BNT77/ BA27) | N/A (EDTA, −80°C) | ||
| AD (146) | 76.0 ± 8.2 | 3.8 | 226.5 ± 75.7* | 33.4 ± 24.4* | Aβ1-42(antibody:BNT77/BC05) (ELISA, Takeda Pharmaceuticals, Osaka,Japan) | ||||
| Arvanitakis 2002 [22] | Control (59) | 74.9 ± 7.8 | N/A | 774.7 ± 722.4* | 85.3 ± 88.5* | Aβ1-40(antibody:BAN50/BA27, ELISA) € | N/A | ||
| AD (220) | 77.7 ± 7.6 | 984.8 ± 1042.3* | 92.5 ± 106.1* | Aβ1-42 (antibody:BAN50/BC05, ELISA) | |||||
| Kosaka 1997 [23] | Control (15) | 72.3 | N/A | 335.5 ± 42.4* | 48.3 ± 9.5* | Aβ1-40(antibody:BNT77/ BA27, ELISA) € | N/A (EDTA, −80°C) | ||
| AD (44) | 71.9 | 297.0 ± 47.6* | 44.2 ± 14.9* | Aβ1-42(antibody:BNT77/BC05, ELISA) | |||||
| Tamaoka 1996 [24] | Control (25) | 64.5 ± 9.20 | N/A | 296.5 ± 91.2* | 194.6 ± 115.1* | Aβ1-40(antibody:BAN50/BA27, ELISA) € | Fasting (Sodium azide & PMSF/ −20°C) | ||
| AD (28) | 73.8 ± 8.97 | 305.2 ± 181.9* | 276.7 ± 182.8* | Aβ1-42 (antibody:BAN50/BC05, ELISA) | |||||
| Pesaresi 2006 [13] | Control (89) | 68.23 ± 12.08 | 5.5 | 52.30 ± 29.59** | INNOTEST Aβ1-42 (ELISA, Innogenetics, Ghent, Belgium) | N/A (EDTA, −80°C) | |||
| AD (146) | 73.76 ± 7.62 | 29.09 | 38.05 ± 13.92** | ||||||
Data are presented as Mean ± SD;
For ease of comparison all Aβ values were expressed in pg/mL. pM or pmol/L values were converted using molecular weight values of 4323 g/mol for Aβ1-40 and 4514 g/mol for Aβ1-42;
SD (standard deviation) was calculated from SE (standard error);
Mean and SD values were obtained from corresponding authors at our request;
No commercial information is presented about antibodies in methods of articles; N/A The relevant information is not published in articles;
mean age for the whole study; EDTA, Ethylenediaminetetraacetic acid; PMSF, phenylmethylsulfonyl fluoride.
Table 2.
Characteristics of the longitudinal studies used for meta-analysis
| Study | Follow-up months |
Diagnosis (n) | Baseline age |
APOE ε4 (%) |
Baseline Aβ1-40 (pg/ml) |
Baseline Aβ1-42 (pg/ml) |
Baseline Aβ1-42/Aβ1-40 |
Methods | Fasting type (anticoagulation, storage) |
|---|---|---|---|---|---|---|---|---|---|
| Cosentino 2010 [28] | 54 | Normal-to-AD (70) | 80.84 ± 6.98 | 29 | 73.41 ± 50.69 | 37.59 ± 18.16 | 0.70 ± 0.76 | Aβ1-40 (6E10/R162 antisera, ELISA)€ | N/A (EDTA, N/A) |
| Remaining normal (481) | 74.52 ± 5.37 | 26 | 63.11 ± 43.97 | 0.62 ± 18.02 | 0.63 ± 0.48 | Aβ1-42 (6E10/R165 antisera, ELISA) | |||
| Lambert 2009 [10] | 48 | Normal-to-Dementia (233)|| | 77.9 ± 5.6 | 18.2 | 243.7 ± 51.9 | 38.8 ± 9.6 | 0.163 ± 0.041 | INNO-BIA multiplex kit (Innogenetics, Ghent, Belgium) | Non- Fasting (EDTA, −80°C) |
| Normal-to-AD (154)** | 241.8 ± 50.9** | 38.7 ± 9.8** | 0.163 ± 0.041** | ||||||
| Remaining normal (985) | 73.8 ± 5.3 | 10.4 | 233.3 ± 49.9 | 39.3 ± 9.8 | 0.173 ± 0.046 | ||||
| Schupf 2008 [25] | 55.2 | Normal-to-AD (104) | 80.7 ± 7.0* | 27.2 | 87.2 ± 55.07* | 42.2 ± 29.57* | 0.64 ± 0.61* | Aβ1-40 (6E10/R162 antisera, ELISA) € | N/A (EDTA, N/A) |
| Remaining normal (1021) | 76.3 ± 6.1* | 26.3 | 79.6 ± 60.7* | 37.3 ± 24.60* | 0.6 ± 0.32* | Aβ1-42 (6E10/R165 antisera, ELISA) | |||
| Lopez 2008 [26] | 54 | Normal-to-AD (55) | 80.2 ± 3.6 | 31 | 161.4 ± 55.6 | 24.5 ± 16.0 | 0.14 ± 0.07 | 6E10/antisera (ELISA, Ana Spec, San Jose, CA) | Fasting (EDTA, −70°C) |
| Remaining normal (117) | 78.6 ± 3.6 | 20 | 142.1 ± 59.7 | 17.3 ± 13.4 | 0.11 ± 0.06 | ||||
| Blasko 2008 [12] | 30 | Normal-to-AD (55) | N/A | 68.39 ± 157.08** | INNOTEST (ELISA Innogenetics, Ghent, Belgium) | N/A (EDTA, −80°C) | |||
| Remaining normal (117) | N/A | 33.41 ± 65.43** | |||||||
| Mayeux 2003† [14] | 60 | Normal-to-AD (86) | 79.3 ± 6.6 | 32.1 | 136.2 ± 46.7 | 76.5 ± 59.8 | 0.61 ± 0.53 | Aβ1-40 (6E10/R162 antisera, ELISA) € | N/A (N/A, −70°C) |
| Remaining normal (365) | 75.5 ± 5.9 | 26.7 | 133.3 ± 61.9 | 58.8 ± 32.9 | 0.48 ± 0.3 | Aβ1-42 (6E10/R165 antisera, ELISA) | |||
| Mayeux 1999† [27] | 43.2 | Normal-to-AD (64) | 77.4 ± 5.9 | N/A | 134.70 ± 46.40* | 82.4 ± 68.8* | 0.67 ± 0.56* | Aβ1-40 (6E10/R162 antisera, ELISA)€ | N/A (N/A, −70°C) |
| Remaining normal (105) | 73.4 ± 5.3 | N/A | 111.8 ± 44.06* | 51.5 ± 42.01* | 0.51 ± 0.41* | Aβ1-42 (6E10/R165 antisera, ELISA) |
Data are presented as Mean ± SD;
SD (standard deviation) was calculated from SE (standard error).
Authors confirmed that there were no overlapping data in studies of Mayeux 1999 and Mayeux 2003.
In the study of Lambert 2009, 233 incident dementia patients included 154 AD, 46 with mixed or pure vascular dementia, and 33 other dementia.
Mean and/or SD values were obtained from corresponding authors; N/A relevant information is not presented by authors. EDTA, Ethylenediaminetetraacetic acid.
Statistical analysis
Statistical analysis was performed using weighted mean difference (WMD) methodology in Review Manager (Version 4.2 for Windows. Copenhagen, Denmark: The Nordic Cochrane Centre, the Cochrane Collaboration, 2003). The Random effects model was used to calculate the overall effect. WMD is the pooled difference between disease and control groups on mean values across a group of studies using the same scale of measurement for the outcome. For cross-sectional studies, the meta-analysis compared WMD between the AD subject group and the cognitively normal group. For longitudinal studies, WMD of baseline Aβ levels was calculated between individuals who converted to AD and those who remained normal. We also analyzed data using standardized mean difference (SMD) which the difference between two estimated means divided by an estimate of the standard deviation, and compared the results of WMD and SMD. Publication bias was investigated using funnel plots, with a roughly symmetrical funnel plot suggesting a lack of bias. If a plot does not resemble an inverted funnel, it usually suggests a publication bias. As discussed below however, other factors may result in an asymmetrical plot.
RESULTS
Included studies
Twelve cross sectional studies presented Aβ1-42 levels for AD and cognitively normal subjects, and eleven provided Aβ1-40 levels [11, 13, 15–24]. Only two studies provided the Aβ1-42/Aβ 1−40 ratio [11, 17], and two presented the Aβ1-40/Aβ1-42 ratio [18, 20]. Seven longitudinal studies provided data on baseline Aβ1-42 levels on subjects with incident AD who converted from cognitively normal; and six of the seven studies also presented Aβ1-40 and Aβ1-42/Aβ1-40 ratios [10,12, 14, 25–28]. Further details of included studies are provided in Tables 1, 2.
Aβ levels of AD and cognitively normal control subjects in cross-sectional studies
Overall, there was no significant difference in Aβ1-40 levels between AD and cognitively normal control subjects (WMD: 3.43, 95%CI: [−13.33, 20.19], z = 0.40, p = 0.69; SMD: 0.12, 95%CI: [−0.14, 0.39], z = 0.91, p = 0.36) (Fig. 1A). Compared to controls, AD subjects had a marginally lower Aβ1-42 level (WMD: −2.84, 95%CI: [−6.06, 0.38], z = 1.73, p = 0.08; SMD: −0.12, 95%CI: [−0.32, 0.09], z = 1.14, p = 0.26) (Figure 1B). Only two studies provided data on the Aβ1-42/Aβ1-40 ratio, therefore a meta-analysis was not conducted on this measure.
Fig. 1.

Forest plots for plasma Aβ1-40 and Aβ1-42 levels in AD and cognitively normal control subjects in cross-sectional studies.
Baseline Aβ levels in longitudinal studies
Compared with subjects who remained cognitively normal upon follow up, normal-to-AD converters had significantly higher baseline Aβ1-40 levels (WMD: 10.29, 95%CI: [4.98, 15.61], z = 3.80, p = 0.0001; SMD: 0.2, 95%CI: [0.09, 0.31], z = 3.57, p = 0.0004) (Fig. 2A) as well as baseline Aβ1-42 levels (WMD: 8.01, 95%CI: [2.32, 13.70], z = 2.76, p = 0.006; SMD: 0.33, 95%CI: [0.14, 0.52], z = 3.43, p = 0.0006) (Fig. 2B), but Aβ1-42/ Aβ1-40 ratios showed no significant difference (WMD: 0.03, 95%CI: [−0.01, 0.07], z = 1.65, p = 0.10; SMD: 0.18, 95%CI: [−0.03, 0.40], z = 1.67, p = 0.09) (Fig. 2C). The differences of baseline Aβ1-40 and Aβ1-42 levels between normal-to-AD converters and non-converters were moderate (0.15 < SMD < 0.5).
Fig. 2.

Forest plots for baseline plasma Aβ levels for incident AD subjects compared to those who remain normal upon follow up.
Funnel plots of cross-sectional studies
Most of the studies were symmetrical on the funnel plots, although some less precise studies with a large standard error may have caused a publication bias (Fig. 3A, 3B). Two studies were deselected on this basis, Arvanitakis et al. [22] for Aβ1-40 comparison and Tamaoka et al. [24] for Aβ1-42 comparison, however the results were not significantly affected. There was still no significant difference in Aβ1-40 levels between AD and cognitive normal control subjects (WMD: 2.34, 95%CI: [−14.09, 18.78], z = 0.28, p = 0.78). Compared to control subjects, AD subjects still had a marginally lower Aβ1-42 level (WMD: − 2.89, 95%CI: [−5.93, 0.14], z = 1.87, p = 0.06).
Fig. 3.

Funnel plots for plasma Aβ1-40 and Aβ1-42 levels in cross-sectional and longitudinal studies. Fig. 3A. Plasma Aβ1-40 levels in AD and cognitively normal control subjects in cross-sectional studies. Fig. 3B. Plasma Aβ1-42 levels in AD and cognitively normal control subjects in cross-sectional studies. Fig. 3C. Baseline plasma Aβ1-40 levels for incident AD and non-dementia normal groups upon follow up. Fig. 3D. Baseline plasma Aβ1-42 levels for incident AD and non-dementia normal groups upon follow up. The labeled numbers are annual conversion rates from non-dementia to AD for each study. (Conversion rate = incident AD number/total participants).
Funnel plots of longitudinal studies
Six of seven Aβ1-42 longitudinal studies were the same six studies used for Aβ1-40 study comparison, however the funnel plots for each differed greatly (Fig. 3C, 3D). The funnel plot of Aβ1-40 longitudinal studies was symmetrical, suggesting a lack of publication bias. However, the funnel plot of Aβ1-42 studies (i.e., using the same six studies as the Aβ1-40 comparison) was not symmetrical. We therefore labeled the annual conversion rates from non-dementia to incident AD for each Aβ1-42 study in the comparison, and found that studies with a high annual conversion rate generated a relatively high baseline of Aβ1-42 for AD subjects.
DISCUSSION
As hallmark features of AD, Aβ peptides from different bodily fluids have been the subject of many quantitative studies in order to establish their usefulness in diagnosing and predicting AD. Plasma Aβ measurement in AD has resulted in a variety of outcomes. Unlike previous CSF Aβ meta-analysis [8, 9, 29], we focused only on AD and not other types of dementia, and also evaluated basal Aβ levels in cognitively normal individuals who converted to AD in longitudinal follow up. The resulting meta-analysis showed that AD converters had higher initial plasma Aβ1-40 and Aβ1-42 levels in comparison with subjects who remained cognitively normal. Meta-analysis of cross-sectional studies indicated that AD patients had a marginally but non-significantly lower Aβ1-42 level (p = 0.08), and Aβ1-40 levels were not significantly different from healthy controls.
Our results are consistent with those studies which could not be included in this systematic review due to the strict entry criteria. Pomara and colleagues followed up cognitively healthy elderly individuals and observed that higher initial plasma Aβ1-42 levels were significantly associated with reductions in cognitive scores during follow-up [30]. Ertekin-Taner et al. found that young non-demented first degree relatives of patients with late onset AD also had elevated plasma Aβ levels [31]. Another study showed that people without dementia and those with prevalent dementia have lower basal Aβ1-42 levels than people with incident dementia [32]. The Rotterdam Study reported that high baseline concentrations of plasma Aβ1-40 were associated with an increased risk of dementia [33]. In the same study, increased Aβ1-42/Aβ1-40 ratio was shown to reduce the risk of dementia, however, baseline Aβ1-42 levels alone were not associated with the development of dementia [33]. Furthermore, the meta-analysis of longitudinal studies showed that the differences of baseline Aβ1-40 and Aβ1-42 levels between AD converters and subjects who remained cognitively normal were moderate. The clinical implication of Aβ levels as diagnostic biomarkers need to be further investigated.
By contrast, the study by Hansson et al. following MCI at baseline reported that plasma Aβ levels did not show a significant association with progression from MCI to AD [34], while yet another study showed that low plasma Aβ1-40 levels predicted incident AD in elderly men over 70 years old [35]. Similarly, work done by Seppala and coworkers used cognitive decline as a follow-up diagnosis, and reported subjects who declined cognitively during follow-up had lower levels of plasma Aβ1-42 at the baseline [36]. However, these studies were not directly comparable with our meta-analysis data on longitudinal studies because of different cognitive levels at baseline or follow-up, as well as having only single gender participants.
In this meta-analysis, the ratio of baseline Aβ1-42/Aβ1-40 in incident AD cases was not significantly different when compared with cognitively stable subjects. Three studies which could not be included in the current meta-analysis reported different results [33, 37, 38]. Okereke et al. observed that higher midlife plasma Aβ1-40/Aβ1-42 ratios were significantly associated with greater late-life decline on the global score of cognitive tests (i.e., lower Aβ1-42/Aβ1-40 ratios were associated with future cognitive decline.) [37]. Graff-Radford and collaborators followed 563 cognitively normal subjects and showed subjects with lower Aβ1-42/Aβ1-40 had a greater risk of developing MCI or AD [38]. The Rotterdam study reported similarly results that an increased Aβ1-42/Aβ1-40 ratio was associated with a reduced risk of dementia [33]. However, because these studies used different follow-up diagnoses and statistical treatment of data, we could not include them.
In our cross-sectional analysis, we found that AD patients had marginally lower plasma Aβ1-42 levels (WMD: z = 1.73, p = 0.08), however these did not achieve statistical significance. This is consistent with the statistically significant lower Aβ1-42 levels found in most CSF studies. Multiple factors may contribute to the weak trend in the plasma Aβ1-42 data of cross sectional studies, such as stages of AD, effects of ageing, APOE genotype proportion, and variability in Aβ measurement.
Plasma Aβ levels may vary at different stages of AD. Compared with the early stages of AD, Aβ1-42 values were found to be lower in AD subjects in moderate to severe stages of the disease [39]. After follow-up for more than 4 years, AD outpatients with low plasma levels of Aβ1-40 and Aβ1-42 experienced more rapid cognitive decline [40]. It is hard to control or standardize the AD clinical levels from different cross-sectional studies, so directly comparable Aβ levels of AD could not be determined. Prospective studies observing cognitively normal participants at high risk of AD provide a better understanding of the association between Aβ levels and AD.
The effects of aging and apolipoprotein E (APOE) gene (APOE) also complicate the interpretation of plasma Aβ levels [41]. Plasma Aβ may increase in an age-dependent manner in non-demented adults. Lopez et al. found that after 4 years’ follow-up, Aβ levels gradually increased with age in cognitively normal subjects [26]. Some studies also showed that increase in age correlated with raised Aβ levels in AD/MCI patients and other neurological controls [21]. Differing proportions of the APOE β4 genotype in the cross-sectional studies might have influenced the plasma Aβ levels. APOE4 altered the clearance and transport of Aβ within different brain compartments and favored the formation of cerebral amyloid angiopathy [42]. APOE isoforms differentially regulated Aβ clearance across the blood-brain barrier [43]. In transgenic animal models, over-expression of APOE β4 increased the retention of Aβ1-42 in plasma over time in comparison with APOE β2 and APOE β3, suggesting that the peripheral clearance of Aβ1-42 is altered by APOE genotype [44].
Measurement of Aβ levels is technically much more challenging in plasma than in CSF, since not only are the Aβ levels approximately ten-fold lower than CSF levels, but the total protein content of plasma is about ten-fold higher. The traditional method of plasma Aβ measurement is sandwich ELISA, however lipoprotein and Fc-binding proteins in plasma may influence immunological detection [45]. Soluble Aβ species also interact and bind to a wide range of proteins, such as albumin, β2-macroglobin, haptoglobin, lipoproteins, and other chaperone proteins [46]. These complexes may interfere with ELISA immunoreactions and confound the results [47]. Furthermore, between-laboratory variability in measurement of plasma Aβ may also be exacerbated by the diversity of ELISA antibodies, with varying sensitivities and sometimes poorly defined specificities. Conventional Aβ ELISAs have been applied to measure monomeric Aβ species [48]. Some Aβ oligomer (oAβ) specific ELISA assays for plasma have also been developed [49]. Since oAβ has been linked to neuronal toxic effects and synaptic failure, oAβ measurement may support a better understanding of the relationship between different Aβ species in AD in vivo [48, 49]. Some assays have been validated in more detail to establish greater sensitivity and selectivity for the assay of plasma Aβ peptides [50].
The dynamic equilibrium between the brain, CSF and plasma Aβ levels also needs to be further clarified. In an animal model, radio labeled Aβ1-40 was shown to be rapidly cleared from ventricular CSF to the blood [51], and consistently decreased Aβ levels in CSF and plasma were related to Aβ plaque burden in a mouse model of AD [52]. However, the equilibrium between CSF and plasma Aβ has not been proven in AD patients [16, 53, 54] and cognitive normal individuals [54], and may not be easily verified in humans in vivo. Changes to plasma Aβ levels may also be influenced by metabolic turnover time in the liver and kidney. Most CSF longitudinal studies begin with the MCI diagnosis [8, 9], and the predictive powder of CSF Aβ levels at the pre-MCI stage has not been fully investigated [18, 55, 56].
Our systematic review suggests a model of differential longitudinal changes in plasma Aβ levels in cognitively stable individuals versus those who go on to develop AD dementia. This model is depicted in Figure 4. In the cognitively stable, plasma Aβ levels gradually increase over time by a modest amount [26]. Our data suggest that cognitively normal subjects with higher initial Aβ levels may be at greater risk of progression to AD, and that Aβ1-42 levels then tend to decrease later, probably as Aβ deposition commences prior to diagnosis. In this AD converter group, plasma Aβ levels are therefore initially elevated, reach a pre-diagnosis inflection point, and then eventually fall to lie in the same range as normal controls, or even marginally below [57]. Our model is therefore consistent with a pathophysiological AD process that starts years before even the pre-dementia phase of MCI [58]. High plasma Aβ levels may reflect a genetic or other predisposition to increased production, or reduced clearance of Aβ [40]. Cognitively normal subjects with high basal Aβ levels may therefore have a higher risk of developing AD than matched peers with low Aβ levels. One recent meta-analytic study reported that increased Aβ1-40 levels showed a weak association with conversion from MCI to AD (Cohen’s delta 0.18, p = 0.15) [29], which is also consistent with our model. Hypothetically, the reduction of soluble Aβ1-42 in later stages may result from a “sink” effect of amyloid plaque and vascular deposition, preventing transport of Aβ1-42 from the brain to the plasma via the interstitial fluid [52, 59, 60]. We cannot, however, conclude whether high baseline plasma Aβ is a clinically useful prognostic AD biomarker until further longitudinal studies provide more information about sensitivity, specificity, and positive and negative predictive value. Future studies may wish to focus on whether evidence of an inflection point on repeat plasma testing is particularly sensitive to future development of dementia.
Fig. 4.
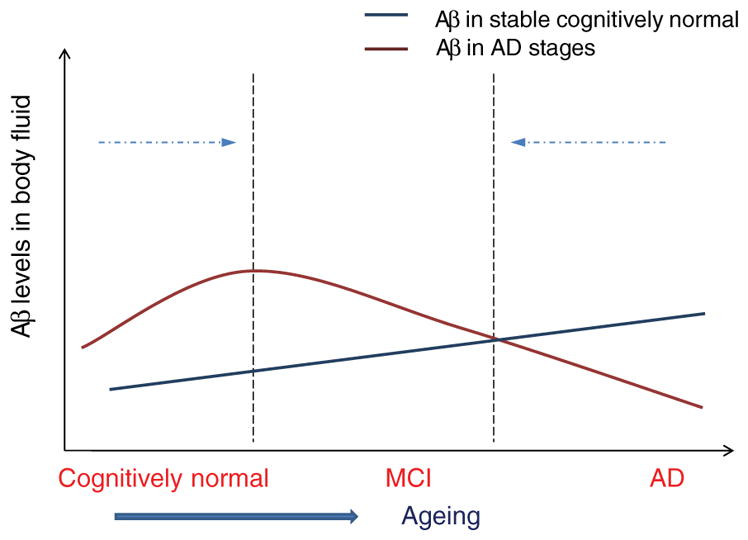
A model for plasma Aβ1-42 level changes in AD and normal aging. Evidence suggests that Aβ levels in cognitively stable individuals increase slightly with age. In those who eventually develop clinical AD, Aβ1-42 levels are elevated in the pre-dementia stage, reach a peak, and then diminish prior to the development of clinical AD symptoms. Hence, when comparing plasma levels crosssection-ally between AD patients and controls, these will tend to converge.
In conclusion, results of this meta-analysis suggest that higher basal Aβ1-40 and Aβ1-42 levels in cognitively normal elderly individuals might be predictors of higher rates of progression to AD or dementia. The trends in the cross-sectional data suggest lower Aβ1-42 levels once progression to clinically diagnosed AD has occurred. These data might reflect the neurochemistry of Aβ1-42, with initially higher peptide levels generated by increased expression or cleavage, progressing to lower levels possibly due to plaque deposition in the later stages of the disease. Further research is required to establish the patient-specific clinical utility of these potentially prognostic blood-based biomarkers of AD.
Acknowledgments
We gratefully acknowledge Imrich Blasko, Gian-luigi Forloni, Alex E. Roher and Jean-Charles Lambert for providing relevant information and data from their studies at our request. Support for this work was provided by the National Health and Medical Research Council Program grant ID 350833. Authors thank Kate Crosbie for her considerable administrative help and editing assistance.
Authors’ disclosures available online (http://www.j-alz.com/disclosures/view.php?id=851).
References
- 1.Blennow K, de Leon MJ, Zetterberg H. Alzheimer’s disease. Lancet. 2006;368:387–403. doi: 10.1016/S0140-6736(06)69113-7. [DOI] [PubMed] [Google Scholar]
- 2.Snowdon DA, Kemper SJ, Mortimer JA, Greiner LH, Wek-stein DR, Markesbery WR. Linguistic ability in early life and cognitive function and Alzheimer’s disease in late life. Findings from the Nun Study. JAMA. 1996;275:528–532. [PubMed] [Google Scholar]
- 3.Hardy J, Selkoe DJ. The amyloid hypothesis of Alzheimer’s disease: progress and problems on the road to therapeutics. Science. 2002;297:353–356. doi: 10.1126/science.1072994. [DOI] [PubMed] [Google Scholar]
- 4.Sjogren M, Minthon L, Davidsson P, Granerus AK, Clarberg A, Vanderstichele H, Vanmechelen E, Wallin A, Blennow K. CSF levels of tau, beta-amyloid(1-42) and GAP-43 in frontotemporal dementia, other types of dementia and normal aging. J Neural Transm. 2000;107:563–579. doi: 10.1007/s007020070079. [DOI] [PubMed] [Google Scholar]
- 5.Andreasen N, Minthon L, Davidsson P, Vanmechelen E, Vanderstichele H, Winblad B, Blennow K. Evaluation of CSF-tau and CSF-Abeta42 as diagnostic markers for Alzheimer disease in clinical practice. Arch Neurol. 2001;58:373–379. doi: 10.1001/archneur.58.3.373. [DOI] [PubMed] [Google Scholar]
- 6.Sunderland T, Linker G, Mirza N, Putnam KT, Friedman DL, Kimmel LH, Bergeson J, Manetti GJ, Zimmermann M, Tang B, Bartko JJ, Cohen RM. Decreased beta-amyloid1-42 and increased tau levels in cerebrospinal fluid of patients with Alzheimer disease. JAMA. 2003;289:2094–2103. doi: 10.1001/jama.289.16.2094. [DOI] [PubMed] [Google Scholar]
- 7.Hansson O, Zetterberg H, Buchhave P, Londos E, Blennow K, Minthon L. Association between CSF biomarkers and incipient Alzheimer’s disease in patients with mild cognitive impairment: a follow-up study. Lancet Neurol. 2006;5:228–234. doi: 10.1016/S1474-4422(06)70355-6. [DOI] [PubMed] [Google Scholar]
- 8.Schmand B, Huizenga HM, van Gool WA. Meta-analysis of CSF and MRI biomarkers for detecting preclinical Alzheimer’s disease. Psychol Med. 2010;40:135–145. doi: 10.1017/S0033291709991516. [DOI] [PubMed] [Google Scholar]
- 9.Diniz BS, Pinto JA, Junior, Forlenza OV. Do CSF total tau, phosphorylated tau, and beta-amyloid 42 help to predict progression of mild cognitive impairment to Alzheimer’s disease? A systematic review and meta-analysis of the literature. World J Biol Psychiatry. 2008;9:172–182. doi: 10.1080/15622970701535502. [DOI] [PubMed] [Google Scholar]
- 10.Lambert JC, Schraen-Maschke S, Richard F, Fievet N, Rouaud O, Berr C, Dartigues JF, Tzourio C, Alperovitch A, Buee L, Amouyel P. Association of plasma amyloid beta with risk of dementia: the prospective Three-City Study. Neurology. 2009;73:847–853. doi: 10.1212/WNL.0b013e3181b78448. [DOI] [PubMed] [Google Scholar]
- 11.Roher AE, Esh CL, Kokjohn TA, Castano EM, Van Vickle GD, Kalback WM, Patton RL, Luehrs DC, Daugs ID, Kuo YM, Emmerling MR, Soares H, Quinn JF, Kaye J, Connor DJ, Silverberg NB, Adler CH, Seward JD, Beach TG, Sabbagh MN. Amyloid beta peptides in human plasma and tissues and their significance for Alzheimer’s disease. Alzheimers Dement. 2009;5:18–29. doi: 10.1016/j.jalz.2008.10.004. [DOI] [PMC free article] [PubMed] [Google Scholar]
- 12.Blasko I, Jellinger K, Kemmler G, Krampla W, Jungwirth S, Wichart I, Tragl KH, Fischer P. Conversion from cognitive health to mild cognitive impairment and Alzheimer’s disease: prediction by plasma amyloid beta 42, medial temporal lobe atrophy and homocysteine. Neurobiol Aging. 2008;29:1–11. doi: 10.1016/j.neurobiolaging.2006.09.002. [DOI] [PubMed] [Google Scholar]
- 13.Pesaresi M, Lovati C, Bertora P, Mailland E, Galimberti D, Scarpini E, Quadri P, Forloni G, Mariani C. Plasma levels of beta-amyloid (1-42) in Alzheimer’s disease and mild cognitive impairment. Neurobiol Aging. 2006;27:904–905. doi: 10.1016/j.neurobiolaging.2006.03.004. [DOI] [PubMed] [Google Scholar]
- 14.Mayeux R, Honig LS, Tang MX, Manly J, Stern Y, Schupf N, Mehta PD. Plasma Aβ40 and Aβ42 and Alzheimer’s disease: relation to age, mortality, and risk. Neurology. 2003;61:1185–1190. doi: 10.1212/01.wnl.0000091890.32140.8f. [DOI] [PubMed] [Google Scholar]
- 15.Buerger K, Frisoni G, Uspenskaya O, Ewers M, Zetterberg H, Geroldi C, Binetti G, Johannsen P, Rossini PM, Wahlund LO, Vellas B, Blennow K, Hampel H. Validation of Alzheimer’s disease CSF and plasma biological markers: the multicentre reliability study of the pilot European Alzheimer’s Disease Neuroimaging Initiative (E-ADNI) Exp Gerontol. 2009;44:579–585. doi: 10.1016/j.exger.2009.06.003. [DOI] [PubMed] [Google Scholar]
- 16.Giedraitis V, Sundelof J, Irizarry MC, Garevik N, Hyman BT, Wahlund LO, Ingelsson M, Lannfelt L. The normal equilibrium between CSF and plasma amyloid beta levels is disrupted in Alzheimer’s disease. Neurosci Lett. 2007;427:127–131. doi: 10.1016/j.neulet.2007.09.023. [DOI] [PubMed] [Google Scholar]
- 17.Abdullah L, Paris D, Luis C, Quadros A, Parrish J, Valdes L, Keegan AP, Mathura V, Crawford F, Mullan M. The influence of diagnosis, intra- and inter-person variability on serum and plasma Abeta levels. Neurosci Lett. 2007;428:53–58. doi: 10.1016/j.neulet.2007.09.058. [DOI] [PubMed] [Google Scholar]
- 18.Fagan AM, Roe CM, Xiong C, Mintun MA, Morris JC, Holtz-man DM. Cerebrospinal fluid tau/beta-amyloid(42) ratio as a prediction of cognitive decline in nondemented older adults. Arch Neurol. 2007;64:343–349. doi: 10.1001/archneur.64.3.noc60123. [DOI] [PubMed] [Google Scholar]
- 19.Kulstad JJ, Green PS, Cook DG, Watson GS, Reger MA, Baker LD, Plymate SR, Asthana S, Rhoads K, Mehta PD, Craft S. Differential modulation of plasma beta-amyloid by insulin in patients with Alzheimer disease. Neurology. 2006;66:1506–1510. doi: 10.1212/01.wnl.0000216274.58185.09. [DOI] [PubMed] [Google Scholar]
- 20.Sobow T, Flirski M, Kloszewska I, Liberski PP. Plasma levels of alpha beta peptides are altered in amnestic mild cognitive impairment but not in sporadic Alzheimer’s disease. Acta Neurobiol Exp (Wars) 2005;65:117–124. doi: 10.55782/ane-2005-1544. [DOI] [PubMed] [Google Scholar]
- 21.Fukumoto H, Tennis M, Locascio JJ, Hyman BT, Growdon JH, Irizarry MC. Age but not diagnosis is the main predictor of plasma amyloid beta-protein levels. Arch Neurol. 2003;60:958–964. doi: 10.1001/archneur.60.7.958. [DOI] [PubMed] [Google Scholar]
- 22.Arvanitakis Z, Lucas JA, Younkin LH, Younkin SG, Graff-Radford NR. Serum creatinine levels correlate with plasma amyloid Beta protein. Alzheimer Dis Assoc Disord. 2002;16:187–190. doi: 10.1097/00002093-200207000-00009. [DOI] [PubMed] [Google Scholar]
- 23.Kosaka T, Imagawa M, Seki K, Arai H, Sasaki H, Tsuji S, Asami-Odaka A, Fukushima T, Imai K, Iwatsubo T. The beta APP717 Alzheimer mutation increases the percentage of plasma amyloid-beta protein ending at A beta42(43) Neurology. 1997;48:741–745. doi: 10.1212/wnl.48.3.741. [DOI] [PubMed] [Google Scholar]
- 24.Tamaoka A, Fukushima T, Sawamura N, Ishikawa K, Oguni E, Komatsuzaki Y, Shoji S. Amyloid beta protein in plasma from patients with sporadic Alzheimer’s disease. J Neurol Sci. 1996;141:65–68. doi: 10.1016/0022-510x(96)00143-8. [DOI] [PubMed] [Google Scholar]
- 25.Schupf N, Tang MX, Fukuyama H, Manly J, Andrews H, Mehta P, Ravetch J, Mayeux R. Peripheral Abeta subspecies as risk biomarkers of Alzheimer’s disease. Proc Natl Acad Sci U S A. 2008;105:14052–14057. doi: 10.1073/pnas.0805902105. [DOI] [PMC free article] [PubMed] [Google Scholar]
- 26.Lopez OL, Kuller LH, Mehta PD, Becker JT, Gach HM, Sweet RA, Chang YF, Tracy R, DeKosky ST. Plasma amyloid levels and the risk of AD in normal subjects in the Cardiovascular Health Study. Neurology. 2008;70:1664–1671. doi: 10.1212/01.wnl.0000306696.82017.66. [DOI] [PMC free article] [PubMed] [Google Scholar]
- 27.Mayeux R, Tang MX, Jacobs DM, Manly J, Bell K, Merchant C, Small SA, Stern Y, Wisniewski HM, Mehta PD. Plasma amyloid beta-peptide 1-42 and incipient Alzheimer’s disease. Ann Neurol. 1999;46:412–416. doi: 10.1002/1531-8249(199909)46:3<412::aid-ana19>3.0.co;2-a. [DOI] [PubMed] [Google Scholar]
- 28.Cosentino SA, Stern Y, Sokolov E, Scarmeas N, Manly JJ, Tang MX, Schupf N, Mayeux RP. Plasma β-Amyloid and Cognitive Decline. Arch Neurol. 2010;67:1485–1490. doi: 10.1001/archneurol.2010.189. [DOI] [PMC free article] [PubMed] [Google Scholar]
- 29.van Rossum IA, Vos S, Handels R, Visser PJ. Biomarkers as predictors for conversion from mild cognitive impairment to Alzheimer-type dementia: implications for trial design. J Alzheimers Dis. 2010;20:881–891. doi: 10.3233/JAD-2010-091606. [DOI] [PubMed] [Google Scholar]
- 30.Pomara N, Willoughby LM, Sidtis JJ, Mehta PD. Selective reductions in plasma Abeta 1-42 in healthy elderly subjects during longitudinal follow-up: a preliminary report. Am J Geriatr Psychiatry. 2005;13:914–917. doi: 10.1176/appi.ajgp.13.10.914. [DOI] [PubMed] [Google Scholar]
- 31.Ertekin-Taner N, Younkin LH, Yager DM, Parfitt F, Baker MC, Asthana S, Hutton ML, Younkin SG, Graff-Radford NR. Plasma amyloid beta protein is elevated in late-onset Alzheimer disease families. Neurology. 2008;70:596–606. doi: 10.1212/01.WNL.0000278386.00035.21. [DOI] [PubMed] [Google Scholar]
- 32.Luchsinger JA, Tang MX, Miller J, Green R, Mehta PD, Mayeux R. Relation of plasma homocysteine to plasma amyloid beta levels. Neurochem Res. 2007;32:775–781. doi: 10.1007/s11064-006-9207-7. [DOI] [PubMed] [Google Scholar]
- 33.van Oijen M, Hofman A, Soares HD, Koudstaal PJ, Breteler MM. Plasma Abeta(1-40) and Abeta(1-42) and the risk of dementia: a prospective case-cohort study. Lancet Neurol. 2006;5:655–660. doi: 10.1016/S1474-4422(06)70501-4. [DOI] [PubMed] [Google Scholar]
- 34.Hansson O, Zetterberg H, Vanmechelen E, Vanderstichele H, Andreasson U, Londos E, Wallin A, Minthon L, Blennow K. Evaluation of plasma Abeta(40) and Abeta(42) as predictors of conversion to Alzheimer’s disease in patients with mild cognitive impairment. Neurobiol Aging. 2010;31:357–367. doi: 10.1016/j.neurobiolaging.2008.03.027. [DOI] [PubMed] [Google Scholar]
- 35.Sundelof J, Giedraitis V, Irizarry MC, Sundstrom J, Ingels-son E, Ronnemaa E, Arnlov J, Gunnarsson MD, Hyman BT, Basun H, Ingelsson M, Lannfelt L, Kilander L. Plasma beta amyloid and the risk of Alzheimer disease and dementia in elderly men: a prospective, population-based cohort study. Arch Neurol. 2008;65:256–263. doi: 10.1001/archneurol.2007.57. [DOI] [PubMed] [Google Scholar]
- 36.Seppala TT, Herukka SK, Hanninen T, Tervo S, Hallikainen M, Soininen H, Pirttila T. Plasma Abeta42 and Abeta40 as markers of cognitive change in follow-up: a prospective, longitudinal, population-based cohort study. J Neurol Neuro-surg Psychiatry. 2010;81:1123–1127. doi: 10.1136/jnnp.2010.205757. [DOI] [PMC free article] [PubMed] [Google Scholar]
- 37.Okereke OI, Xia W, Selkoe DJ, Grodstein F. Ten-year change in plasma amyloid beta levels and late-life cognitive decline. Arch Neurol. 2009;66:1247–1253. doi: 10.1001/archneurol.2009.207. [DOI] [PMC free article] [PubMed] [Google Scholar]
- 38.Graff-Radford NR, Crook JE, Lucas J, Boeve BF, Knopman DS, Ivnik RJ, Smith GE, Younkin LH, Petersen RC, Younkin SG. Association of low plasma Abeta42/Abeta40 ratios with increased imminent risk for mild cognitive impairment and Alzheimer disease. Arch Neurol. 2007;64:354–362. doi: 10.1001/archneur.64.3.354. [DOI] [PubMed] [Google Scholar]
- 39.Baranowska-Bik A, Bik W, Wolinska-Witort E, Martynska L, Chmielowska M, Barcikowska M, Baranowska B. Plasma beta amyloid and cytokine profile in women with Alzheimer’s disease. Neuro Endocrinol Lett. 2008;29:75–79. [PubMed] [Google Scholar]
- 40.Locascio JJ, Fukumoto H, Yap L, Bottiglieri T, Growdon JH, Hyman BT, Irizarry MC. Plasma amyloid beta-protein and C-reactive protein in relation to the rate of progression of Alzheimer disease. Arch Neurol. 2008;65:776–785. doi: 10.1001/archneur.65.6.776. [DOI] [PMC free article] [PubMed] [Google Scholar]
- 41.Oh ES, Troncoso JC, Fangmark Tucker SM. Maximizing the potential of plasma amyloid-beta as a diagnostic biomarker for Alzheimer’s disease. Neuromolecular Med. 2008;10:195–207. doi: 10.1007/s12017-008-8035-0. [DOI] [PMC free article] [PubMed] [Google Scholar]
- 42.Fryer JD, Simmons K, Parsadanian M, Bales KR, Paul SM, Sullivan PM, Holtzman DM. Human apolipoprotein E4 alters the amyloid-beta 40:42 ratio and promotes the formation of cerebral amyloid angiopathy in an amyloid precursor protein transgenic model. J Neurosci. 2005;25:2803–2810. doi: 10.1523/JNEUROSCI.5170-04.2005. [DOI] [PMC free article] [PubMed] [Google Scholar]
- 43.Deane R, Sagare A, Hamm K, Parisi M, Lane S, Finn MB, Holtzman DM, Zlokovic BV. APOE isoform-specific disruption of amyloid beta peptide clearance from mouse brain. J Clin Invest. 2008;118:4002–4013. doi: 10.1172/JCI36663. [DOI] [PMC free article] [PubMed] [Google Scholar]
- 44.Sharman MJ, Morici M, Hone E, Berger T, Taddei K, Martins IJ, Lim WL, Singh S, Wenk MR, Ghiso J, Buxbaum JD, Gandy S, Martins RN. APOE genotype results in differential effects on the peripheral clearance of amyloid-beta42 in APOE knock-in and knock-out mice. J Alzheimers Dis. 2010;21:403–409. doi: 10.3233/JAD-2010-100141. [DOI] [PMC free article] [PubMed] [Google Scholar]
- 45.Kawarabayashi T, Shoji M. Plasma biomarkers of Alzheimer’s disease. Curr Opin Psychiatry. 2008;21:260–267. doi: 10.1097/YCO.0b013e3282fc989f. [DOI] [PubMed] [Google Scholar]
- 46.Wilson MR, Yerbury JJ, Poon S. Potential roles of abundant extracellular chaperones in the control of amyloid formation and toxicity. Mol Biosyst. 2008;4:42–52. doi: 10.1039/b712728f. [DOI] [PubMed] [Google Scholar]
- 47.Takeda S, Sato N, Rakugi H, Morishita R. Plasma beta-amyloid as potential biomarker of Alzheimer disease: possibility of diagnostic tool for Alzheimer disease. Mol Biosyst. 2010;6:1760–1766. doi: 10.1039/c003148h. [DOI] [PubMed] [Google Scholar]
- 48.Fullwood NJ, Hayashi Y, Allsop D. Plasma amyloid-beta concentrations in Alzheimer’s disease: an alternative hypothesis. Lancet Neurol. 2006:1000–1001. doi: 10.1016/S1474-4422(06)70611-1. author reply. 5, 1002–1003. [DOI] [PubMed] [Google Scholar]
- 49.Xia W, Yang T, Shankar G, Smith IM, Shen Y, Walsh DM, Selkoe DJ. A specific enzyme-linked immunosorbent assay for measuring beta-amyloid protein oligomers in human plasma and brain tissue of patients with Alzheimer disease. Arch Neurol. 2009;66:190–199. doi: 10.1001/archneurol.2008.565. [DOI] [PMC free article] [PubMed] [Google Scholar]
- 50.Okereke OI, Xia W, Irizarry MC, Sun X, Qiu WQ, Fagan AM, Mehta PD, Hyman BT, Selkoe DJ, Grodstein F. Performance characteristics of plasma amyloid-beta 40 and 42 assays. J Alzheimers Dis. 2009;16:277–285. doi: 10.3233/JAD-2009-0948. [DOI] [PMC free article] [PubMed] [Google Scholar]
- 51.Ghersi-Egea JF, Gorevic PD, Ghiso J, Frangione B, Patlak CS, Fenstermacher JD. Fate of cerebrospinal fluid-borne amyloid beta-peptide: rapid clearance into blood and appreciable accumulation by cerebral arteries. J Neurochem. 1996;67:880–883. doi: 10.1046/j.1471-4159.1996.67020880.x. [DOI] [PubMed] [Google Scholar]
- 52.Kawarabayashi T, Younkin LH, Saido TC, Shoji M, Ashe KH, Younkin SG. Age-dependent changes in brain, CSF, and plasma amyloid (beta) protein in the Tg2576 transgenic mouse model of Alzheimer’s disease. J Neurosci. 2001;21:372–381. doi: 10.1523/JNEUROSCI.21-02-00372.2001. [DOI] [PMC free article] [PubMed] [Google Scholar]
- 53.Mehta PD, Pirttila T, Patrick BA, Barshatzky M, Mehta SP. Amyloid beta protein 1-40 and 1-42 levels in matched cerebrospinal fluid and plasma from patients with Alzheimer disease. Neurosci Lett. 2001;304:102–106. doi: 10.1016/s0304-3940(01)01754-2. [DOI] [PubMed] [Google Scholar]
- 54.Fagan AM, Mintun MA, Shah AR, Aldea P, Roe CM, Mach RH, Marcus D, Morris JC, Holtzman DM. Cerebrospinal fluid tau and ptau(181) increase with cortical amyloid deposition in cognitively normal individuals: implications for future clinical trials of Alzheimer’s disease. EMBO Mol Med. 2009;1:371–380. doi: 10.1002/emmm.200900048. [DOI] [PMC free article] [PubMed] [Google Scholar]
- 55.Stomrud E, Hansson O, Zetterberg H, Blennow K, Minthon L, Londos E. Correlation of longitudinal cerebrospinal fluid biomarkers with cognitive decline in healthy older adults. Arch Neurol. 2010;67:217–223. doi: 10.1001/archneurol.2009.316. [DOI] [PubMed] [Google Scholar]
- 56.Stomrud E, Hansson O, Blennow K, Minthon L, Londos E. Cerebrospinal fluid biomarkers predict decline in subjective cognitive function over 3 years in healthy elderly. Dement Geriatr Cogn Disord. 2007;24:118–124. doi: 10.1159/000105017. [DOI] [PubMed] [Google Scholar]
- 57.Golde TE, Eckman CB, Younkin SG. Biochemical detection of Abeta isoforms: implications for pathogenesis, diagnosis, and treatment of Alzheimer’s disease. Biochim Biophys Acta. 2000;1502:172–187. doi: 10.1016/s0925-4439(00)00043-0. [DOI] [PubMed] [Google Scholar]
- 58.Jack CRJ, Jr, Knopman DS, Jagust WJ, Shaw LM, Aisen PS, Weiner MW, Petersen RC, Trojanowski JQ. Hypothetical model of dynamic biomarkers of the Alzheimer’s pathological cascade. Lancet Neurol. 2010;9:119–128. doi: 10.1016/S1474-4422(09)70299-6. [DOI] [PMC free article] [PubMed] [Google Scholar]
- 59.DeMattos RB, Bales KR, Parsadanian M, O’Dell MA, Foss EM, Paul SM, Holtzman DM. Plaque-associated disruption of CSF and plasma amyloid-beta (Abeta) equilibrium in a mouse model of Alzheimer’s disease. J Neurochem. 2002;81:229–236. doi: 10.1046/j.1471-4159.2002.00889.x. [DOI] [PubMed] [Google Scholar]
- 60.Fagan AM, Mintun MA, Mach RH, Lee SY, Dence CS, Shah AR, LaRossa GN, Spinner ML, Klunk WE, Mathis CA, DeKosky ST, Morris JC, Holtzman DM. Inverse relation between in vivo amyloid imaging load and cerebrospinal fluid Abeta42 in humans. Ann Neurol. 2006;59:512–519. doi: 10.1002/ana.20730. [DOI] [PubMed] [Google Scholar]