

Abstract
High-load resistance training (HL) may be contraindicated in older adults due to pre-existing health conditions (e.g. osteoarthritis). Low-load blood flow restricted (BFR) resistance training offers an alternative to HL with potentially similar strength improvement.
PURPOSE
To compare muscle strength, cross-sectional area (CSA), physical function, and quality of life (QOL) following 12-weeks of HL or BFR training in older adults at risk of mobility limitations.
METHODS
Thirty-six males and females (mean: 75.6 years 95% confidence interval: [73.4–78.5], 1.67 m [1.64–1.70], 74.3 kg [69.8–78.8]) were randomly assigned to HL (70% of one repetition maximum [1-RM]) or low-load BFR (30% 1-RM coupled with a vascular restriction) exercise for the knee extensors and flexors twice per week for 12 weeks. A control (CON) group performed light upper body resistance and flexibility training. Muscle strength, CSA of the quadriceps, 400-m walking speed, Short Physical Performance Battery (SPPB), and QOL were assessed before, midway and after training.
RESULTS
Within 6-weeks of HL training, increases in all strength measures and CSA were evident and the gains were significantly greater than the CON group (P<0.05). The BFR group had strength increases in leg extension and leg press 1-RM tests, but were significantly lower in leg extension isometric maximum voluntary contraction (MVC) and leg extension 1-RM than the HL group (P<.01). At 12-weeks HL and BFR training did not differ in MVC (P=.14). Walking speed increased 4% among all training groups (P<.01) and no changes were observed for overall SPPB score and QOL (P>.05).
CONCLUSION
Both training programs resulted in muscle CSA improvements and HL training had more pronounced strength gains than BFR training after 6-weeks and were more similar to BFR after 12-weeks of training. These changes in both groups did not transfer to improvements in QOL, SPPB, and walking speed. Since both programs result in strength and CSA gains, albeit at different rates, future research should consider using a combination of HL and BFR training in older adults with profound muscle weakness and mobility limitations.
Keywords: blood flow restriction, resistance training, physical function, strength, elderly
1. Introduction
Sarcopenia is the age-related loss of muscle mass and strength that places older adults at increased risk of many adverse outcomes (33). For example, low knee extensor muscle strength is a predictor of poor physical function, disability, hospitalization and mortality (17, 21, 22, 26), which in turn are closely related to lower quality of life (QOL) (12). The premise of many physical activity programs for older adults is to improve muscle strength and size using resistance exercise with the goal of transferring these gains to physical function and enhanced QOL. While the relationship between strength and physical function tends to be linear and most robust for weak older adults, greater muscle strength is not always associated with better function for those on the high end of the strength spectrum (9, 26). Resistance exercise may therefore be most efficacious for older adults with muscle weakness who are at risk of mobility limitation and disability.
It is recommended that older adults perform high-load (HL) resistance training at 60–80% of their maximum strength at least two days per week (13) and it is well documented that this regimen increases muscle strength and hypertrophy (29). However, resistance loads of 60–80% of one repetition maximum (1-RM) may be challenging for older people with profound muscle weakness, joint pathologies, neuromuscular disorders, or those undergoing medical treatments that limit physical capacity. Within the last two decades, resistance training at low-loads (~20–30% 1-RM) with blood flow restriction (BFR) to the exercising muscle has been shown to improve muscle strength and size to a similar magnitude as HL training (16, 18, 20). Since BFR resistance training puts less mechanical stress on joints than HL training and increases strength and hypertrophy similarly, it could be an adjunct therapy for older individuals with muscle weakness, arthritis, and other orthopedic co-morbidities. If older adults gain muscle strength and mass as a result of BFR exercise, these adaptations may improve physical function and QOL in a segment of the population who are otherwise unable to benefit from resistance exercise.
Currently, there are only a few studies directly comparing muscle adaptations of BFR to HL resistance training in older adults (16, 35), and neither of these studies included individuals with existing muscle weakness. Additionally, the transfer of muscular adaptations to physical function in older adults is inconsistent as some studies demonstrate enhanced physical function following resistance training (5, 7, 8, 11) and others do not (24, 34). Therefore, the purpose of this study was to compare the effects of 12-weeks of HL and BFR training on lower extremity strength, hypertrophy, physical function, and QOL in older adults who were at risk of mobility limitations due to muscle weakness. It was hypothesized that HL and BFR training programs would improve muscle strength, cross-sectional area (CSA) of the quadriceps, walking speed, Short Physical Performance Battery (SPPB) and QOL equally and to a greater extent than a control program.
2. Methods
2.1 Experimental Design
A between groups repeated measures design was used to assess muscle strength, CSA and physical function of older adults classified as being weak and at risk of mobility limitations before, midway, and after 12-weeks of an exercise intervention. A stratified randomization approach was used to place participants by age (65–75 years and 75+ years) and sex into one of three exercise intervention groups: HL resistance training for the legs, BFR resistance training for the legs, or upper body stretching and light resistance training that served as an attention control group (CON).
2.2 Subject Recruitment and Participant Descriptions
Community dwelling males and females ≥65 years old were recruited via newspaper advertisements, mailings and local presentations. Potential participants (137 individuals; Figure 1) underwent a telephone screening to determine their eligibility for the study. Individuals were eligible to participate in a strength screening following the telephone interview had a self-reported body mass index <30 kg·m−2, did not engage in resistance training within the last six months, and did not self-report uncontrolled hypertension (>150/90 mmHg), the presence of neuromuscular disease, a terminal disease, myocardial infarction in the past 6 months, unstable cardiovascular disease or a fracture within the last 6 months. Older adults that met these criteria (89 individuals) were then invited to participate in a muscle strength screening session at the laboratory. In this screening, individuals signed an informed consent, had their height and body mass measured and the Mini-Mental State Exam (MMSE) was administered. If the individuals obtained a MMSE score ≥ 24 and their body mass index was <30 kg·m−2, their muscle strength was tested using an isokinetic dynamometer (HUMAC NORM, CSMI, Stoughton, MA) integrated with a data aquisition system (MP100, Biopac Systems, Inc., Goleta, CA). Six isokinetic, unilateral knee extension exercises at 60°·s−1 were performed using the right leg and the three highest torques were averaged. The strength-to-weight (STW) ratio was determined by dividing the mean torque by the individuals’ body mass. If participants’ STW ratio was below 1.71 Nm·kg−1 for males and 1.34 Nm·kg−1 for females they were eligible to participate in the resistance training regimen (26). Thirty-six individuals (15 males, 21 females; Table 1) that met the health and strength criteria volunteered for the study. All participants in the study signed an informed consent approved by the University of New Hampshire Institutional Review Board to participate in the strength screening session and then another one for the resistance training study. The volunteers also gained approval from a primary care provider to participate and underwent an exercise stress test on a treadmill supervised by a cardiologist that also provided medical clearance. These individuals then underwent a familiarization session in which they were orientated to the exercise equipment, the strength testing protocol and the general study procedures.
Figure 1.
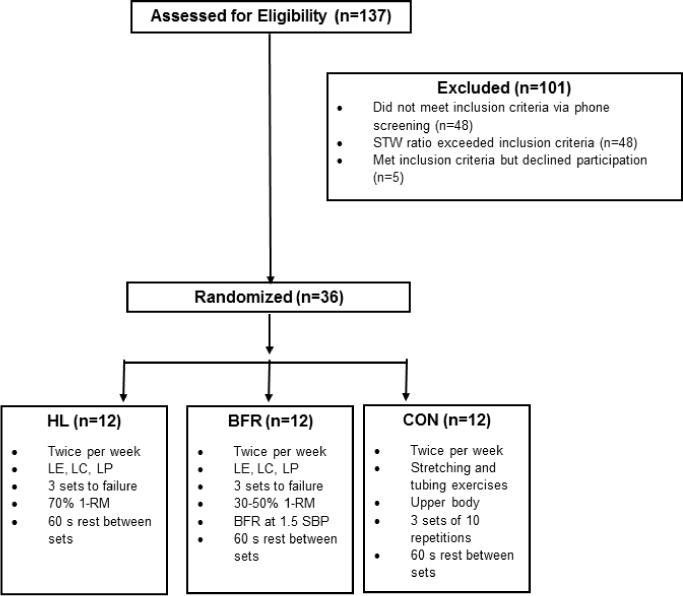
Schematic of study recruitment and intervention allocation. HL: high-load; BFR: blood flow restricted; CON: control; STW: Strength-to-weight; LE: leg extension, LC: leg curl; LP: leg press; SBP: systolic blood pressure.
Table 1.
Descriptive statistics of the sample by group assignment to high-load (HL) resistance training, low-load blood flow restricted (BFR) resistance training, or attention control (CON).
| HL | BFR | CON | |
|---|---|---|---|
|
| |||
| n | 12 (5M, 7F) | 12 (5M, 7F) | 12 (5M, 7F) |
|
| |||
| Age (years) | 76.7 (71.3 – 82.0) | 76.5 (72.3 – 80.7) | 74.8 (69.6 – 79.9) |
|
| |||
| BMI (kg·m−2) | 26.8 (24.9 – 28.8) | 26.8 (24.4 – 29.2) | 26.2 (24.0 – 28.3) |
|
| |||
| MMSE | 28.5 (27.2 – 29.8) | 28.0 (27.0 – 29.0) | 28.3 (27.7 – 29.0) |
| METS | 6.9 (5.3 – 8.5) | 8.3 (7.1 – 9.5) | 8.1 (6.2 – 9.9) |
| Overall QOL | 4.83 (4.59 – 5.00)γ | 4.33 (4.02 – 4.65) | 4.67 (4.35 – 4.98) |
| General Health | 4.42 (4.09 – 4.74)γ | 3.83 (3.30 – 4.36) | 4.42 (4.09 – 4.74) |
Data are displayed as mean (95% confidence interval).
Denotes significant difference from the BFR group (P<.05).
BMI: body mass index; MMSE: Mini-Mental State Exam; METS: maximum Metabolic Equivalents achieved during exercise stress test; QOL: quality of life
2.3 Exercise Intervention
The participants underwent 12-weeks of twice per week supervised resistance training using a seated leg extension (LE) and leg curl (LC) machine (Body Solid GCEC340, Forest Park, IL) and horizontal leg press (LP) machine (Body Solid GLP-STK, Forest Park, IL). The exercise session consisted of a warm-up of 10 repetitions at a very light weight (~5% of 1-RM) and progressed into three sets of each exercise performed to volitional failure with 60 s of rest between sets and three minutes between exercises. Volitional failure occurred when the individual could not complete full range of motion. The participants performed only one set of each exercise for the first week, two sets the second week and three sets for the remainder of the study. The participants assigned to the HL group performed the lower body exercises listed above at 70% of an estimated 1-RM. The concentric and eccentric portions of the exercise movement lasted three seconds (a rate of 20 contractions per minute) and were controlled by a metronome. Exercise load was progressed by 2–5 kg when participants were able to perform more than 15 repetitions for at least two sets of exercise on a given day. Participants assigned to the BFR training group performed the LE and LC exercise at 30% of estimated 1-RM while the LP exercise was performed at 50% of estimated 1-RM. The load of 50% was chosen due to inability to restrict blood flow to the gluteal muscles involved in this exercise. The blood flow restriction was applied to the proximal portion of the leg utilizing 6 × 83 cm pneumatic tourniquet cuffs (D.E. Hokanson, Inc., Bellevue, WA) that were inflated before exercise (Hokanson TD312 Calculating Cuff Inflator, Bellevue, WA). The cuff was set at approximately 1.5 times brachial systolic blood pressure with an average pressure of 184±25 mmHg applied to the participants. The blood flow restriction cuffs remained inflated during each exercise and the rest between sets which resulted in approximately 5 minutes of restriction time per exercise. The cuffs were deflated for the three-minute rest periods between exercises. Exercise load was progressed by approximately 2–5 kg when participants were able to perform more than 30 repetitions for at least two sets of exercise on a given day. Participants assigned to the CON group performed a standardized upper-extremity static flexibility and light resistance training program two times per week for 12-weeks resulting in equal contact time with the investigators. Three sets of stretches of the neck, torso, back, chest, shoulders and arms were performed as well as biceps curl, triceps extension, and shoulder raise exercises with light dumbbells (≤ 2.27 kg) and resistance bands.
2.4 Measurements
Strength, CSA, physical function and QOL were assessed prior to the intervention and at 6-weeks and 12-weeks of training. The testing was spread out over four days that included: a magnetic resonance imaging (MRI) scan to determine CSA; strength testing on the dynamometer; 1-RM testing; and physical function and QOL measures. The mid and post testing began two to four days after the last exercise training session.
The average CSA of the quadriceps muscle group was obtained through serial axial magnetic resonance imaging (MRI) scans. CSA was obtained from the upper leg (greater trochanter to patella) using a 1.5-T Phillips Intera whole body scanner with software Release 11 (Phillips Medical Systems, Bothell, WA). Ten mm-thick transaxial images (2122-ms repetition time, 10.12-mm slice-to-slice interval) were taken after a 30-minute supine rest period to allow for fluid equilibration. The images were transferred to a computer for calculation of muscle CSA using the National Institutes of Health ImageJ software (1). The research technician was blinded to participants’ group assignments and time points of MRI scan. To calculate CSA (cm2) of the quadriceps all the images were traced from the appearance of the distal portion of the rectus femoris to the appearance of the femoral neck. The same number of slices using the anatomical landmarks was measured for each particular subject at each of the testing time points (~10±1 images). Measurements were performed in duplicate and the average CSA of the quadriceps was used in the analysis. The test-retest reliability of CSA of the quadriceps was previously determined to have an intraclass correlation coefficient (ICC) of 0.99 (6).
Unilateral, isometric maximum voluntary contraction (MVC) torque at 60° of extension was assessed on the right knee extensors on the same isokinetic dynamometer used for screening. Participants were instructed to produce as much force, as quickly as possible, for a 3-s maximal contraction following an auditory cue. Additionally, isokinetic, unilateral knee extension exercises at 60°·s−1 on the right leg were performed to calculate STW ratio. Three trials of isometric and isokinetic contractions were performed and the last two contractions were averaged. The trial-to-trial ICC of the MVC and isokinetic strength was 0.99 for each variable.
1-RM was estimated using the 10-RM approach. Briefly, participants first performed a light warm-up on the LE, LC, and LP machines. Load was progressively increased until participants could perform 10 or fewer repetitions. 1-RM was then predicted using the Brzycki equation. Previous research has shown the Brzycki equation to result in −1.2 kg bias (0.99 ICC) in the knee extension exercise and 3.8 kg bias (0.96 ICC) in the leg press exercise when compared to 1-RM testing (28). The predicted 1-RM strength values were initially used to set the exercise load for the resistance training protocols (70% of 1-RM for HL training and 30% of 1-RM for BFR training). Predicted 1-RM from a 10-RM test was also used to further adjust workout loads after 6-weeks of training and to assess strength changes following the interventions.
The SPPB was used to assess the participants’ abilities to complete chair stands, balance tests and a 4-m walk. The standing balance portion required participants to maintain a side-by-side, semi-tandem, and tandem stance for 10 seconds. The fastest time of two 4-m usual-pace walk trials was recorded. Participants performed five chair stand repetitions with their arms across their chest and the time to complete this task was recorded. Categorical scores from 0–4 for each task were determined and the sum of the three components composed the SPPB score that can range from 0 to 12; with 12 indicating the highest degree of lower extremity functioning (31).
Participants completed the 400-m Long Distance Corridor Walk (30). This was performed on a 20-m course marked with cones and participants were advised to “walk 10 laps, as quickly as possible, at a pace you can maintain” without the use of assistive devices. Participants were allowed to stop and rest in place (<2 minutes) if needed. Time to complete the 400-m walk was recorded and walking speed was calculated.
QOL was measured using the World Health Organization Quality of Life (WHOQOL-BREF) assessment. This structured questionnaire consists of two questions regarding overall QOL and general health plus 24 items that make up four domains: physical health, psychological health, social relationship, and environment (32). Responses ranged from 1–5. Participants completed the surveys independently and raw domain scores were log transformed and presented on a scale of 0–100.
2.5 Statistical Analyses
The proposed sample size for this study was based on a previous study in which older adults completed HL and BFR resistance training of the quadriceps femoris (16). Based on a power analysis from the data on knee extension strength after BFR (η2=0.15) or HL (η2=0.34) resistance training for 6 weeks (16), the number of subjects needed for each group was 8 participants (alpha=0.05, power=0.8, correlation between measures=0.5; G*Power 3.1.0, Universitat Kiel, Germany). Data are expressed as mean difference with 95% confidence intervals. Two-way repeated measures analysis of variance (ANOVA) procedures were used to detect differences in the dependent variables (1-RM in LE, LC, and LP, MVC, STW ratio, CSA, SPPB and 400-m walk speed) with respect to the within-subjects independent variable (pre, mid, post-training) and the between subjects factor (HL, BFR, CON). Changes in the dependent variables from pre-to-mid, mid-to-post and pre-to-post, expressed as mean differences with 95% confidence intervals, were assessed with one-way ANOVAs and Tukey post hoc tests to compare the mean differences. An alpha level of 0.05 was required for statistical significance. Statistics were computed using IBM SPSS Statistics version 23.0 (Chicago, IL).
3. Results
3.1 Participant Characteristics
The participants that were randomized to the interventions did not differ in anthropometric, physical function and strength measurements at the beginning of the study (P>.05; Table 1). The average strength values and 95% confidence intervals for the entire sample were as follows: LE 1-RM: 36.8 kg (30.4–43.1), LC 1-RM: 27.1 kg (23.6–30.6), LP 1-RM: 117.3 kg (99.7–135.8), MVC: 110.5 Nm (96.3–124.5), and STW ratio: 1.14 Nm·kg−1 (1.03–1.26). The average CSA of the quadriceps of the sample was 45.5 cm2 (41.4–49.7). The SPPB score averaged 10.2 (9.5–10.9) out of a possible 12 points and the average 400-m walk speed at the beginning of the study was 1.31 m·s−1 (1.23–1.40). The HL group tended to rate their QOL and overall health higher than the BFR training group at the onset of the study (P=.04 and P=.05, respectively) (Table 1). There was a 95% compliance rate in the HL training group as one participant dropped out of the study after 4 weeks due to an injury not related to the study. There was a 96% compliance rate in the BFR training group as two participants ceased training after 10 weeks due to a fall and illness not related to the study protocol. There was 100% compliance in the CON group. All dropouts completed the post testing prior to study completion.
3.2 Strength and CSA
Over the course of the 12-weeks of resistance training there were significant group × time interactions for 1-RM values in the LE, LC and LP exercises, MVC and CSA (P<.01 for all variables). There were significant main effects of time (P<.05) for all dependent variables except SPPB and there were no main effects of group for any variable (P>.05).
Within the first 6-weeks of training, the HL group had significant strength increases in all 1-RM tests (average of 26%), MVC (16%), STW ratio (8%), and CSA (3.6%) and the magnitude of these gains were all greater than the CON group (P<0.05; Table 2). At this time the HL group also had greater improvements in LP 1-RM and MVC strength than the BFR group (P<.01). The BFR group had significant strength increases in the LE and LP 1-RM tests (24% and 12%, respectively) and CSA (4.3%) and these improvements were greater than those experienced by the CON group (P<.05; Table 2).
Table 2.
Mean difference (95% confidence intervals) for muscle strength, muscle size, and physical function from baseline to 6-weeks between high-load (HL) resistance training, low-load blood flow restricted (BFR) resistance training, or attention control (CON).
| HL | BFR | CON | P | |
|---|---|---|---|---|
| Muscle Strength | ||||
| LE 1-RM (kg) | 12.3 (6.0 – 18.6)+* | 8.3 (5.0 – 11.7)+* | 0.8 (−1.6 – 3.1) | <.01 |
| LC 1-RM (kg) | 6.6 (3.9 – 9.2)+* | 3.5 (0.8 – 6.2)* | −0.7 (−3.4 – 2.0) | <.01 |
| LP 1-RM (kg) | 22.5 (11.8 – 33.1)+*γ | 7.3 (1.7 – 12.9)+* | −6.0 (−15.6 – 3.6) | <.01 |
| MVC (Nm) | 20.0 (11.9 – 28.1)+*γ | −0.4 (−8.0 – 7.2) | 2.1 (−6.2 – 10.5) | <.01 |
| STW ratio (Nm·kg−1) | 0.11 (0.03 – 0.17)+* | 0.01 (−0.09 – 0.11) | −0.05 (−0.16 – 0.06) | .05 |
| Muscle Size | ||||
| CSA (cm2) | 1.65 (0.70 – 2.60)+* | 1.97 (1.22 – 2.72)+* | −0.78 (−1.65 – 0.10) | <.01 |
| Physical Function | ||||
| SPPB | 0.00 (−0.52 – 0.52) | 0.33 (−0.45 – 1.11) | 0.58 (0.16 – 1.01) | .33 |
| 400-m walk (m·s−1) | 0.03 (−0.03 – 0.08) | 0.10 (−0.09 – 0.11) | −0.05 (−0.16 – 0.06) | .55 |
LE 1-RM: leg extension predicted one-repetition maximum; LC 1-RM: leg curl predicted one-repetition maximum; LP 1-RM: leg press predicted one-repetition maximum; MVC: maximum voluntary contraction; STW: strength-to-weight; CSA: cross-sectional area; SPPB: Short Physical Performance Battery
denotes significant mean difference from baseline to 6-weeks of training (P<.05)
denotes significantly different from CON (P<.05)
denotes HL is significantly different from BFR (P<.05)
From 6 to 12 weeks of training the HL training group experienced approximately 18% additional gains in LE 1-RM and this was significantly greater than the changes in the BFR (P=.02) and CON (P=.01) groups. MVC and CSA did not improve significantly in any training group and the magnitude of change was similar between groups (Table 3).
Table 3.
Mean difference (95% confidence intervals) for muscle strength, muscle size, and physical function from 6 to 12-weeks between high-load (HL) resistance training, low-load blood flow restricted (BFR) resistance training, or attention control (CON).
| HL | BFR | CON | P | |
|---|---|---|---|---|
| Muscle Strength | ||||
| LE-1RM (kg) | 9.2 (4.5 – 13.9)+*γ | 0.8 (−4.9 – 6.4) | −0.2 (−3.4 – 3.0) | <.01 |
| LC 1-RM (kg) | 2.2 (0.4 – 4.1) | 1.8 (−1.4 – 5.2) | 1.1 (−1.4 – 3.7) | .82 |
| LP 1-RM (kg) | 11.0 (−4.4 – 26.4) | 11.4 (1.2 – 21.6) | 5.8 (−2.6 – 14.2) | .70 |
| MVC (Nm) | 2.2 (−2.8 – 7.2) | 11.6 (1.8 – 21.4) | 1.4 (−7.5 – 10.3) | .12 |
| STW ratio (Nm·kg−1) | 0.11 (−0.06 – 0.27) | 0.08 (0.01 – 0.15) | 0.09 (−0.03 – 0.21) | .93 |
| Muscle Size | ||||
| CSA (cm2) | 1.31 (0.07 – 2.56) | 1.26 (−0.33 – 2.84) | 0.85 (0.27 – 1.43) | .81 |
| Physical Function | ||||
| SPPB | −0.09 (−0.85 – 0.67) | 0.33 (−0.35 – 1.01) | 0.25 (−0.42 – 0.92) | .62 |
| 400-m walk (m·s−1) | −0.01 (−0.08 – 0.07) | 0.03 (0.00 – 0.06) | 0.04 (0.00 – 0.08) | .39 |
LE 1-RM: leg extension predicted one-repetition maximum; LC 1-RM: leg curl predicted one-repetition maximum; LP 1-RM: leg press predicted one-repetition maximum; MVC: maximum voluntary contraction; STW: strength-to-weight; CSA: cross-sectional area; SPPB: Short Physical Performance Battery
denotes significant mean difference from 6-weeks to 12-weeks of training (P<.05)
denotes significantly different from CON (P<.05)
denotes HL is significantly different from BFR (P<.05).
The overall improvements from baseline to 12-weeks of exercise training indicated that HL training resulted in significantly greater improvements in LE, LC and LP 1-RM and CSA than the CON group (P<.05) and more strength gains in the LE 1-RM than the BFR group (P=.01). The BFR training group gained significantly more muscle mass than the CON group (P<.01) (Table 4).
Table 4.
Mean difference (95% confidence intervals) for muscle strength, muscle size, and physical function from baseline to 12-weeks between high-load (HL) resistance training, low-load blood flow restricted (BFR) resistance training, or attention control (CON).
| HL | BFR | CON | P | |
|---|---|---|---|---|
| Muscle Strength | ||||
| LE-1RM (kg) | 21.2 (13.0 – 29.5)+*γ | 9.1 (5.0 – 13.2)+ | 0.6 (−4.2 – 5.3) | <.01 |
| LC 1-RM (kg) | 8.2 (5.4 – 11.1)+* | 5.4 (0.5 – 10.2) | 0.4 (−1.0 – 1.8) | <.01 |
| LP 1-RM (kg) | 31.7 (13.6 – 50.0)+* | 18.7 (9.0 – 28.4)+ | −0.2 (−10.4 – 10.1) | <.01 |
| MVC (Nm) | 19.3 (8.3 – 30.3)+ | 11.2 (−2.7 – 25.0) | 3.5 (−7.3 – 14.3) | .14 |
| STW ratio (Nm·kg−1) | 0.17 (0.01 – 0.33)+ | 0.09 (0.00 – 0.17) | 0.04 (−0.08 – 0.17) | .31 |
| Muscle Size | ||||
| CSA (cm2) | 2.86 (1.87 – 3.86)+* | 3.23 (1.29 – 5.16)+* | 0.07 (−0.67 – 0.82) | <.01 |
| Physical Function | ||||
| SPPB | 0.00 (−0.86 – 0.86) | 0.67 (−0.07 – 1.40) | 0.83 (0.03 – 1.64) | .24 |
| 400-m walk (m·s−1) | 0.02 (−0.05 – 0.09) | 0.09 (0.00 – 0.17) | 0.44 (−0.08 – 0.17) | .31 |
LE 1-RM: leg extension predicted one-repetition maximum; LC 1-RM: leg curl predicted one-repetition maximum; LP 1-RM: leg press predicted one-repetition maximum; MVC: maximum voluntary contraction; STW: strength-to-weight; CSA: cross-sectional area; SPPB: Short Physical Performance Battery
denotes significant mean difference from baseline to 12-weeks of training (P<.05)
denotes significantly different from CON (P<.05)
denotes HL is significantly different from BFR (P<.05).
3.3 Physical Function and Quality of Life
There were main effects of time for 400m walking speed, chair rise categorical ranking within the SPPB and 4-m walk time within the SPPB. 400-m walking speed improved an average of 3.5% across the sample (P=.007). Chair rise categorical ranking within the SPPB improved from 2.72 (2.3–3.1) to 3.11 (2.73–3.49) (P=.011) and 4-m walk time tended to improve from 3.8 s (3.6–4.0) to 3.6 s (3.4–3.8P (P=.05) but overall SPPB scores did not change in any group over the course of the study (P=.33). For QOL, pre-values for all participants collapsed over groups were 64.3 ± 7.4 for the Physical Domain, 71.2 ± 6.6 for the Psychological Domain, 76.1 ± 15.8 for the Social Domain and 89.2 ± 9.2 for the Environmental Domain. QOL, General Health, and the four QOL domains remained consistent throughout the study in all groups, even after adjusting for differences in pre QOL and pre overall health (P>.05; Table 5).
Table 5.
Mean difference (95% confidence intervals) for WHOQOL-BREF from baseline to 12-weeks between high-load (HL) resistance training, low-load blood flow restricted (BFR) resistance training, or attention control (CON).
| HL | BFR | CON | P | |
|---|---|---|---|---|
| Overall QOL | −.17 (−.53 – .20) | .00 (−.30 – .30) | −.08 (−.51 – .79) | .79 |
| General Health | −.00 (−.27 – .27) | .27 (−.26 – .80) | .06 (−.59 – .42) | .44 |
| Domain 1: Physical | −2.7 (−9.7 – 4.4) | .52 (−10.6 – 11.7) | .25 (−3.9 – 4.4) | .78 |
| Domain 2: Psychological | −1.0 (−6.4 – 4.4) | −.80 (−10.7 – 9.1) | −2.1 (−8.4 – 4.2) | .96 |
| Domain 3: Social | 3.2 (−8.6 – 14.9) | 3.5 (−6.4 – 13.5) | 6.0 (−14.5 – 26.5) | .95 |
| Domain 4: Environmental | −3.7 (−8.3 – 1.1) | 1.2 (−6.4 – 8.8) | −1.1 (−7.3 – 5.1) | .48 |
QOL: Quality of Life
4. Discussion
The main findings of this training study were that 1.) measures of muscle strength and CSA in the HL group significantly improved within 6-weeks and were maintained at 12-weeks to a greater extent than the CON group; 2.) BFR training increased LE and LP 1-RM strength and CSA within 6-weeks and at the conclusion of training the changes in LP-1-RM and CSA were of similar extent to HL training; and 3.) neither of the training programs resulted in enhanced physical function and QOL.
The magnitude of muscle hypertrophy following HL and BFR training (~3 cm2) appears to be extremely consistent within the literature as many other studies collectively indicate that engaging in each type of training over 5–12 weeks increases CSA or muscle thickness by 6–8% (10, 20, 27). However, while gains in muscle strength following HL and BFR resistance training programs are commonly reported by researchers (10, 16, 18, 20, 27, 35), the magnitude of the gains are disparate. For example, Laurentino et al. (20) found similar improvements in LE 1-RM strength (36%) following 8-weeks of HL or BFR training, and Ellefsen et al. (10) reported LE 1-RM increases of 12% and 10% following 12-weeks of HL and BFR training, respectively. However, Martín-Hernández et al. (27) reported greater 1-RM strength following 5-weeks of HL training (19%) than BFR training (7%).
In the present study, while we found that HL training resulted in almost double the strength improvements as BFR training in most measurements, only the LP 1-RM and MVC were statistically different than BFR at 6 weeks and only the LE 1-RM was different from BFR at 12 weeks. Most of the HL and BFR 1-RM strength adaptations were apparent within the first 6-weeks of training and few improvements were seen from 6–12 weeks. The HL training group had greater 1-RM strength gains than the CON group at the end of the study, whereas the BFR training group’s strength gains were not statistically different than the CON group. Since the 1-RM strength tests used loads similar to those employed in the HL training program, 1-RM testing may have been more sensitive to the strength improvement of HL training than the BFR training that was performed at lighter loads. Instead, the isometric MVC strength measure may be a more neutral test to assess whether HL training was superior to BFR training as it is less specific to the two training programs to (4). After the first 6-weeks of training, the HL group experienced significantly greater improvement (16%) in MVC than the CON (2%) and BFR (0%) groups. Conversely, the BFR group increase MVC strength by 10% from 6–12 weeks, such that when comparing MVC strength gains from the beginning to end of the study there were no longer statistical differences between the HL (18%) and BFR (10%) groups. Remarkably, neither of the improvements in MVC was statistically different than the 4% change demonstrated in the CON group, likely due to the variability of the training response and the strength gains that occurred in some CON group members in response to repeated exposure to maximal contractions during strength testing. As proposed by Loenneke et al. (23), the delayed gains in strength with BFR training suggest the possibility that strength and hypertrophy adaptations are reversed in BFR training such that neural gains typically evident at the onset of HL training do not occur until later in the BFR training program, thus delaying strength gains, and in this case equalizing adaptations following 12-weeks of HL and BFR training. From a practical standpoint, these data suggest that in the early stages of a lower-extremity resistance exercise program, HL may elicit greater increases in strength. Yet, compared to a control group, BFR exercise did improve strength which suggests it may be a good short term modality for those unable to participate in HL exercise.
Two prior studies have implemented lower body BFR resistance exercise in older adults. Karabulut et al. (16) found that leg press and leg extension 1-RM increased approximately 20–30% following BFR training in males aged 50–64 years and Vechin et al. (35) reported that older adults with an average age of 64 years experienced a 17% improvement in leg press 1-RM strength and 7% increase in quadriceps CSA. The degree of the strength adaptations were similar to those of the present study (ie. ~23% increase in LE) but only at the 6-week time point. The 7% increase in CSA in our study matched the growth reported by Vechin et al. (35). A limiting factor of the previous studies was that even though control groups were included in the studies, the amount of the strength gains and hypertrophy following BFR and HL training were not compared the controls, as they were in the present study. Nonetheless, the previous and present research studies indicate that older adults can participate in BFR resistance training and see beneficial results within 6-weeks. None of the participants in our study experienced adverse events or injuries from BFR training. While our participants were classified as being at risk of mobility limitations, they were apparently healthy and free from disease as determined by our inclusion criteria and screening processes. Based on the results of this study, BFR exercise can be a viable alternative to HL training to improve strength and CSA in older adults. BFR exercise may best be implemented when older adults are in situations in which HL training in contraindicated, such as acute injuries or post-surgical situations. After short-term BFR training (~6-weeks) it may be beneficial for them to engage in HL training for continued improvements. We must recognize the limitations of this exercise as the BFR training is constrained to arm and leg muscles and there are risks of bruising, numbness, venous thrombosis and adverse cardiovascular responses (25). Since our participants were rather healthy and comprehensively screened, we recommend further research on the prolonged use of BFR exercise in older adults with other medical conditions before using this type of training universally.
We hypothesized that increasing muscle strength and mass would result in enhanced physical function in older adults classified as being at risk of mobility limitations because HL resistance training has been shown to lead to faster maximal walking speeds in older adults (5, 11). However, Manini et al. (24) reported no change in walking speed following HL resistance training and suggested that training adaptations are task-specific. In the present study, there was an overall 3% improvement in walking speed across all subjects and groups (including CON) which translates to an approximate 20 second improvement in the completion time of the Long Distance Corridor Walk. While statistically significant, it does not reflect a substantial meaningful change (50–60 s) in function (19). It is possible that the increased walking speed could be attributed to the potential overall rise in the time spent outside of the home and higher physical activity and fitness levels from participating in the research study. The twice per week visits to the laboratory included an approximate 0.2 km walk for all subjects, even those in the CON group, to attend the training sessions. The SPPB, did not change in any group following the 12-weeks of training, despite the chair rise categorical ranking and 4-m walk time improving slightly among the entire sample. It should be noted that the mean scores of the sample on the SPPB prior to training was approximately 10 out of a maximum of 12 demonstrating an already high level of physical function, despite these participants being identified as weak individuals, at risk of a mobility limitation, and in need of strength training. The successful completion of tests of physical function require individuals to have a minimum threshold of leg muscle strength and oftentimes additional increases in muscle strength above the thresholds may not translate into further enhancements in physical function (15, 26). While the participants in our study were classified as being weak and at risk of mobility limitations, it is important to note that they did not necessarily possess mobility limitations. It should also be considered that the loss of knee extensor muscle strength due to aging does not play as large a role in mobility as strength of the plantar flexors. Beijersbergen et al. (2) suggested that improving maximal strength of the hip and knee muscles may not greatly affect walking speed because their relative contributions to walking is low compared to the prominent role that the plantar flexors play. Thus, targeting the plantar flexors in a resistance training program may be more important to mobility than the knee extensors.
Despite improvements in muscle strength and size following HL and BFR training, the survey measurement of QOL did not change in response to HL or BFR resistance training. Our results are contrary to Haralstad et al. (14) who reported improvements in physical and general health in older males after 12-weeks of HL resistance training, yet similar to Bonganha et al. (3) who found strength improvements in postmenopausal women after HL resistance training without changes in QOL. Although the participants in our study were weak and classified as being at risk of developing mobility limitations, they rated their QOL prior to the study at 4.6/5.0, which is a high score with little capacity to improve. This does not necessarily indicate that there were no beneficial aspects of resistance training on QOL, as increased social interaction and positive psychological and physical effects not have been effectively evaluated through a survey (14). Future studies could target older adults with lower QOL scores and perhaps implement a comprehensive group exercise program targeting the QOL domains. Additionally, sensitive measures, such as qualitative methodologies, could better describe improvements in QOL and perceived benefits of resistance training.
The main strengths of this study were the high-compliance rates and the premise to include older adults that were classified as being at risk of mobility limitations. However, we acknowledge the limitation that our participants did not present with poor physical function and QOL, despite having muscle weakness, and therefore improvements were not observed for these measures. It should also be considered that the strength tests utilized in this study were more specific to the HL exercise as participants were tested using high loads. Implementing a low-load endurance protocol may be more specific to the training performed by the BFR group and may have resulted in adaptations different than the HL group. Finally, the 1-RM was not directly measured in this study, but 10-RM prediction tests have been shown to accurately match 1-RM estimates and were likely safer for the older, novice exercisers in our study (28).
In this study that compared the adaptations to HL and BFR resistance exercise in older adults at risk of mobility limitations it was found that both training programs resulted in muscle strength and CSA improvements that did not specifically transfer to improvements in QOL and walking speed. Because HL resulted in more rapid strength adaptations, future studies should consider how HL and BFR training programs could be used in combination to augment muscle strength and possibly physical function in specific health conditions in older adults.
Highlights.
High-load and low-load blood flow restricted resistance training was compared.
Both training programs resulted in similar cross-sectional area of the quadriceps.
Most strength adaptations were apparent within 6-weeks.
Strength was highest after high-load training but not different than blood flow restricted training.
Training did not impact physical function and quality of life in older adults.
Acknowledgments
This study was supported by the National Institute on Aging of the National Institutes of Health under award number R15 AG040700-01A1 awarded to SB Cook. The content is solely the responsibility of the authors and does not necessarily represent the official views of the National Institutes of Health.
The authors sincerely thank the undergraduate research assistants and participants for their contributions to the study. The authors also thank the MRI technicians, Shannon Savoie and Jess Michaud, from Seacoast Orthopedics & Sports Medicine in Somersworth, NH for their expertise and professionalism within this study.
Funding for the present study was provided by National Institutes of Health Grant 1R15 A6040700-01A1
Footnotes
Publisher's Disclaimer: This is a PDF file of an unedited manuscript that has been accepted for publication. As a service to our customers we are providing this early version of the manuscript. The manuscript will undergo copyediting, typesetting, and review of the resulting proof before it is published in its final citable form. Please note that during the production process errors may be discovered which could affect the content, and all legal disclaimers that apply to the journal pertain.
CONFLICTS OF INTEREST
The authors report no conflicts of interest.
There are no professional relationships with companies or manufacturers who will benefit from the results of the present study. The results of the study are presented clearly, honestly, and without fabrication, falsification, or inappropriate data manipulation.
References
- 1.Abramoff M, Magalhaes P, Ram S. Image processing with ImageJ. Biophotonics Int. 2004;11(7):36–42. [Google Scholar]
- 2.Beijersbergen CMI, Granacher U, Vandervoort AA, DeVita P, Hortobágyi T. The biomechanical mechanism of how strength and power training improves walking speed in old adults remains unknown. Ageing Res Rev. 2013;12(2):618–27. doi: 10.1016/j.arr.2013.03.001. [DOI] [PubMed] [Google Scholar]
- 3.Bonganha V, Modeneze DM, Madruga VA, Vilarta R. Effects of resistance training (RT) on body composition, muscle strength and quality of life (QoL) in postmenopausal life. Arch Gerontol Geriatr. 2012;54(2):361–5. doi: 10.1016/j.archger.2011.04.006. [DOI] [PubMed] [Google Scholar]
- 4.Buckner SL, Jessee MB, Mattocks KT, et al. Determining Strength: A Case for Multiple Methods of Measurement. Sports Med Auckl NZ. 2017;47(2):193–5. doi: 10.1007/s40279-016-0580-3. [DOI] [PubMed] [Google Scholar]
- 5.Capodaglio P, Capodaglio Edda M, Facioli M, Saibene F. Long-term strength training for community-dwelling people over 75: impact on muscle function, functional ability and life style. Eur J Appl Physiol. 2007;100(5):535–42. doi: 10.1007/s00421-006-0195-8. [DOI] [PubMed] [Google Scholar]
- 6.Cook SB, Brown KA, Deruisseau K, Kanaley JA, Ploutz-Snyder LL. Skeletal muscle adaptations following blood flow-restricted training during 30 days of muscular unloading. J Appl Physiol Bethesda Md 1985. 2010;109(2):341–9. doi: 10.1152/japplphysiol.01288.2009. [DOI] [PubMed] [Google Scholar]
- 7.Correa CS, Cunha G, Marques N, Oliveira-Reischak Ã, Pinto R. Effects of strength training, detraining and retraining in muscle strength, hypertrophy and functional tasks in older female adults. Clin Physiol Funct Imaging. 2016;36(4):306–10. doi: 10.1111/cpf.12230. [DOI] [PubMed] [Google Scholar]
- 8.Cress ME, Buchner DM, Questad KA, Esselman PC, deLateur BJ, Schwartz RS. Exercise: effects on physical functional performance in independent older adults. J Gerontol A Biol Sci Med Sci. 1999;54(5):M242–248. doi: 10.1093/gerona/54.5.m242. [DOI] [PubMed] [Google Scholar]
- 9.Cress ME, Meyer M. Maximal voluntary and functional performance levels needed for independence in adults aged 65 to 97 years. Phys Ther. 2003;83(1):37–48. [PubMed] [Google Scholar]
- 10.Ellefsen S, Hammarström D, Strand TA, et al. Blood flow-restricted strength training displays high functional and biological efficacy in women: a within-subject comparison with high-load strength training. Am J Physiol Regul Integr Comp Physiol. 2015;309(7):R767–779. doi: 10.1152/ajpregu.00497.2014. [DOI] [PMC free article] [PubMed] [Google Scholar]
- 11.Fiatarone MA, O’Neill EF, Ryan ND, et al. Exercise training and nutritional supplementation for physical frailty in very elderly people. N Engl J Med. 1994;330(25):1769–75. doi: 10.1056/NEJM199406233302501. [DOI] [PubMed] [Google Scholar]
- 12.Fusco O, Ferrini A, Santoro M, Lo Monaco MR, Gambassi G, Cesari M. Physical function and perceived quality of life in older persons. Aging Clin Exp Res. 2012;24(1):68–73. doi: 10.1007/BF03325356. [DOI] [PubMed] [Google Scholar]
- 13.Garber CE, Blissmer B, Deschenes MR, et al. American College of Sports Medicine position stand. Quantity and quality of exercise for developing and maintaining cardiorespiratory, musculoskeletal, and neuromotor fitness in apparently healthy adults: guidance for prescribing exercise. Med Sci Sports Exerc. 2011;43(7):1334–59. doi: 10.1249/MSS.0b013e318213fefb. [DOI] [PubMed] [Google Scholar]
- 14.Haraldstad K, Rohde G, Stea TH, et al. Changes in health-related quality of life in elderly men after 12 weeks of strength training. Eur Rev Aging Phys Act Off J Eur Group Res Elder Phys Act. 2017;14:8. doi: 10.1186/s11556-017-0177-3. [DOI] [PMC free article] [PubMed] [Google Scholar]
- 15.Kalapotharakos VI, Diamantopoulos K, Tokmakidis SP. Effects of resistance training and detraining on muscle strength and functional performance of older adults aged 80 to 88 years. Aging Clin Exp Res. 2010;22(2):134–40. doi: 10.1007/BF03324786. [DOI] [PubMed] [Google Scholar]
- 16.Karabulut M, Abe T, Sato Y, Bemben MG. The effects of low-intensity resistance training with vascular restriction on leg muscle strength in older men. Eur J Appl Physiol. 2010;108(1):147–55. doi: 10.1007/s00421-009-1204-5. [DOI] [PubMed] [Google Scholar]
- 17.Kim K-E, Jang S-N, Lim S, et al. Relationship between muscle mass and physical performance: is it the same in older adults with weak muscle strength? Age Ageing. 2012;41(6):799–803. doi: 10.1093/ageing/afs115. [DOI] [PubMed] [Google Scholar]
- 18.Kubo K, Komuro T, Ishiguro N, et al. Effects of low-load resistance training with vascular occlusion on the mechanical properties of muscle and tendon. J Appl Biomech. 2006;22(2):112–9. doi: 10.1123/jab.22.2.112. [DOI] [PubMed] [Google Scholar]
- 19.Kwon S, Perera S, Pahor M, et al. What is a meaningful change in physical performance? Findings from a clinical trial in older adults (the LIFE-P study) J Nutr Health Aging. 2009;13(6):538–44. doi: 10.1007/s12603-009-0104-z. [DOI] [PMC free article] [PubMed] [Google Scholar]
- 20.Laurentino GC, Ugrinowitsch C, Roschel H, et al. Strength training with blood flow restriction diminishes myostatin gene expression. Med Sci Sports Exerc. 2012;44(3):406–12. doi: 10.1249/MSS.0b013e318233b4bc. [DOI] [PubMed] [Google Scholar]
- 21.Legrand D, Vaes B, Matheï C, Adriaensen W, Van Pottelbergh G, Degryse J-M. Muscle strength and physical performance as predictors of mortality, hospitalization, and disability in the oldest old. J Am Geriatr Soc. 2014;62(6):1030–8. doi: 10.1111/jgs.12840. [DOI] [PubMed] [Google Scholar]
- 22.Liu C-J, Latham N. Can progressive resistance strength training reduce physical disability in older adults? A meta-analysis study. Disabil Rehabil. 2011;33(2):87–97. doi: 10.3109/09638288.2010.487145. [DOI] [PubMed] [Google Scholar]
- 23.Loenneke JP, Wilson JM, Marín PJ, Zourdos MC, Bemben MG. Low intensity blood flow restriction training: a meta-analysis. Eur J Appl Physiol. 2012;112(5):1849–59. doi: 10.1007/s00421-011-2167-x. [DOI] [PubMed] [Google Scholar]
- 24.Manini T, Marko M, VanArnam T, et al. Efficacy of resistance and task-specific exercise in older adults who modify tasks of everyday life. J Gerontol A Biol Sci Med Sci. 2007;62(6):616–23. doi: 10.1093/gerona/62.6.616. [DOI] [PubMed] [Google Scholar]
- 25.Manini TM, Clark BC. Blood flow restricted exercise and skeletal muscle health. Exerc Sport Sci Rev. 2009;37(2):78–85. doi: 10.1097/JES.0b013e31819c2e5c. [DOI] [PubMed] [Google Scholar]
- 26.Manini TM, Visser M, Won-Park S, et al. Knee extension strength cutpoints for maintaining mobility. J Am Geriatr Soc. 2007;55(3):451–7. doi: 10.1111/j.1532-5415.2007.01087.x. [DOI] [PubMed] [Google Scholar]
- 27.Martín-Hernández J, Marín PJ, Menéndez H, Ferrero C, Loenneke JP, Herrero AJ. Muscular adaptations after two different volumes of blood flow-restricted training. Scand J Med Sci Sports. 2013;23(2):e114–120. doi: 10.1111/sms.12036. [DOI] [PubMed] [Google Scholar]
- 28.McNair PJ, Colvin M, Reid D. Predicting maximal strength of quadriceps from submaximal performance in individuals with knee joint osteoarthritis. Arthritis Care Res. 2011;63(2):216–22. doi: 10.1002/acr.20368. [DOI] [PubMed] [Google Scholar]
- 29.Peterson MD, Rhea MR, Sen A, Gordon PM. Resistance exercise for muscular strength in older adults: a meta-analysis. Ageing Res Rev. 2010;9(3):226–37. doi: 10.1016/j.arr.2010.03.004. [DOI] [PMC free article] [PubMed] [Google Scholar]
- 30.Rolland YM, Cesari M, Miller ME, Penninx BW, Atkinson HH, Pahor M. Reliability of the 400-m usual-pace walk test as an assessment of mobility limitation in older adults. J Am Geriatr Soc. 2004;52(6):972–6. doi: 10.1111/j.1532-5415.2004.52267.x. [DOI] [PubMed] [Google Scholar]
- 31.Sayers SP, Guralnik JM, Newman AB, Brach JS, Fielding RA. Concordance and discordance between two measures of lower extremity function: 400 meter self-paced walk and SPPB. Aging Clin Exp Res. 2006;18(2):100–6. doi: 10.1007/BF03327424. [DOI] [PubMed] [Google Scholar]
- 32.Skevington SM, Lotfy M, O’Connell KA, WHOQOL Group The World Health Organization’s WHOQOL-BREF quality of life assessment: psychometric properties and results of the international field trial. A report from the WHOQOL group. Qual Life Res Int J Qual Life Asp Treat Care Rehabil. 2004;13(2):299–310. doi: 10.1023/B:QURE.0000018486.91360.00. [DOI] [PubMed] [Google Scholar]
- 33.Studenski SA, Peters KW, Alley DE, et al. The FNIH sarcopenia project: rationale, study description, conference recommendations, and final estimates. J Gerontol A Biol Sci Med Sci. 2014;69(5):547–58. doi: 10.1093/gerona/glu010. [DOI] [PMC free article] [PubMed] [Google Scholar]
- 34.Vasconcelos APSL, Cardozo DC, Lucchetti ALG, Lucchetti G. Comparison of the effect of different modalities of physical exercise on functionality and anthropometric measurements in community-dwelling older women. J Bodyw Mov Ther. 2016;20(4):851–6. doi: 10.1016/j.jbmt.2016.02.010. [DOI] [PubMed] [Google Scholar]
- 35.Vechin FC, Libardi CA, Conceição MS, et al. Comparisons between low-intensity resistance training with blood flow restriction and high-intensity resistance training on quadriceps muscle mass and strength in elderly. J Strength Cond Res. 2015;29(4):1071–6. doi: 10.1519/JSC.0000000000000703. [DOI] [PubMed] [Google Scholar]