Abstract
Lysophosphatidic acid (LPA) functions through activation of LPA receptors (LPARs). LPA–LPAR signaling has been implicated in development of fibrosis. However, the role of LPA–LPAR signaling in development of diabetic nephropathy (DN) has not been studied. We examined whether BMS002, a novel dual LPAR1 and LPAR3 antagonist, affects development of DN in endothelial nitric oxide synthase-knockout db/db mice. Treatment of these mice with BMS002 from 8 to 20 weeks of age led to a significant reduction in albuminuria, similar to that observed with renin-angiotensin system inhibition (losartan plus enalapril). LPAR inhibition also prevented the decline in GFR observed in vehicle-treated mice, such that GFR at week 20 differed significantly between vehicle and LPAR inhibitor groups (P<0.05). LPAR inhibition also reduced histologic glomerular injury; decreased the expression of profibrotic and fibrotic components, including fibronectin, α-smooth muscle actin, connective tissue growth factor, collagen I, and TGF-β; and reduced renal macrophage infiltration and oxidative stress. Notably, LPAR inhibition slowed podocyte loss (podocytes per glomerulus ±SEM at 8 weeks: 667±40, n=4; at 20 weeks: 364±18 with vehicle, n=7, and 536±12 with LPAR inhibition, n=7; P<0.001 versus vehicle). Finally, LPAR inhibition minimized the production of 4-hydroxynonenal (4-HNE), a marker of oxidative stress, in podocytes and increased the phosphorylation of AKT2, an indicator of AKT2 activity, in kidneys. Thus, the LPAR antagonist BMS002 protects against GFR decline and attenuates development of DN through multiple mechanisms. LPAR antagonism might provide complementary beneficial effects to renin-angiotensin system inhibition to slow progression of DN.
Keywords: LPA, autotoxin, macrophage, diabetic nephropathy, AKT2
Lysophosphatidic acid (LPA) is a small and structurally simple glycerophospholipid, with one fatty acid and a phosphate group as its polar head. It is a normal serum constituent and binds to albumin with high affinity. Although originally considered as a component of the plasma membrane and an intermediate in lipid biosynthesis, there is increasing evidence that LPA can mediate a wide range of cellular processes, including cell migration, proliferation and cytoprotection, cytokine and chemokine production, smooth muscle contraction, and platelet aggregation.1 LPA acts through activation of a family of specific G protein–coupled receptors, LPA1–6 or LPAR1–6. There are at least two pathways for LPA production: a direct action of the extracellular enzyme autotaxin (ectonucleotide pyrophosphatase/phosphodiesterase family member 2, ENPP2) on plasma lysophosphatidylcholine to produce LPA and choline, or intracellularly either by sequential activation of phospholipase D and phosphatidic acid–specific phospholipase A or by acylglycerol kinase. Essentially all extracellular LPA results from autotaxin activity.2
LPA has been reported to stimulate proliferation and inhibit apoptosis in mouse renal proximal tubular cells,3 fibroblasts,4 and mesangial cells,5,6 In cultured proximal tubular cells, LPA stimulates the secretion of profibrotic cytokines CTGF and PDGF-B.7 LPA production increases at sites of injury and inflammation and can serve as a potent proinflammatory and profibrotic mediator. In mouse kidneys, the primary LPARs are LPA1, LPA2, and LPA3.8,9 LPA has been reported to contribute to the development of renal tubulointerstitial fibrosis in a unilateral ureteral obstruction model, as well as in the development of skin and lung fibrosis. Either pharmacologic or genetic inhibition of LPA receptor 1 (LPAR1) attenuates development of fibrosis in these models.8,10 However, the role of the autotoxin/LPA/LPA receptor (LPAR) system in diabetic nephropathy has not been previously studied. This study investigated the effect of an LPAR antagonist in a model of accelerated type 2 diabetic nephropathy, endothelial nitric oxide synthase-knockout (eNOS−/−) db/db mice. We found that LPAR antagonism was effective in attenuating development of diabetic nephropathy in association with podocyte protection and increased expression of reparative M2 macrophages.
Results
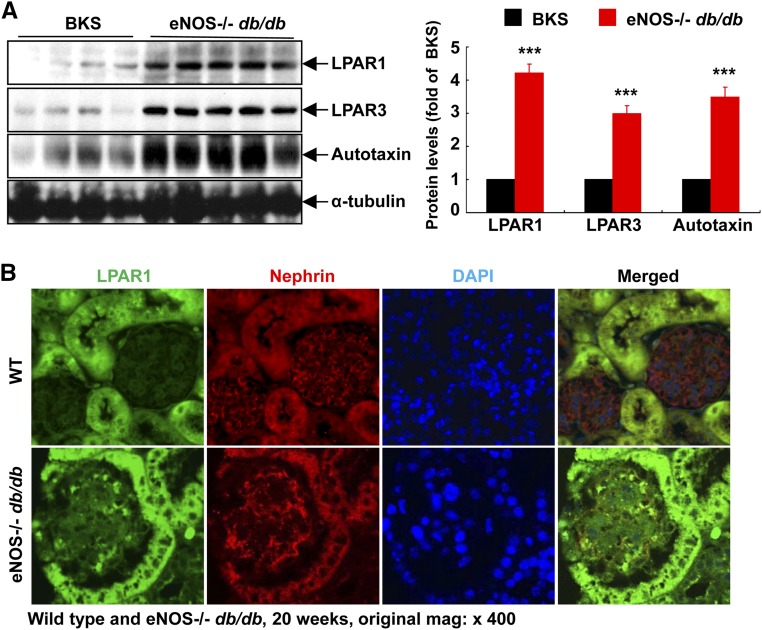
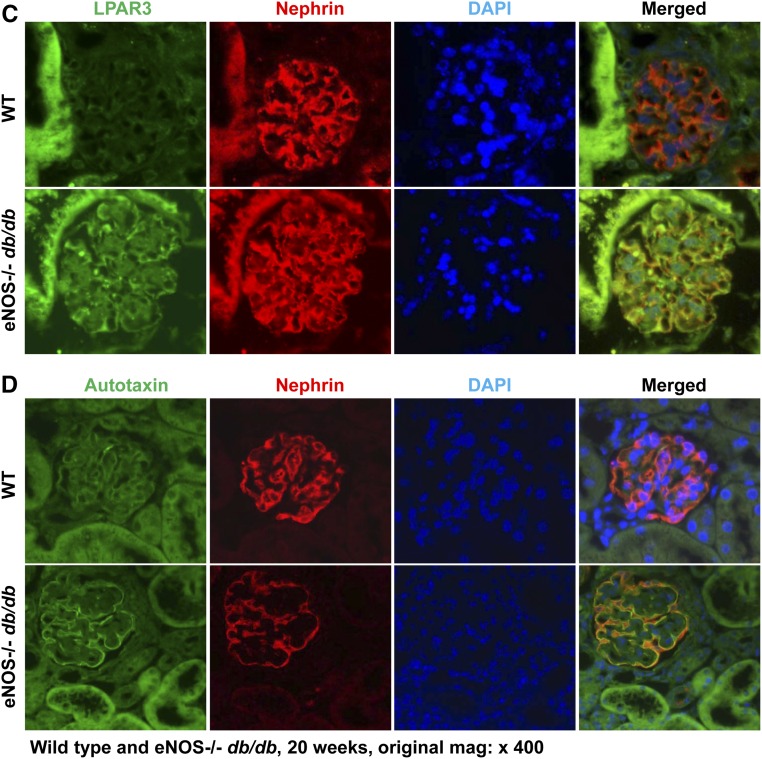
We initially determined the effect of diabetes on the expression of autotaxin and LPARs in the kidney. Immunoblotting showed that the expression levels of LPAR1, LPAR3, and autotaxin, the major source of LPA released from cells, were markedly increased in kidneys of an accelerated model of type 2 diabetic nephropathy (eNOS−/− db/db mice) compared with sex- and age-matched nondiabetic controls (Figure 1A). In nondiabetic mice, LPAR1 and LPA3 were primarily expressed in tubular epithelial cells, with minimal expression in the glomerulus. However, both LPAR1 and LPAR3 expression increased in glomeruli of eNOS−/− db/db mice. Double immunofluorescence staining with nephrin (a marker of podocytes) indicated that the increased expression of LPAR1 and LPAR3 in glomeruli was primarily in podocytes but was also present in other glomerular cell types (Figure 1B). Similarly in nondiabetic mice, autotaxin was expressed at low levels in podocytes, and expression levels increased markedly in eNOS−/− db/db mice (Figure 1C). Furthermore, kidney expression of LPA3 and autotaxin increased from 8 to 24 weeks of age in eNOS−/− db/db mice (Supplemental Figure 1). Therefore, the LPA/LPAR axis is activated in kidneys (particularly in podocytes) in eNOS−/− db/db mice.
Figure 1.
Podocyte LPA signaling is activated in eNOS−/− db/db mice. (A) The renal protein levels of the LPAR1, LPAR3, and autotaxin, the main extracellular enzyme for LPA biosynthesis, were significantly higher in eNOS−/− db/db mice than in control BKS mice. n=4 in BKS group and n=5 in eNOS−/− db/db group. (B–D) LPAR1 (B), LPAR3 (C), and autotaxin (D) were localized to podocytes of mouse glomerulus and their expression was all higher in eNOS−/− db/db mice than in age-matched wild-type mice (20 weeks old). Original magnification, ×400 for all. ***P<0.001.
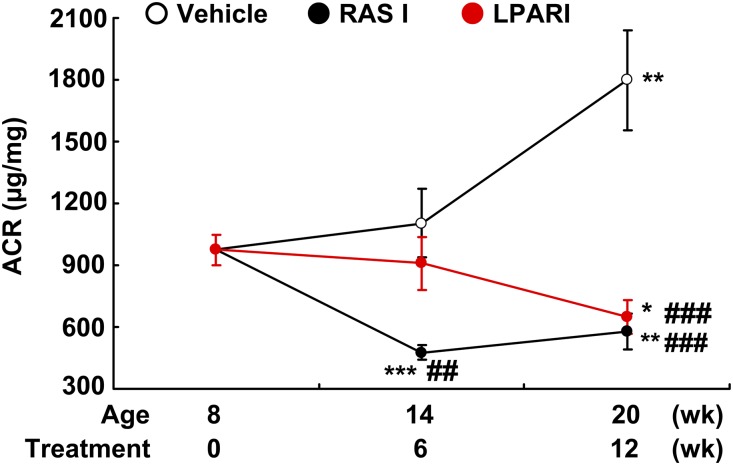
To determine the potential role of LPAR activation in the mediation of diabetic kidney disease, we administered a relatively specific LPAR1/LPAR3 antagonist, BMS002 (a lysophosphatidic acid receptor inhibitor [LPARI]), to eNOS−/− db/db mice from 8 to 20 weeks of age. As a comparator, we treated a subset of mice with a combination of angiotensin-converting enzyme inhibitor and angiotensin receptor blocker (ACEI/ARB) (10 mg/kg per day losartan and 10 mg/kg per day enalapril, an RAS inhibitor). Body weights were comparable among the three groups at both 8 and 20 weeks of age (Supplemental Figure 2). RAS inhibition led to a significant decrease of albuminuria by 6 weeks of treatment, which was sustained without further decrease over the subsequent 6 weeks of treatment (Figure 2). In contrast, LPARI induced only a numerical but nonsignificant decrease in albuminuria after 6 weeks of treatment but induced a further, significant decrease in albuminuria by the end of 12 weeks of treatment (Figure 2). Within 2 weeks of treatment, the RAS inhibitors significantly decreased systolic BP (SBP), whereas BMS002 had no significant early effect on BP as measured with a tail-cuff microphonic manometer (Supplemental Figure 3). The effect of BMS002 on BP was further validated using carotid catheterization measurement in conscious mice (mean BP: 139.6±2.6 versus 136.5±1.1 mm Hg of vehicle; P=0.34, n=3 in each group).
Figure 2.
Effect of LPAR antagonist on albuminuria. Treatment with losartan plus enalapril (RASI) led to rapid and marked decreases in albuminuria, whereas treatment with a LPARI for both LPAR1 and LPAR3 caused a delayed but marked reduction of albuminuria similar to that seen in RAS inhibition group, with minimal effect on hyperglycemia. *P<0.05; **P<0.01; ***P<0.001 versus baseline; ##P<0.01; ###P<0.001 versus corresponding vehicle group; n=10 in each group. Bonferroni t tests were used for statistical analysis.
In vehicle-treated mice, GFR, measured by FITC inulin, decreased significantly from 8 to 20 weeks (0.22±0.01 versus 0.16±0.02 ml/min per mouse, n=10; P<0.02). In contrast, there was no decrease in GFR in the LPARI group (0.24±0.02 versus 0.26±0.02 ml/min per mouse, n=10; NS) or in the RAS inhibitor group (0.23±0.03 versus 0.24±0.03 ml/min per mouse, n=10; NS). Therefore, after treatment for 12 weeks, GFR was significantly higher in both LPARI and RAS inhibitor groups than the vehicle-treated group (Figure 3A).
Figure 3.
Antagonism of LPARs preserved GFR. (A) From 8 to 20 weeks of age, GFR markedly decreased in vehicle group, but was stable in RAS inhibition (RASI) and LPARI groups, with higher GFR in RASI and LPARI groups than in the vehicle group at 20 weeks of age. *P<0.05 versus corresponding baseline; #P<0.05 versus vehicle group at 20 weeks of age; n=10 in each group. (B) Both RASI and LPARI attenuated glomerular injury. n=8–10 in each group. t test and Bonferroni t tests were used for statistical analysis. **P<0.01; ***P<0.001 versus vehicle group.
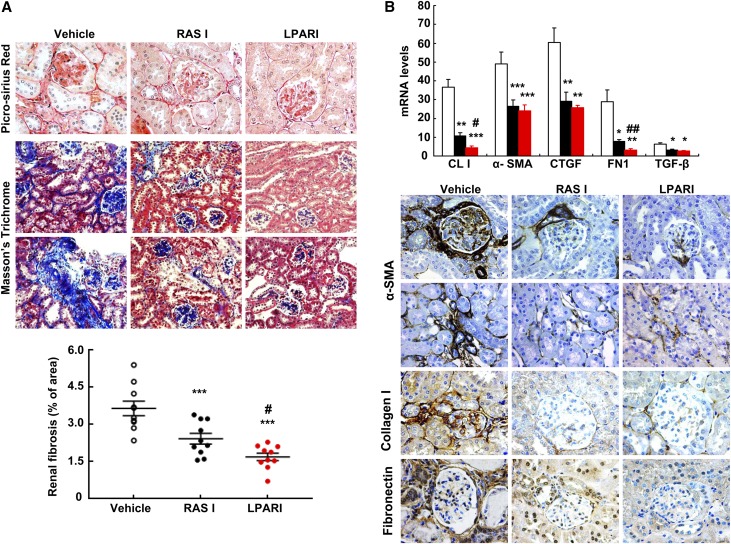
At 20 weeks, there was significantly decreased glomerulosclerosis in both LPARI treated- and RAS inhibitor–treated mice compared with vehicle-treated mice (Figure 3B). LPARI also decreased the amount of total fibrosis (glomeruli and tubulointerstitium) compared with vehicle (2.17±0.17% versus 1.02±0.10%, n=10; P<0.001) (Figure 4A). Interestingly, LPARI was also more effective than RAS inhibition at attenuating total fibrosis (1.47±0.12, n=10; P<0.01 versus BMS002 group). LPARI treatment decreased mRNA expression of fibronectin, collagen I, TGF-β, CTGF and α-smooth muscle actin (α-SMA) (Figure 4B), and there were similar decreases in expression of immunoreactive fibronectin, collagen, and α-SMA, further indicating LPARI-mediated inhibition of profibrotic pathways (Figure 4B).
Figure 4.
Antagonism of LPARs attenuated the development of diabetic nephropathy. (A) LPARIs and renin-angiotensin system inhibitors (RASIs) markedly attenuated the development of glomerular and tubulointerstitial fibrosis, as indicated by Picrosirius red staining and Masson trichrome staining and quantification. ***P<0.001 versus vehicle group; #P<0.05 versus RASI group; n=10 in each group. (B) Quantitative PCR and immunostaining showed that both RAS inhibition and LPAR antagonism significantly inhibited renal expression levels of profibrotic and fibrotic components, including collagen I, α-SMA (marker of myofibroblasts), connective tissue growth factor (CTGF), fibronectin (FN), and TGF-β. Original magnification, ×160 for Masson trichrome. Original magnification, ×400 for all others. Bonferroni t tests were used for statistical analysis. *P<0.05; **P<0.01; ***P<0.001 versus vehicle group; #P<0.05; ##P<0.01 versus RASI group; n=6 in each group.
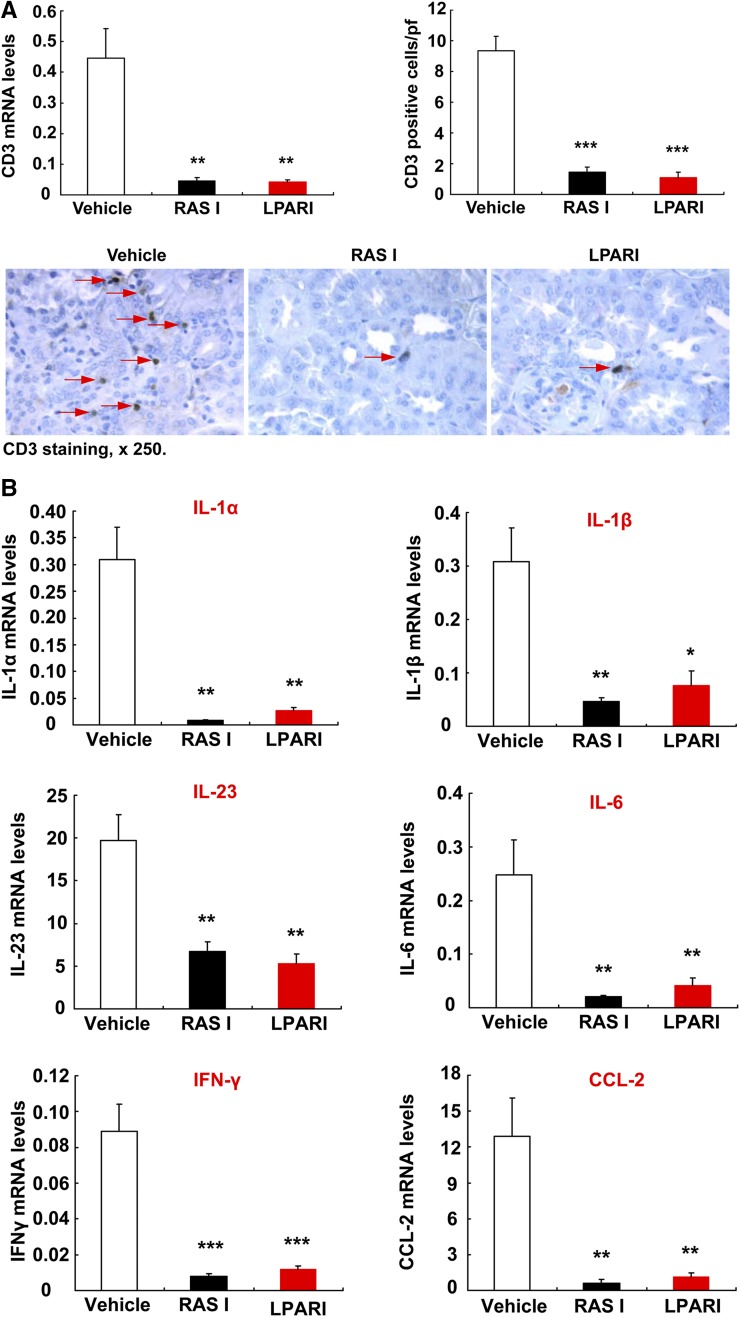
Inflammation contributes to development of diabetic nephropathy. Both LPAR antagonism and RAS inhibition led to marked reduction in renal macrophage infiltration, as indicated by decreased protein and mRNA levels of F4/80, a marker of macrophages (Figure 5, A and B). Although macrophage infiltration decreased, renal mRNA levels of IL-4Rα and 15-lipoxygenase, two markers of anti-inflammatory and reparative M2 phenotypic macrophages, were significantly higher in both LPAR inhibitor–treated mice and RAS inhibitor–treated mice (Figure 5C). Both LPAR and RAS inhibition also suppressed renal T cell infiltration (Figure 6A); decreased renal mRNA levels of Th1/M1 cytokines/chemokines, including IL-1α, IL-β, IFN-γ, CCL-2, IL-23, and IL-6 (Figure 6B); and reduced oxidative stress, as indicated by nitrotyrosine immunostaining (Supplemental Figure 4).
Figure 5.
Antagonism of LPARs affected renal macrophage infiltration and polarization. (A and B) Both RAS inhibition and LPAR antagonism suppressed renal macrophage infiltration, as indicated by reduction in F4/80 staining (marker of macrophages) (A) and mRNA levels (B). Original magnification, ×400. ***P<0.001 versus vehicle group, n=6 in each group. (C) Renal mRNA levels of IL-4Rα and 15-lipoxygenase (15-LOX), two M2 phenotypic markers of macrophages, were markedly higher in both LPAR I and RASI groups than the vehicle group. Bonferroni t tests were used for statistical analysis. **P<0.01; ***P<0.001 versus vehicle group; #P<0.05; ##P<0.01 versus RASI group; n=6 in each group.
Figure 6.
Antagonism of LPARs attenuated renal levels of proinflammatory cytokines/chemokines. (A) Both RAS inhibition and LPAR antagonism markedly suppressed renal T lymphocyte infiltration, as indicated by reduction of CD3 staining and quantification as well as mRNA levels. Original magnification, ×250. **P<0.01; ***P<0.001 versus vehicle group, n=6 in each group. (B) RAS inhibition and LPAR antagonism markedly reduced renal mRNA levels of proinflammatory cytokines/chemokines, including IL-1α, IL-1β, IL-23, IL-6, INF-γ, and CCL2. Bonferroni t tests were used for statistical analysis. *P<0.05; **P<0.01; ***P<0.001 versus vehicle group; n=6 in each group.
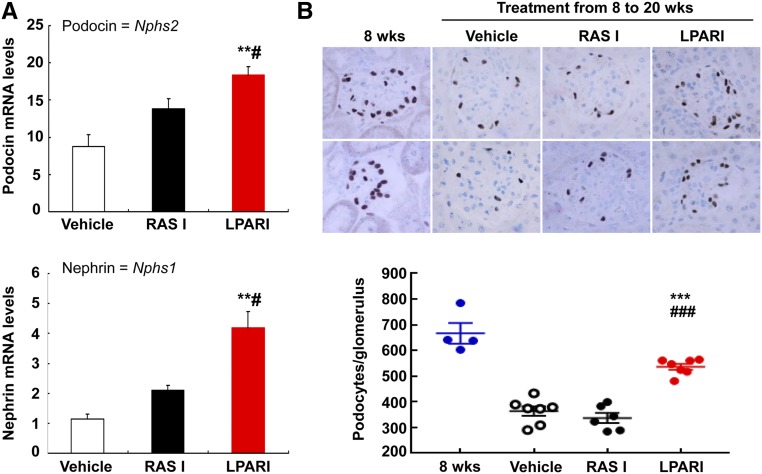
As both LPAR and RAS inhibition attenuated glomerulosclerosis in eNOS−/− db/db mice, we investigated whether podocyte number was affected. qPCR data indicated that the mRNA levels of podocin and nephrin, two specific markers of podocytes, were markedly higher in LPAR inhibitor–treated kidneys than in either vehicle- or RAS inhibitor–treated kidneys (Figure 7A). Compared with 8-week-old eNOS−/− db/db mice, vehicle-treated mice had lost approximately 50% of their podocytes by 20 weeks of age, indicated by WT-1 staining (from 667±40 to 364±18 podocytes per glomerulus; n=4 in 8-week-old group and n=7 in 20-week-old vehicle-treated group; P<0.001) (Figure 7B). In contrast, LPAR inhibitor–treated mice had significantly less podocyte loss (536±12 podocytes per glomerulus, n=7; P<0.001 versus 20-week-old vehicle-treated group). Similar to kidney nephrin and podocin mRNA data, RAS inhibition did not prevent the decrease in podocyte number seen in this model of diabetic kidney injury (337±18 podocytes per glomerulus, n=6; NS versus vehicle-treated mice; P<0.001 versus LPARI group). Our previous study had shown that the angiotensin-converting enzyme inhibitor (ACEI) captopril and a triple therapy of hydralazine, reserpine, and hydrochlorothiazide decreased BP in eNOS−/− db/db mice to similar levels.11 On further analysis of these results, we found that the podocyte number per glomerular section in both treated groups was similar to that of untreated mice, indicating that either lowering BP or inhibition of angiotensin II production with ACEI did not prevent loss of podocytes (Supplemental Figure 5).
Figure 7.
Antagonism of LPARs slowed the loss of podocytes. (A) After treatment from 8 to 20 weeks of age, kidney mRNA levels of podocin and nephrin, two specific podocyte markers, were markedly higher in LPARI treated mice than in vehicle and RASI treated mice. **P<0.01 versus vehicle group; #P<0.05 versus RASI group; n=6 in each group. (B) Podocyte number per glomerulus was significantly higher in the LPARI group than vehicle and RASI groups when the mice were euthanized at 20 weeks of age. Bonferroni t tests were used for statistical analysis. Original magnification, ×400. ***P<0.001 versus vehicle at 20 weeks of age; ###P<0.001 versus RASI group at 20 weeks of age.
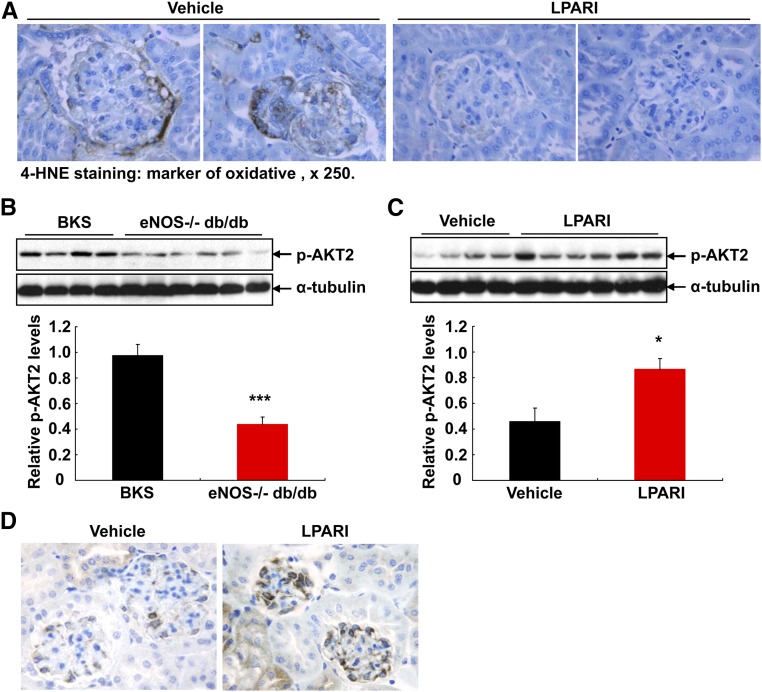
4-HNE is a marker of oxidative stress and represents the major products of lipid peroxidation. 4-HNE immunostaining was apparent in podocytes and other cell types of glomeruli in 20-week-old vehicle-treated eNOS−/− db/db mice, but was markedly decreased in LPAR inhibitor–treated mice (Figure 8A). Recently AKT2 activation has been reported to play an essential role in podocyte protection after chronic kidney injury.12 We determined that renal AKT2 activity was significantly lower in eNOS−/− db/db mice than age- and sex-matched BKS controls (Figure 8B), and LPAR inhibition led to marked increases in renal AKT2 activity in eNOS−/− db/db mice (Figure 8C). GSK3 is a critical downstream element of the AKT cell survival pathway and AKT2 deficiency led to attenuated GSK3α activation in a CKD model of renal ablation.12 We found that p-GSK3α (activated GSK3α) expression increased in podocytes of mice with LPAR inhibition (Figure 8D).
Figure 8.
Antagonism of LPARs attenuated oxidative stress and preserved AKT2 activity. (A) 4-HNE, a biomarker of oxidative stress (detection of lipid peroxidation), was evident in kidneys (particular podocytes and other cell types in glomeruli) in vehicle-treated eNOS−/− db/db mice, but its staining was minimal in LPARI-treated animals. Original magnification, ×250. (B) Renal AKT2 activity (phosphorylated AKT) was marked lower in eNOS−/− db/db mice than in age- and sex-matched BKS controls. ***P<0.001; n=4 in BKS controls and n=6 in eNOS−/− db/db mice. (C) AKT2 activity (phosphorylated AKT) was marked higher in LPARI-treated eNOS−/− db/db mice than in vehicle-treated eNOS−/− db/db mice. *P<0.05; n=4 in vehicle group and n=6 in LPARI group. (D) Compared with vehicle-treated eNOS−/− db/db mice, p-GSK3α (activated GSK3α) expression increased in podocytes with LPAR inhibition. Original magnification, ×400.
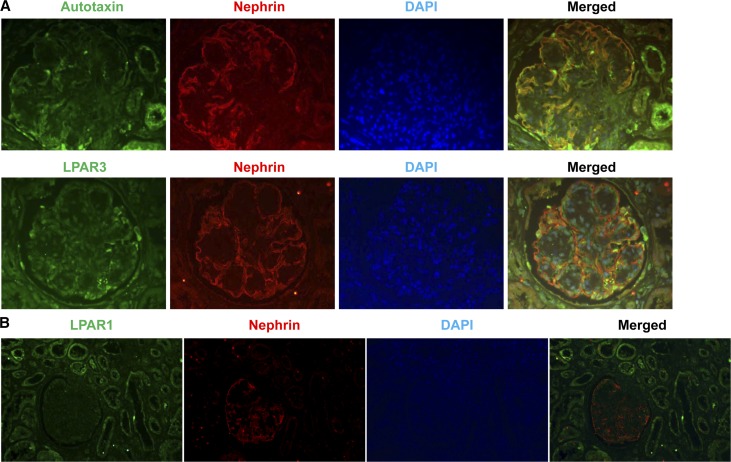
To validate whether LPA signaling is activated in human diabetic kidney, we performed immunohistochemistry to determine expression in both normal and diabetic human kidneys. We determined that expression of autotaxin, LPAR1, and LPAR3 was minimal in normal human kidneys, but their expression all increased in diabetic human kidneys, particularly in epithelia (Supplemental Figure 6). Using double immunofluorescence with nephrin as a marker of podocytes, we confirmed that both autotaxin and LPAR3 were expressed in podocytes, as well as other cell types of glomerulus in diabetic human kidneys. However, LPAR1 was primarily expressed in tubular epithelial cells, with minimal expression in glomerulus in diabetic human kidneys (Figure 9).
Figure 9.
LPA signaling is activated in human diabetic kidney. (A) Double immunofluorescence staining with nephrin determined that autotaxin and LPAR3 were localized to podocytes in human diabetic kidneys. Original magnification, ×400. (B) LPAR1 was localized to tubular epithelia, with minimal expression in glomerulus in human diabetic kidneys. Original magnification, ×250.
Discussion
The major findings in this study include the following: (1) podocytes have an intact autotaxin/LPA/LPAR system, which is activated in eNOS−/− db/db mice; (2) similar to inhibition of RAS, inhibition of LPAR1 and LPAR3 preserved GFR and attenuated development of diabetic nephropathy, as indicated by decreases in albuminuria, fibrosis, expression levels of fibrotic and profibrotic components (collagen I, α-SMA, CTGF, fibronectin and TGF-β), and decreased immune cell infiltration; (3) inhibition of LPARs slowed podocyte loss in eNOS−/− db/db mice, and preservation of AKT2 activity may contribute to this protective effect; and (4) LPA signaling is activated in human diabetic kidneys, particularly in podocytes.
Serum autotaxin levels are associated with proteinuria and kidney lesions in type 2 diabetic patients with biopsy-proven diabetic nephropathy,13 but the increase in expression of both autotaxin and LPARs in glomerular cells in the diabetic kidney, especially podocytes, suggests a potential role for autocrine and/or paracrine LPAR activation as a mediator of injury. LPA can also transactivate the EGF receptor,14 and inhibition of EGF receptor activity protects against diabetic nephropathy.15–17
Diabetic nephropathy is known to be a proinflammatory state, and immune cell infiltration, particularly macrophages, plays an important in the development and progression of diabetic nephropathy. Renal macrophages from mice with STZ diabetes have greater expression of proinflammatory M1 markers than anti-inflammatory M2 markers.18 In this study, inhibition of either LPARs or RAS markedly decreased renal infiltration of macrophages and lymphocytes (Figures 5 and 6). Of note, LPA is a noncytokine survival factor for macrophages.19 The autotaxin/LPA axis has also been reported to be a novel regulator of lymphocyte homing and inflammation.20 Although total renal macrophage number was markedly reduced in mice treated with the LPAR antagonist or with ACEI and ARB, the expression level of anti-inflammatory M2 markers increased whereas that of proinflammatory M1 markers decreased. Therefore, antagonism of LPAR or RAS not only inhibited renal macrophage infiltration but also polarized macrophage to an M2 phenotype, leading to protection against diabetic nephropathy.
Diabetes causes microvascular dysfunction, which contributes to development of diabetic nephropathy. Alterations in the expression and/or activity of eNOS are associated with development and/or progression of diabetic nephropathy,21 and eNOS deficiency induces acceleration of development of diabetic nephropathy.11,15,22,23 eNOS−/− db/db mice develop an accelerated diabetic nephropathy with distinct features of progressive nephropathy similar to human diabetic nephropathy, including early and significant albuminuria, mesangiolysis, arteriolar hyalinosis, FSGS, and nodular glomerulosclerosis, as well as moderate hypertension.22 Our previous study indicated that either BP control with triple therapy (hydralazine, reserpine, hydrochlorothiazide) or angiotensin-converting enzyme inhibition with captopril attenuated progression of diabetic nephropathy in this model.11 In contrast, we did not detect any effect of the LPAR inhibitor on the hypertension seen in the eNOS−/− db/db mice.
As noted above, LPAR antagonism led to partial preservation of podocyte number. Unexpectedly, in this study, we failed to observe prevention of podocyte loss with RAS inhibition, unlike previous reports in other experimental models of diabetic nephropathy, as well as other models of experimental glomerular disease.24–26 Of note, these models did not have eNOS deficiency. eNOS activity has been reported to play an important role to maintain podocyte integrity. eNOS deficiency causes podocyte cellular hypertrophy, lysosomal enlargement, vacuolization, microvillus formation, increased mitochondrial fragmentation, and reduction of ATP production.27 In eNOS−/− db/db mice, ultrastructural evidence of podocyte injury is evident as early as 8 weeks of age, with accumulation of vacuoles, pseudocysts, foot process effacement, and electron-dense droplets within the cytoplasm.21 Angiotensin II causes oxidative stress due to eNOS uncoupling in both endothelial cells and mesangial cells, leading to subsequent kidney injury. The protection of RAS inhibition against diabetic nephropathy is due, in part, to restoration of eNOS coupling and subsequent decreased oxidative stress.28–30
Inhibition of LPARs appears to protect against diabetic nephropathy in eNOS−/− db/db mice, at least in part through mechanisms different than those that mediate protection with RAS inhibition. RAS inhibition led to a quick initial reduction in albuminuria, whereas LPAR inhibition led to a gradual reduction in albuminuria. Our previous study addressed the role of eNOS deficiency and endothelial dysfunction in initiation of podocyte injury in this model of diabetic nephropathy.21 We propose that RAS inhibition may decrease albuminuria in eNOS−/− db/db mice because of alterations in SBP and glomerular hemodynamics. The slower decrease in proteinuria and the lack of BP alterations with LPAR inhibition suggest that hemodynamic alterations are not paramount and the protective effect may be due predominantly to decreased inflammation and fibrosis. Furthermore, the ability of the LPAR inhibitor to protect podocytes in the eNOS−/− db/db mice suggests a direct cytoprotective protective effect on podocytes rather than an indirect effect caused by decreased endothelial dysfunction. In this regard, AKT2 has been reported to be expressed primarily in podocytes in kidney and to play a key role in protection against podocyte loss during chronic kidney injury.12 We found that AKT2 activity was reduced in eNOS−/− db/db mice, and LPAR inhibitor preserved AKT2 activity and its downstream p-GSK3α activity.
Recently, Li et al.31 reported that renal cortical mRNA and protein levels of autotaxin and LPAR1, but not LPAR2 and LPAR3, increased significantly in db/db mice compared with wild-type mice. Increases in autotaxin and LPAR1 levels in db/db mice or in mesangial cells cultured in high glucose media were inhibited by ki16425, a dual LPAR1 and LPAR3 antagonist. They further found that ki16425 attenuated the development of diabetic nephropathy in db/db mice, possibly due to inhibiting the LPAR1 signaling–mediated TGF-β via GSK3β phosphorylation and SREBP1 activation in mesangial cells. In our study, we used eNOS−/− db/db mice, an accelerated type 2 diabetic model. In these mice, the protein levels of autotaxin, LPAR1, and LPAR3 all increased in the kidney, including in podocytes. This may explain why in our model, treatment with LPARI protected against podocyte loss. In addition, increased LPAR3 in glomeruli was validated in human diabetic kidneys.
We and others previously reported that in eNOS−/− mice, an acute podocyte injury occurred as early as 2 weeks after inducing diabetes with streptozotocin, and either captopril or losartan prevented podocytopathy.21 In this study, we treated eNOS−/− db/db mice with enalapril and losartan at the age of 8 weeks, when podocyte injury already existed. At 8–12 weeks of age, podocyte pseudocysts, cytoplasmic vacuoles, and focal areas of foot process effacement were already apparent in eNOS−/− db/db mice. It is possible that RAAS blockade is effective to prevent diabetic podocyte injury in this model, but less effective to stop the progression of diabetic podocyte injury.
In summary, these studies indicate that in an accelerated model of diabetic nephropathy, an intrarenal LPA/LPAR is activated and mediates development of glomerulosclerosis and tubulointerstitial fibrosis because antagonism of LPAR1/LPAR3 markedly decreased the renal injury. Because LPAR antagonism did not significantly decrease the hypertension seen in eNOS−/− db/db mice and provided protection against podocyte loss not seen with RAS inhibition, LPAR antagonism might provide complementary beneficial effects to RAS inhibition to slow progression of diabetic nephropathy.
Concise Methods
Animal Studies
All animal experiments were performed in accordance with the guidelines of the Institutional Animal Care and Use Committee of Vanderbilt University. Type 2 diabetic eNOS−/− db/db mice on the C57BLKS/J (BKS) background were generated as described previously.22 Genotyping was performed by PCR. At 8 weeks of age, the animals were divided into three groups (n=10 per group) and treated twice a day through gastric gavage with vehicle (0.5% Methocel E4M and 1.0% Soluplus in water), BMS002 at 20 mg/kg per day (dissolved in vehicle), or a positive control (losartan plus enalapril, 10 mg/kg per day for each). The treatments lasted 12 weeks (from 8 to 20 weeks of age). BMS002 is an LPA1/3R dual antagonist. The functional antagonist affinities (Kb) of BMS002 were assessed by its ability to block LPA-stimulated Ca2+ flux in CHO cells transfected with the appropriate human LPAR isoform. BMS002 demonstrated a Kb=7.6 nM (±0.4 SEM) for LPAR1 and Kb=30.6 nM (±2 SEM) for LPAR3, respectively. BMS002 was significantly less potent at LPAR2, with a Kb=290 nM (±12 SEM). BMS002 was a full (100%) inhibitor of LPA-mediated Ca2+ flux at all three LPAR isoforms. Losartan is an angiotensin II type 1 receptor antagonist and enalapril is a prodrug that is bioactivated after oral administration by hydrolysis of the ethyl ester to enalaprilat, an active ACEI.
Measurements of GFR in Conscious Mice
GFR was measured as we have reported previously.32 GFR was measured before initiation of the experiment (7–8 weeks of age) and at the end of the experiment (20 weeks of age).
Measurements of Urinary Albumin Excretion
Urinary albumin and creatinine excretion was determined using Albuwell M kits (Exocell, Philadelphia, PA). Albuminuria is expressed as urinary albumin concentration versus creatinine concentration ratio (micrograms per milligram).
Histologic Analysis
Slides stained with periodic acid–Schiff were evaluated for glomerular injury without knowledge of the identity of the various groups. A semiquantitative index was used to evaluate the degree of glomerular sclerosis. Each glomerulus on a single section was graded from 0 to 4, where 0 represents no lesion, and 1, 2, 3, and 4 represent sclerosis involving ≤25, 25–50, 50–75, or >75% of the glomerular tuft area, respectively.15,33
Antibodies
Rat anti-mouse F4/80 (MCA497R) and CD3 (MCA1477) were purchased from AbD Serotec (now Bio-Rad); rabbit anti-fibronectin (F3648) and mouse anti–α-SMA (a marker of myofibroblasts, A5228) were from Sigma-Aldrich; rabbit anti-murine collagen type I (600–401–103–01) was from Rockland Immunochemicals; rabbit anti-Wilms tumor protein (WT1, ab89901) and LPAR3 (ab23692, for immunoblotting) were from Abcam; rabbit anti-ENPP2/autotaxin (NBP1–32162), LPAR1 (NBP1–00788), and LPAR3 (NBP1–84903) were from Novus Biologicals; goat anti-nephrin (AF3159) was from R&D Systems; rabbit anti-Nitro tyrosine antibody (SC-55256) was from Santa Cruz Biotechnology; rabbit anti-LPAR3 for immunoblotting was from Cayman Chemicals (10005280); rabbit anti-PERK (Thr202/Tyr204, no. 4370), p-AKT (Thr308, no. 13038), p-ATK (Ser473, no. 4060), p-AKT2 (Ser474, no. 8599), and p-GSK3α (Ser21, no. 9316) were from Cell Signaling Technology; monoclonal mouse anti-4-HNE (no. 198960) was from R&D Systems.
RNA Isolation and Quantitative RT-PCR
Total renal RNAs were isolated using TRIzol Reagents (Invitrogen). Quantitative RT-PCR was performed using TaqMan real-time PCR (7900HT; Applied Biosystems). The Master Mix and all gene probes were also purchased from Applied Biosystems. The probes used in the experiments included mouse S18 (Mm02601778), IL-4Rα (Mm01275139), nephrin (Nphs1, Mm00497828), podocin (Nphs2, Mm01292252), CCL2 (MCP-1, Mm00441242), collagen I (Col1a1, Mm00801666), fibronectin 1 (Fn1, Mm01256744), α-SMA (acta2, Mm01546133), CTGF (Mm01192933), TGF-β (Mm00441726), F4/80 (Emr1, Mm00802529), CD3 (Cd3d, Mm00442746), 15-lipoxygenase (Alox15, Mm01250458), IL-23 (Il-23a, Mm00518984), IL-1α (Mm00439621), IL-1β (Mm00434228), IL-6 (Mm00446190), and INF-γ (IFNg, Mm01168134).
Immunoblotting
Kidney samples were homogenized with buffer containing 10 mM Tris·HCl (pH 7.4), 50 mM NaCl, 2 mM EGTA, 2 mM EDTA, 0.5% Nonidet P-40, 0.1% SDS, 100 μM Na3VO4, 100 mM NaF, 0.5% sodium deoxycholate, 10 mM sodium pyrophosphate, 1 mM PMSF, 10 μg/ml aprotinin, and 10 μg/ml leupeptin. The homogenate was centrifuged at 15,000×g for 20 minutes at 4°C. An aliquot of supernatant was taken for protein measurement with a BCA Protein Assay kit (ThermoScientific, Rockford, IL). Immunoblotting was described in a recent article.34
Immunofluorescence/Immunohistochemistry Staining and Quantitative Image Analysis
The animals were anesthetized with pentobarbital (Nembutal, 70 mg/kg, administered intraperitoneally) and given heparin (1000 U/kg, administered intraperitoneally) to minimize coagulation. One kidney was removed for isolation of glomeruli. The other kidney was cut into four similar parts, one part for quantitative RT-PCR, one part for histologic analysis, one part stored at −80C for immunoblotting, and one part immersed in FPAS (3.7% formaldehyde, 10 mM sodium m-periodate, 40 mM phosphate buffer, and 1% acetic acid) for immunohistochemical and immunofluorescence staining. The fixed kidney was dehydrated through a graded series of ethanols, embedded in paraffin, sectioned (4 µm), and mounted on glass slides. Immunostaining was carried out as previously described.35 For immunofluorescence staining, deparaffinized sections were rehydrated, blocked with PBS containing 10% normal donkey serum for 1 hour, and then incubated overnight at 4°C with goat anti-nephrin (R&D Systems) plus rabbit anti-autotaxin, LPAR1, or LPAR3 diluted in incubation buffer (PBS supplemented with 1% BSA, 1% normal donkey serum, 0.3% Triton X-100, and 0.01% azide). After washing with PBS, the sections were incubated with incubation buffer containing Cy3 conjugated donkey anti-goat IgG and FITC conjugated anti-rabbit IgG for 1 hour. After washing and staining with DAPI, sections were viewed and imaged with a Zeiss Axio fluorescence microscope and spot-cam digital camera (Zeiss Microimaging, city, state/country). On the basis of the distinctive density and color of immunostaining in video images, the number, size, and position of stained cells were quantified using the BIOQUANT true-color windows system (R&M Biometrics) as previously described.36 Six representative fields from each animal were quantified, and their average was used as data from one animal sample. Podocyte density is expressed as podocytes per glomerulus.
BP Measurement
BP was measured in awake mice with a tail-cuff microphonic manometer.37 In brief, mice were trained for three consecutive days at room temperature (Monday to Wednesday) before SBP was recorded on the following 2 days (Thursday and Friday) using a tail-cuff monitor (BP-2000 BP Analysis System; Visitech Systems). SBPs recorded on two consecutive days were averaged and used as the SBP from one mouse. BP was also measured in awake, catheterized mice in a subset of mice as previously described.37
Podocyte Counting
Podocytes per glomerulus were estimated by the method of Weibel.38 Briefly, 4 µm sections of formalin-fixed tissue were immunostained with WT-1 as a marker of podocyte nuclei. A total of 25 glomerular sections for each animal were photographed with a digital camera. Pictures were imported into the Image Pro Plus Software and analyzed morphometrically. To estimate glomerular volume (VG), the outline of the glomerular tuft area was manually traced, and its surface area then calculated. The number of podocytes in each cross-section was determined and the long and short diameters of each podocyte were measured in order to determine an average podocyte diameter.
Mean value of VG was calculated using the Weibel formula VG=(μ/k) (MA)3/2, where k=1.1 (size distribution coefficient), μ=1.38 (shape coefficient for spheres, which is the assumed shape of glomeruli), and MA is the mean glomerular cross-section area. The estimation of the average number of podocytes per glomerulus (NP) was then determined by the stereologic method published by Weibel.38
The volume density of the podocytes (NV) in glomerular tuft volume was estimated as NV=NA/D, where podocyte nuclear profile area density (NA) was estimated by the ratio between the number of podocyte nuclear profiles and the glomerular profile area in each glomerulus. D is the average diameter of podocyte nuclei that was estimated from long and short axes of 30 nuclear sections. The average volume of podocyte nuclei (V) was first calculated on the basis of the assumption that podocyte nuclei have an ellipsoidal shape. The average diameter of an equivalent sphere having the same volume of the ellipsoid was then determined. The mean number of podocytes per glomerular tuft (NP) was calculated for each animal by multiplying podocyte volume density NV in the capillary tuft by the mean value of VG previously calculated. Formulae used for the calculations were NA=number of WT-1–positive cells per glomerular cross section; NV=NA/D (average podocyte diameter); VG=(1.38/1.1) (MA)3/2; number of podocytes per glomerulus =NV×VG.
Statistical Analyses
All values are presented as means, with error bars representing ±SEM. Fisher exact test, ANOVA, and Bonferroni t tests were used for statistical analysis.
Disclosures
None.
Supplementary Material
Acknowledgments
This work was supported by National Institutes of Health grants DK-95785 and DK-51265 (to M.-Z.Z. and R.C.H), DK-62794 and DK-103067 (to R.C.H), and by funds from the Department of Veterans Affairs (to R.C.H).
Footnotes
Published online ahead of print. Publication date available at www.jasn.org.
This article contains supplemental material online at http://jasn.asnjournals.org/lookup/suppl/doi:10.1681/ASN.2017010107/-/DCSupplemental.
References
- 1.Aikawa S, Hashimoto T, Kano K, Aoki J: Lysophosphatidic acid as a lipid mediator with multiple biological actions. J Biochem 157: 81–89, 2015 [DOI] [PubMed] [Google Scholar]
- 2.Cholia RP, Nayyar H, Kumar R, Mantha AK: Understanding the multifaceted role of ectonucleotide pyrophosphatase/phosphodiesterase 2 (ENPP2) and its altered behaviour in human diseases. Curr Mol Med 15: 932–943, 2015 [DOI] [PubMed] [Google Scholar]
- 3.Levine JS, Koh JS, Triaca V, Lieberthal W: Lysophosphatidic acid: A novel growth and survival factor for renal proximal tubular cells. Am J Physiol 273: F575–F585, 1997 [DOI] [PubMed] [Google Scholar]
- 4.Fang X, Yu S, LaPushin R, Lu Y, Furui T, Penn LZ, Stokoe D, Erickson JR, Bast RC Jr, Mills GB: Lysophosphatidic acid prevents apoptosis in fibroblasts via G(i)-protein-mediated activation of mitogen-activated protein kinase. Biochem J 352: 135–143, 2000 [PMC free article] [PubMed] [Google Scholar]
- 5.Coy PE, Taneja N, Lee I, Hecquet C, Bryson JM, Robey RB: LPA is a novel lipid regulator of mesangial cell hexokinase activity and HKII isoform expression. Am J Physiol Renal Physiol 283: F271–F279, 2002 [DOI] [PubMed] [Google Scholar]
- 6.Bryson JM, Coy PE, Gottlob K, Hay N, Robey RB: Increased hexokinase activity, of either ectopic or endogenous origin, protects renal epithelial cells against acute oxidant-induced cell death. J Biol Chem 277: 11392–11400, 2002 [DOI] [PubMed] [Google Scholar]
- 7.Geng H, Lan R, Singha PK, Gilchrist A, Weinreb PH, Violette SM, Weinberg JM, Saikumar P, Venkatachalam MA: Lysophosphatidic acid increases proximal tubule cell secretion of profibrotic cytokines PDGF-B and CTGF through LPA2- and Gαq-mediated Rho and αvβ6 integrin-dependent activation of TGF-β. Am J Pathol 181: 1236–1249, 2012 [DOI] [PMC free article] [PubMed] [Google Scholar]
- 8.Pradère JP, Klein J, Grès S, Guigné C, Neau E, Valet P, Calise D, Chun J, Bascands JL, Saulnier-Blache JS, Schanstra JP: LPA1 receptor activation promotes renal interstitial fibrosis. J Am Soc Nephrol 18: 3110–3118, 2007 [DOI] [PubMed] [Google Scholar]
- 9.Okusa MD, Ye H, Huang L, Sigismund L, Macdonald T, Lynch KR: Selective blockade of lysophosphatidic acid LPA3 receptors reduces murine renal ischemia-reperfusion injury. Am J Physiol Renal Physiol 285: F565–F574, 2003 [DOI] [PubMed] [Google Scholar]
- 10.Ohashi T, Yamamoto T: Antifibrotic effect of lysophosphatidic acid receptors LPA1 and LPA3 antagonist on experimental murine scleroderma induced by bleomycin. Exp Dermatol 24: 698–702, 2015 [DOI] [PubMed] [Google Scholar]
- 11.Zhang MZ, Wang S, Yang S, Yang H, Fan X, Takahashi T, Harris RC: Role of blood pressure and the renin-angiotensin system in development of diabetic nephropathy (DN) in eNOS-/- db/db mice. Am J Physiol Renal Physiol 302: F433–F438, 2012 [DOI] [PMC free article] [PubMed] [Google Scholar]
- 12.Canaud G, Bienaimé F, Viau A, Treins C, Baron W, Nguyen C, Burtin M, Berissi S, Giannakakis K, Muda AO, Zschiedrich S, Huber TB, Friedlander G, Legendre C, Pontoglio M, Pende M, Terzi F: AKT2 is essential to maintain podocyte viability and function during chronic kidney disease. Nat Med 19: 1288–1296, 2013 [DOI] [PubMed] [Google Scholar]
- 13.Shimizu M, Furuichi K, Toyama T, Yamahana J, Ohkawa R, Igarashi K, Aoki J, Kaneko S, Yatomi Y, Wada T: Serum autotaxin levels are associated with proteinuria and kidney lesions in Japanese type 2 diabetic patients with biopsy-proven diabetic nephropathy. Intern Med 55: 215–221, 2016 [DOI] [PubMed] [Google Scholar]
- 14.Jeong KJ, Cho KH, Panupinthu N, Kim H, Kang J, Park CG, Mills GB, Lee HY: EGFR mediates LPA-induced proteolytic enzyme expression and ovarian cancer invasion: Inhibition by resveratrol. Mol Oncol 7: 121–129, 2013 [DOI] [PMC free article] [PubMed] [Google Scholar]
- 15.Zhang MZ, Wang Y, Paueksakon P, Harris RC: Epidermal growth factor receptor inhibition slows progression of diabetic nephropathy in association with a decrease in endoplasmic reticulum stress and an increase in autophagy. Diabetes 63: 2063–2072, 2014 [DOI] [PMC free article] [PubMed] [Google Scholar]
- 16.Chen J, Chen JK, Harris RC: EGF receptor deletion in podocytes attenuates diabetic nephropathy. J Am Soc Nephrol 26: 1115–1125, 2015 [DOI] [PMC free article] [PubMed] [Google Scholar]
- 17.Chen J, Harris RC: Interaction of the EGF receptor and the hippo pathway in the diabetic kidney. J Am Soc Nephrol 27: 1689–1700, 2016 [DOI] [PMC free article] [PubMed] [Google Scholar]
- 18.Devaraj S, Tobias P, Kasinath BS, Ramsamooj R, Afify A, Jialal I: Knockout of toll-like receptor-2 attenuates both the proinflammatory state of diabetes and incipient diabetic nephropathy. Arterioscler Thromb Vasc Biol 31: 1796–1804, 2011 [DOI] [PMC free article] [PubMed] [Google Scholar]
- 19.Koh JS, Lieberthal W, Heydrick S, Levine JS: Lysophosphatidic acid is a major serum noncytokine survival factor for murine macrophages which acts via the phosphatidylinositol 3-kinase signaling pathway. J Clin Invest 102: 716–727, 1998 [DOI] [PMC free article] [PubMed] [Google Scholar]
- 20.Knowlden S, Georas SN: The autotaxin-LPA axis emerges as a novel regulator of lymphocyte homing and inflammation. J Immunol 192: 851–857, 2014 [DOI] [PMC free article] [PubMed] [Google Scholar]
- 21.Yuen DA, Stead BE, Zhang Y, White KE, Kabir MG, Thai K, Advani SL, Connelly KA, Takano T, Zhu L, Cox AJ, Kelly DJ, Gibson IW, Takahashi T, Harris RC, Advani A: eNOS deficiency predisposes podocytes to injury in diabetes. J Am Soc Nephrol 23: 1810–1823, 2012 [DOI] [PMC free article] [PubMed] [Google Scholar]
- 22.Zhao HJ, Wang S, Cheng H, Zhang MZ, Takahashi T, Fogo AB, Breyer MD, Harris RC: Endothelial nitric oxide synthase deficiency produces accelerated nephropathy in diabetic mice. J Am Soc Nephrol 17: 2664–2669, 2006 [DOI] [PMC free article] [PubMed] [Google Scholar]
- 23.Nakagawa T, Sato W, Glushakova O, Heinig M, Clarke T, Campbell-Thompson M, Yuzawa Y, Atkinson MA, Johnson RJ, Croker B: Diabetic endothelial nitric oxide synthase knockout mice develop advanced diabetic nephropathy. J Am Soc Nephrol 18: 539–550, 2007 [DOI] [PubMed] [Google Scholar]
- 24.Gross ML, El-Shakmak A, Szábó A, Koch A, Kuhlmann A, Münter K, Ritz E, Amann K: ACE-inhibitors but not endothelin receptor blockers prevent podocyte loss in early diabetic nephropathy. Diabetologia 46: 856–868, 2003 [DOI] [PubMed] [Google Scholar]
- 25.Macconi D, Sangalli F, Bonomelli M, Conti S, Condorelli L, Gagliardini E, Remuzzi G, Remuzzi A: Podocyte repopulation contributes to regression of glomerular injury induced by ACE inhibition. Am J Pathol 174: 797–807, 2009 [DOI] [PMC free article] [PubMed] [Google Scholar]
- 26.Zhang J, Yanez D, Floege A, Lichtnekert J, Krofft RD, Liu ZH, Pippin JW, Shankland SJ: ACE-inhibition increases podocyte number in experimental glomerular disease independent of proliferation. J Renin Angiotensin Aldosterone Syst 16: 234–248, 2015 [DOI] [PMC free article] [PubMed] [Google Scholar]
- 27.Ueda S, Ozawa S, Mori K, Asanuma K, Yanagita M, Uchida S, Nakagawa T: ENOS deficiency causes podocyte injury with mitochondrial abnormality. Free Radic Biol Med 87: 181–192, 2015 [DOI] [PubMed] [Google Scholar]
- 28.Galougahi KK, Liu CC, Gentile C, Kok C, Nunez A, Garcia A, Fry NA, Davies MJ, Hawkins CL, Rasmussen HH, Figtree GA: Glutathionylation mediates angiotensin II-induced eNOS uncoupling, amplifying NADPH oxidase-dependent endothelial dysfunction. J Am Heart Assoc 3: e000731, 2014 [DOI] [PMC free article] [PubMed] [Google Scholar]
- 29.Satoh M, Fujimoto S, Arakawa S, Yada T, Namikoshi T, Haruna Y, Horike H, Sasaki T, Kashihara N: Angiotensin II type 1 receptor blocker ameliorates uncoupled endothelial nitric oxide synthase in rats with experimental diabetic nephropathy. Nephrol Dial Transplant 23: 3806–3813, 2008 [DOI] [PMC free article] [PubMed] [Google Scholar]
- 30.Lee DY, Wauquier F, Eid AA, Roman LJ, Ghosh-Choudhury G, Khazim K, Block K, Gorin Y: Nox4 NADPH oxidase mediates peroxynitrite-dependent uncoupling of endothelial nitric-oxide synthase and fibronectin expression in response to angiotensin II: Role of mitochondrial reactive oxygen species. J Biol Chem 288: 28668–28686, 2013 [DOI] [PMC free article] [PubMed] [Google Scholar]
- 31.Li HY, Oh YS, Choi J, Jung JY, Jun H: Blocking lysophosphatidic acid receptor 1 signaling inhibits diabetic nephropathy in db/db mice. Kidney Int 91: 1362–1373, 2017 [DOI] [PubMed] [Google Scholar]
- 32.Qi Z, Whitt I, Mehta A, Jin J, Zhao M, Harris RC, Fogo AB, Breyer MD: Serial determination of glomerular filtration rate in conscious mice using FITC-inulin clearance. Am J Physiol Renal Physiol 286: F590–F596, 2004 [DOI] [PubMed] [Google Scholar]
- 33.Cheng H, Fan X, Guan Y, Moeckel GW, Zent R, Harris RC: Distinct roles for basal and induced COX-2 in podocyte injury. J Am Soc Nephrol 20: 1953–1962, 2009 [DOI] [PMC free article] [PubMed] [Google Scholar]
- 34.Zhang MZ, Wang Y, Yao B, Gewin L, Wei S, Capdevila JH, Harris RC: Role of epoxyeicosatrienoic acids (EETs) in mediation of dopamine’s effects in the kidney. Am J Physiol Renal Physiol 305: F1680–F1686, 2013 [DOI] [PMC free article] [PubMed] [Google Scholar]
- 35.Cheng H, Wang S, Jo YI, Hao CM, Zhang M, Fan X, Kennedy C, Breyer MD, Moeckel GW, Harris RC: Overexpression of cyclooxygenase-2 predisposes to podocyte injury. J Am Soc Nephrol 18: 551–559, 2007 [DOI] [PubMed] [Google Scholar]
- 36.Zhang MZ, Yao B, Fang X, Wang S, Smith JP, Harris RC: Intrarenal dopaminergic system regulates renin expression. Hypertension 53: 564–570, 2009 [DOI] [PMC free article] [PubMed] [Google Scholar]
- 37.Yao B, Harris RC, Zhang MZ: Intrarenal dopamine attenuates deoxycorticosterone acetate/high salt-induced blood pressure elevation in part through activation of a medullary cyclooxygenase 2 pathway. Hypertension 54: 1077–1083, 2009 [DOI] [PMC free article] [PubMed] [Google Scholar]
- 38.Weibel ER: Practical Methods for Biological Morphometry, London, Academic Press, 1979, pp 40–116 [Google Scholar]
Associated Data
This section collects any data citations, data availability statements, or supplementary materials included in this article.


