Abstract
Kidney fibrosis is the histologic manifestation of CKD. Sustained activation of developmental pathways, such as Notch, in tubule epithelial cells has been shown to have a key role in fibrosis development. The molecular mechanism of Notch-induced fibrosis, however, remains poorly understood. Here, we show that, that expression of peroxisomal proliferation g-coactivator (PGC-1α) and fatty acid oxidation-related genes are lower in mice expressing active Notch1 in tubular epithelial cells (Pax8-rtTA/ICN1) compared to littermate controls. Chromatin immunoprecipitation assays revealed that the Notch target gene Hes1 directly binds to the regulatory region of PGC-1α. Compared with Pax8-rtTA/ICN1 transgenic animals, Pax8-rtTA/ICN1/Ppargc1a transgenic mice showed improvement of renal structural alterations (on histology) and molecular defect (expression of profibrotic genes). Overexpression of PGC-1α restored mitochondrial content and reversed the fatty acid oxidation defect induced by Notch overexpression in vitro in tubule cells. Furthermore, compared with Pax8-rtTA/ICN1 mice, Pax8-rtTA/ICN1/Ppargc1a mice exhibited improvement in renal fatty acid oxidation gene expression and apoptosis. Our results show that metabolic dysregulation has a key role in kidney fibrosis induced by sustained activation of the Notch developmental pathway and can be ameliorated by PGC-1α.
Keywords: PGC-1α, Notch, kidney fibrosis, fatty acid oxidation, mitochondria
Chronic kidney disease (CKD) has become an important public health problem worldwide. It is diagnosed by either reduction of the eGFR, quantified as estimated glomerular filtration rate (eGFR)<60 ml/min per 1.73 m2, or abnormal leakiness of the glomerulus to albumin as urine albumin-to-creatinine ratio >30 mg/g.1 Patients with CKD have at least three- to fivefold greater mortality rate compared with matched subjects without CKD.2–4
Interstitial fibrosis shows the strongest correlation with future functional decline. Kidney fibrosis is the final common pathway that is observed in all forms of CKD. Fibrosis represents a complex architectural change characterized by glomerulosclerosis; tubular atrophy; accumulation of myofibroblast, collagen, and inflammatory cells; and peritubular capillary loss.5
Renal tubular epithelial cells (RTECs) represent >90% of the kidney mass. RTECs are fundamental to maintain fluid and electrolyte balance, and they transport a large amount of water, electrolytes, and other small molecules from the primary filtrate. RTECs have high baseline metabolic needs. RTECs mostly rely on fatty acids as their primary fuel source and generate energy via mitochondrial oxidative phosphorylation. RTECs, therefore, have high levels of peroxisomal proliferator–activated receptor-α (PPARα), peroxisomal proliferator–γ coactivator-1α (PGC-1α), and a dense mitochondrial network to support their metabolic and functional needs.6,7
Patients and animal models of CKD are characterized by sustained expression of developmental genes, such as Wnt, Notch, and Hedgehog, in RTECs. Studies have shown the critical role and contribution of these pathways to kidney fibrosis development.8–11 Notch is a well known master regulator of cell specification, differentiation, and tissue patterning. In mammals, there are four Notch receptors (Notch1 to -4) and two classes of canonical ligands: Jagged 1 and 2 and Delta-like ligand 1, 3, and 4. The canonical Notch signaling pathway is initiated when the ligand binds to Notch receptors, thus causing proteolytic cleavage on the extracellular face by an ADAM/TACE protease and the intracellular side of the plasma membrane by γ-secretase. After the cleavage, the Notch intracellular domain translocates to the nucleus and forms a complex with RBPj and Mastermind-like proteins, leading to transcription of Notch target genes, such as helix-loop-helix proteins of the Hes and Hey families. Notch signaling is a crucial regulator of kidney development, although it is expressed at low level in normal healthy adults.12
It is hypothesized that, in CKD kidneys, Notch is activated in tubule cells in response to injury and cell death, likely as part of an injury repair mechanism.9,10,13,14 Sustained and high Notch expression seems to be harmful. Tubule-specific expression of Notch induces severe epithelial dedifferentiation and interstitial fibrosis and death of the animals. Notch is not only sufficient but also, necessary for fibrosis development, because inhibition of Notch signaling attenuates tubulointersitial fibrosis in a mouse model of folic acid– and ureteral obstruction–induced fibrosis.10
The mechanism of Notch-induced fibrosis is poorly understood. Several pathways have been proposed to contribute to Notch-induced development of fibrosis, including dedifferentiation, partial epithelial-to-mesenchymal transition (EMT), and enhanced proliferation.12,15 The role of these pathways has not been substantiated by in vivo studies. We hypothesized that metabolic alteration mediates the Notch (development pathway)–induced kidney fibrosis development, and we particularly tested the role of PGC-1α.
Results
Decreased PGC-1α Expression in Animal Models of Kidney Disease
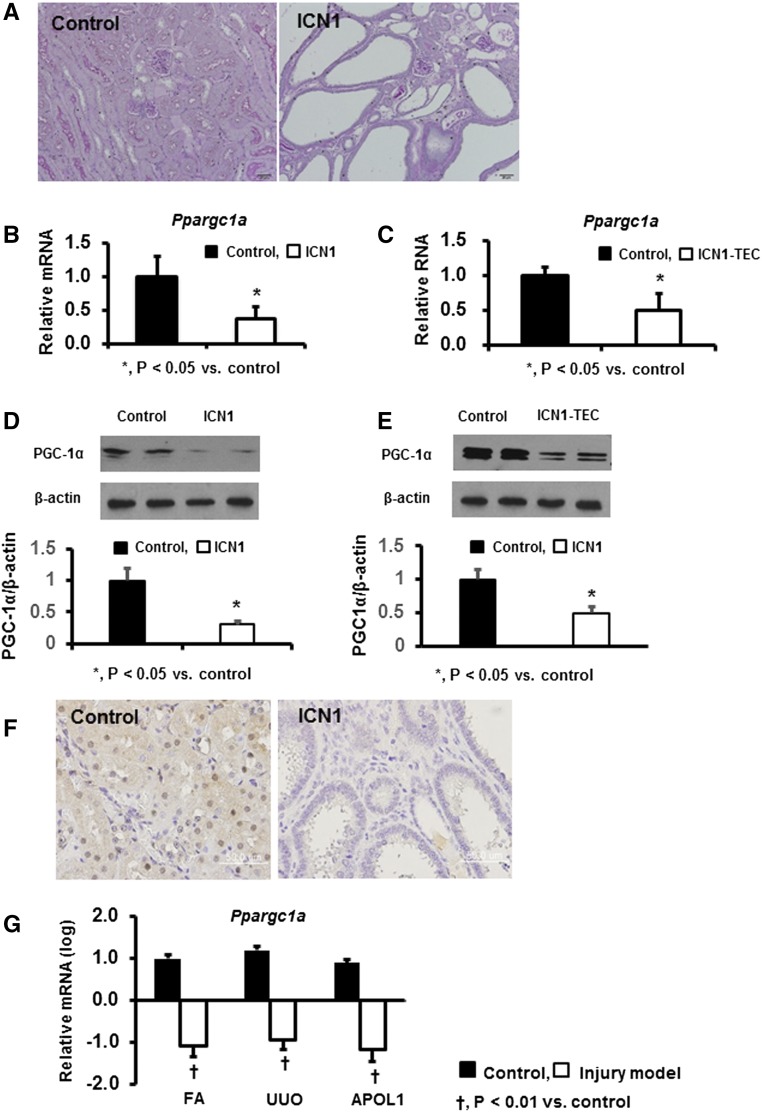
As we described earlier, conditional inducible expression of Notch1 in tubule cells (in the Pax8-rtTA/tetO-ICN1 transgenic mice) resulted in the development of severe fibrosis (Figure 1A). Transcript levels of Ppargc1a were significantly reduced in whole-kidney samples of these transgenic animals compared with controls (Figure 1B). Similarly, in vitro expression of Notch1 in cultured tubule cells resulted in reduced PGC-1α expression, indicating an inverse association between Notch and PGC-1α (Figure 1C). These findings were further confirmed at protein levels by Western blot analyses (Figure 1, D and E) and immunohistochemistry (Figure 1F).
Figure 1.
Decreased PGC-1α expression in animal models of kidney disease. (A) Representative periodic acid–Schiff-stained kidney sections of Pax8-rtTA/tetO-ICN1 transgenic and control mice. (B and C) Ppargc1a transcript levels in (B) Pax8-rtTA/tetO-ICN1 transgenic animals and (C) cultured renal tubule cells expressing Notch1. (D and E) Western blot images of PGC-1α protein expression levels in (D) Pax8-rtTA/tetO-ICN1 transgenic animals and (E) cultured renal tubule cells expressing Notch1. (F) Immunohistochemical staining of PGC-1α in Pax8-rtTA/tetO-ICN1 transgenic animals. (G) Transcript levels of Ppargc1a in whole-kidney lysates of three different fibrosis models induced by folic acid (FA), unilateral ureteral obstruction (UUO), and APOL1 transgenic expression.
To understand the generalizability of these observations, we examined Ppargc1a expression in different mouse models of kidney fibrosis. Gene expression changes were analyzed by RNA sequencing of whole-kidney lysates. PGC-1α level was reduced in toxin (folic acid)–induced kidney fibrosis and mice with obstruction (unilateral ureteral obstruction)–related kidney disease. Furthermore, PGC-1α expression was similarly reduced in a genetic model of CKD induced by transgenic expression of apo L1 (Figure 1G). These findings suggest that the decrease in expression of PGC-1α is consistent among all of the analyzed animal models of fibrosis and CKD.
Decreased PGC-1α Expression in Human Kidneys with Fibrosis
Next, we examined the expression of PGC-1α in patients with kidney disease. We quantified transcript levels of PPARGC1A in 95 microdissected human kidney tubule samples by Affymetrix microarrays.16,17 CKD was defined by reduced eGFR (<60 ml/min per 1.73 m2) as per the National Kidney Foundation guidelines.1 In our dataset, 39 (41.1%) samples met the criteria for CKD.18 As expected, CKD samples also showed significantly higher glomerulosclerosis and interstitial fibrosis. Demographics and clinical characteristics of these samples are shown in Supplemental Table 1.
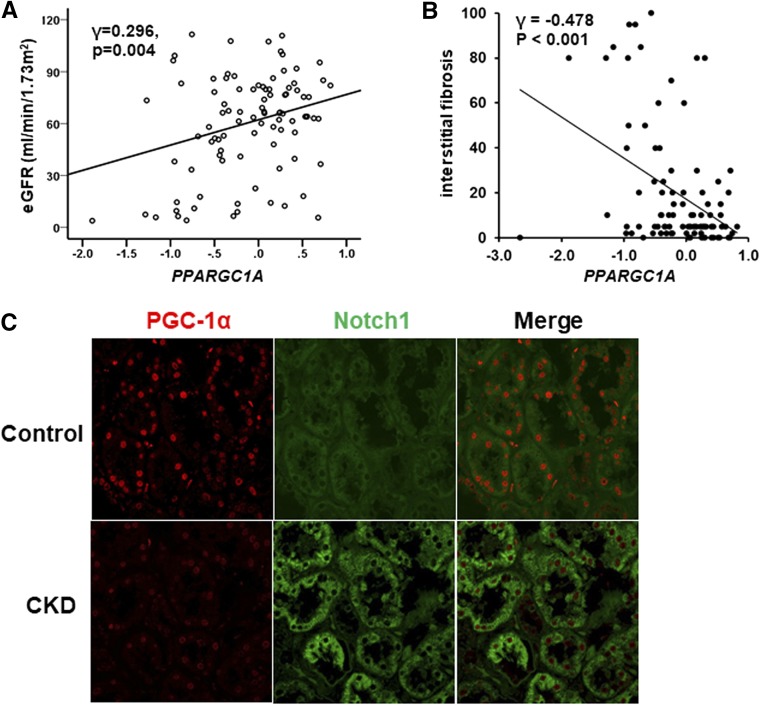
We found that, in patient samples, PPARGC1A transcript levels significantly and positively correlated with eGFR (Figure 2A) and negatively correlated with interstitial fibrosis (Figure 2B). Immunohistochemical analysis confirmed the transcript-level data. Double-immunofluorescence study showed that PGC-1α was expressed in bot proximal and distal tubules (Supplemental Figure 1). The nuclear expression of PGC-1α was evident by immunostaining of control human kidneys, but it was significantly decreased in CKD (Figure 2C). Notably, the staining remained on healthy segments of diseased kidneys. In summary, our analysis indicates that PGC-1α expression correlates with kidney function in patient samples.
Figure 2.
Decreased PGC-1α expression in human fibrotic kidney samples. (A) Correlation between eGFR and PPARGC1A transcript level. (B) Correlation between interstitial fibrosis and PPARGC1A transcript level. (C) Representative images of double-immunofluorescence staining with antibodies against PGC-1α and Notch1 in control and diseased human samples.
We have also performed double-immunofluorescence staining with antibodies against Notch1 and PGC-1α in human kidney samples. Interestingly, in tubules with high expression of Notch1, PGC-1α expression was low. In contrast, Notch1 staining was weak in tubules with high PGC-1α activity (Figure 2C). This finding suggests an inverse relationship between Notch signaling and PGC-1α.
Notch1 Directly Regulates PGC-1α
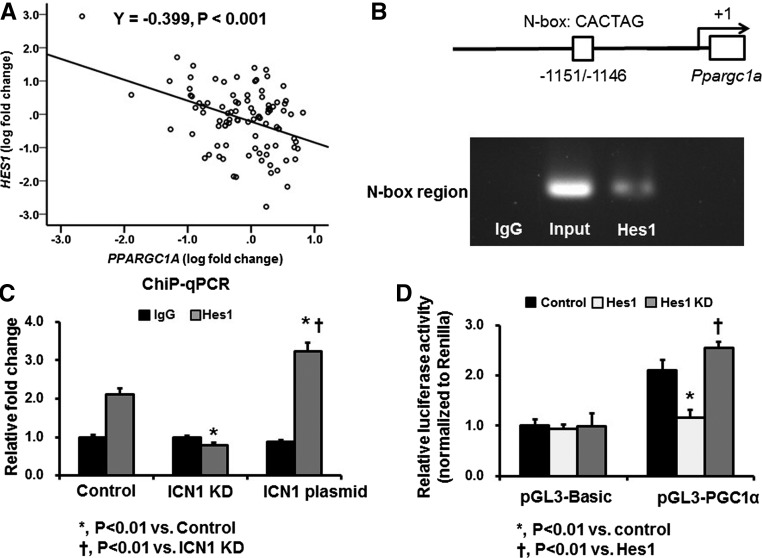
We then explored the cellular and molecular mechanisms by which Notch1 signaling regulates PGC-1α in RTECs. Using microarray data from human kidney tubule samples, we examined the correlation between PPARGC1A and Notch pathway genes. We found that, among several Notch receptors, ligands, and target genes, HES1 shows the strongest correlation with PPARGC1A (Figure 3A, Supplemental Table 2). Therefore, we hypothesized that Hes1 might be directly regulating the expression of PGC-1α. To test this hypothesis, we performed chromatin immunoprecipitation (ChIP) assay using primers spanning the putative Hes1-responsive element region within the N-box flanking region of Ppargc1a. This region has been reported to have regulatory function in mouse RTECs.19 The ChIP assay indicated direct binding of Hes1 to the Ppargc1a promoter region (Figure 3B). The enrichment of Hes1 binding region in the Ppargc1a promoter was significantly decreased by Hes1 knockdown, whereas it was increased by Intracellular Notch1 (ICN1) plasmid transfection (Figure 3C). To substantiate this finding, we also carried out a luciferase reporter assay. Ppargc1a promoter–driven luciferase reporter activity was significantly lower on Hes1 overexpression. In contrast, Hes1 overexpression significantly decreased this activity (Figure 3D). These findings together suggest that the transcriptional repressor Hes1 (a downstream target of Notch1 signaling) can directly regulate Ppargc1a in RTECs.
Figure 3.
Hes1 directly regulates PGC-1α. (A) Correlation between PPARGC1A and HES1 transcript levels in 95 microdissected human kidney tubule samples. (B) ChIP assay using a primer spanning the putative Hes1-responsive element region within the N-box flanking region of Ppargc1a. (C) ChIP assay after knockdown (KD) of ICN1 and ICN1 plasmid transfection. (D) Luciferase reporter activity assay using TECs obtained from primary culture after cotransfection of pGL3-PGC-1α and Hes1 plasmid or Hes1-deficient plasmid.
Tubule-Specific Overexpression of Ppargc1a Ameliorates Notch1-Induced Kidney Injury
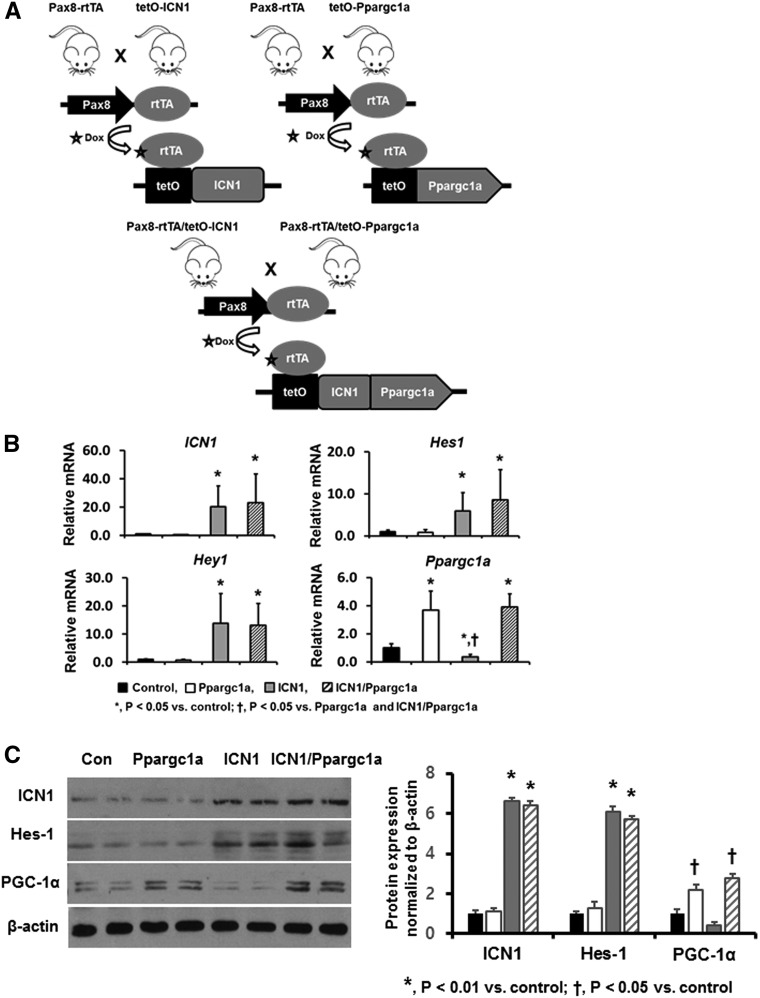
Next, we hypothesized that decreased PGC-1α expression and a downstream metabolic defect are involved in Notch-induced fibrosis development in vivo. To investigate the functional role of PGC-1α, we generated mice with conditional inducible overexpression of Ppargc1a in RTECs, and we crossed mice expressing Pax8-rtTA/tetO-Ppargc1a with mice harboring Pax8-rtTA/tetO-ICN1 to create Pax8-rtTA/tetO-ICN1/tetO-Ppargc1a mice (Figure 4A). Littermates of tetO-ICN1 or tetO-Ppargc1a mice (without Pax8-rtTA) served as controls. As expected, transcript levels of ICN1 in whole-kidney tissue of Pax8-rtTA/tetO-ICN1 and Pax8-rtTA/tetO-ICN1/tetO-Ppargc1a mice were significantly higher than in control animals. In addition, mRNA expression levels of Notch target genes, Hes1 and Hey1, were also higher in mice overexpressing Notch1 (Figure 4B). The mRNA expression of Ppargc1a was significantly increased in mice with tubule-specific PGC-1α expression (Figure 4B). Western blot analyses also confirmed these results (Figure 4C). At baseline, Pax8-rtTA/tetO-Ppargc1a mice did not show gross or histologic abnormalities and were born at the expected Mendelian ratio. As described above, the Pax8-rtTA/tetO-ICN1 mice became very sick and died at around approximately 6 weeks after the initiation of doxycycline-containing chow.
Figure 4.
Generation of mice with conditional inducible overexpression of ICN-1 and Ppargc1a. (A) Schematic figure depicting generation of mice with tubule-specific overexpression of ICN-1 and Ppargc1a. (B) qPCR analysis of ICN1, Hes1, Hey1, and Ppargc1a transcript levels in kidneys of control, Pax8-rtTA/tetO-Ppargc1a, Pax8-rtTA/tetO-ICN1, and Pax8-rtTA/tetO-ICN1/tetO-Ppargc1a mice. (C) Western blot images of ICN1, Hes1, and PGC-1α protein levels in the same mice.
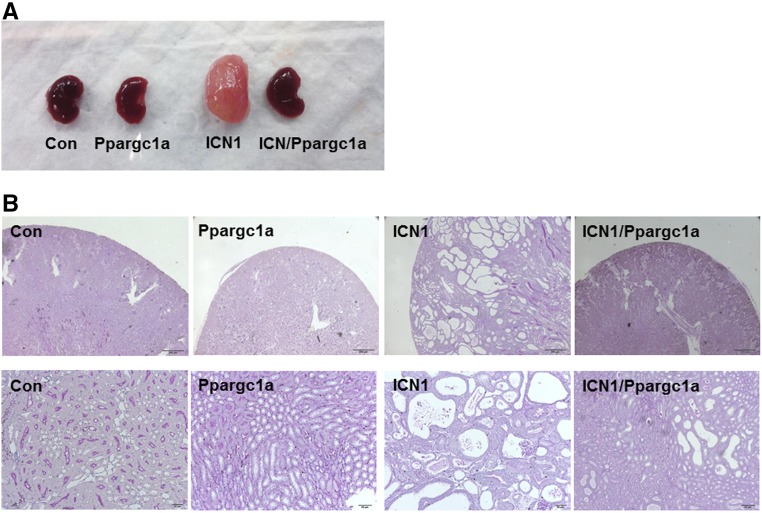
We did not observe gross phenotypic abnormalities or increased mortality in triple-transgenic (Pax8-rtTA/tetO-ICN1/tetO-Ppargc1a) animals. Animals were euthanized 6 weeks after the initiation of doxycycline-containing food. As seen in our previous studies, kidneys were enlarged in Pax8-rtTA/tetO-ICN1 mice compared with controls (Figure 5A). Normal renal architecture was lost, and kidneys showed severe tubular degeneration, dilation, and interstitial fibrosis (Figure 5B). The interstitium was widened with accumulation of matrix and activated myofibroblasts. In contrast, kidney size was close to normal in Pax8-rtTA/tetO-ICN1/tetO-Ppargc1a mice. Tubule dilation was significantly attenuated, and fibrosis was markedly ameliorated in triple-transgenic mice compared with Pax8-rtTA/tetO-ICN1 mice (Figure 5B).
Figure 5.
Phenotypic characterization of kidneys from Pax8-rtTA/tetO-Ppargc1a, Pax8-rtTA/tetO-ICN1, and Pax8-rtTA/tetO-ICN1/tetO-Ppargc1a mice. (A) Gross morphology. (B) Representative images of periodic acid–Schiff-stained kidney sections from control, Pax8-rtTA/tetO-Ppargc1a, Pax8-rtTA/tetO-ICN1, and Pax8-rtTA/tetO-ICN1/tetO-Ppargc1a mice.
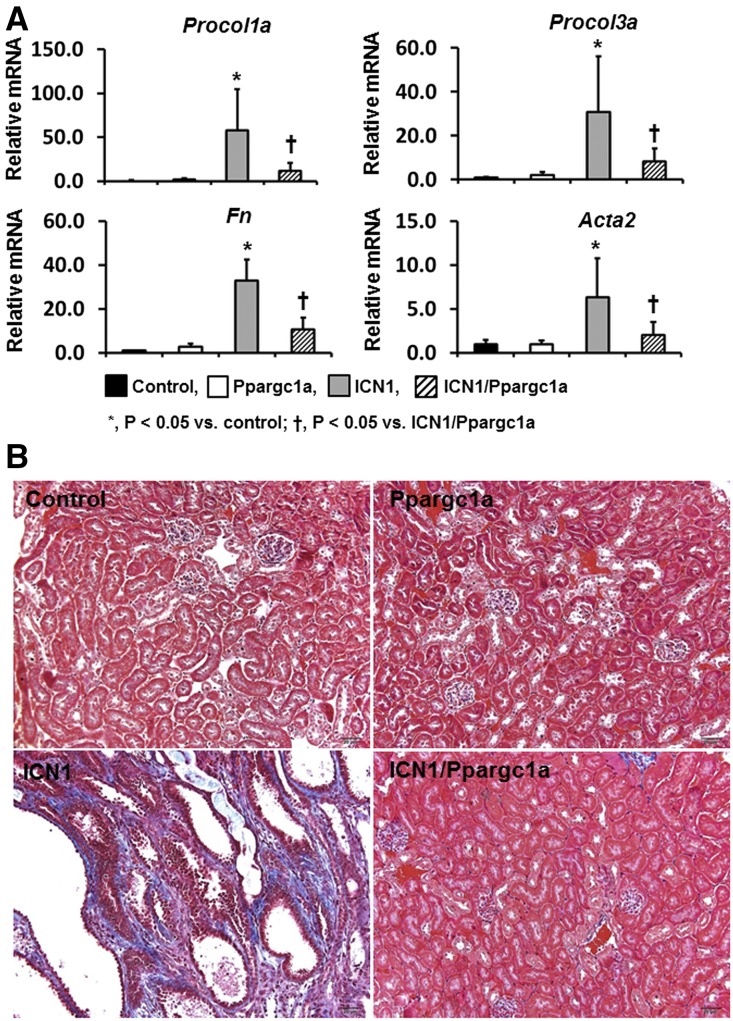
In line with the morphologic alterations, quantitative real-time PCR (qPCR) analysis showed that transcript levels of profibrotic genes, such as procollagen 1al (Procol1a1), Procol3a1, fibronectin (Fn), and smooth muscle α-actin, were significantly increased in Pax8-rtTA/tetO-ICN1 mice compared with control and Pax8-rtTA/tetO-Ppargc1a mice (Figure 6A). In addition, expressions of inflammatory markers, such as Cd68 and F4/80, were significantly higher in mice with ICN1 overexpression (Supplemental Figure 2). These changes were significantly reduced in Pax8-rtTA/tetO-ICN1/tetO-Ppargc1a mice. Masson trichrome staining, which showed severe fibrosis in mice expressing Notch1, indicated significant attenuation in mice expressing PGC-1α (Figure 6B). In summary, mice with tubule-specific expression of PGC-1α were protected from Notch1-induced kidney fibrosis.
Figure 6.
Tubule-specific overexpression of Ppargc1a ameliorates Notch1-induced kidney injury. (A) Transcript levels of Procol1a1, Procol3a1, Fn1, and smooth muscle α-actin (Acta2) in whole-kidney lysates of Pax8-rtTA/tetO-Ppargc1a, Pax8-rtTA/tetO-ICN1, and Pax8-rtTA/tetO-ICN1/tetO-Ppargc1a mice. (B) Representative images of Masson trichrome staining of each group.
PGC-1α Restores Impaired Mitochondrial Morphology and Fatty Acid Oxidation Defect Induced by Notch1 Overexpression In Vitro
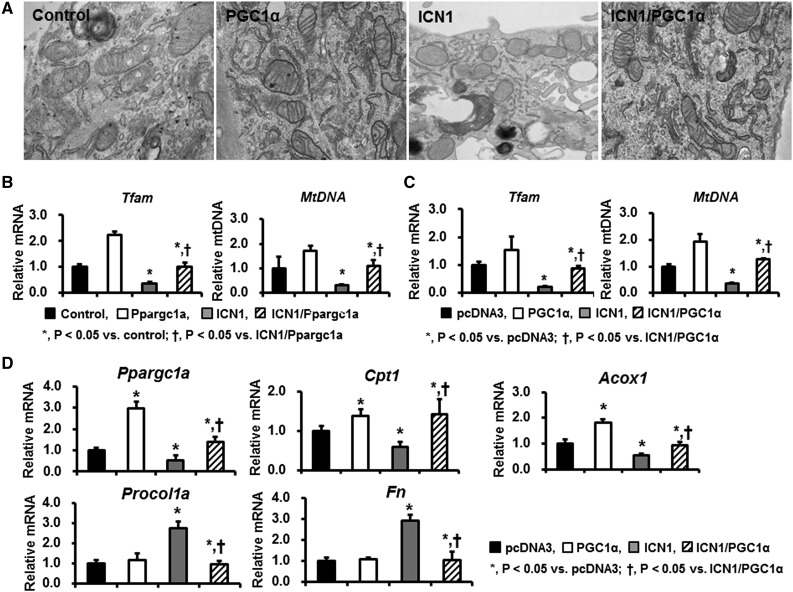
PGC-1α is a key regulator of mitochondria biogenesis. Thus, we then evaluated morphologic changes of mitochondria in TECs overexpressing ICN1 and/or PGC-1α. Primary tubule cells were transfected with Notch1- and PGC-1α–containing plasmids. Expressions of Notch target genes (such as Hes1) were increased after ICN1 transfection (data not shown). Electron microscopic analysis identified normally looking and elongated mitochondria with intact cristae in TECs transfected with control (pcDNA3) or PGC-1α plasmids. By contrast, mitochondrial structure was lost, and mitochondria appeared fragmented small and round in RTECs expressing ICN1. Morphologic alterations in mitochondria were almost abrogated in ICN1-expressing cells on PGC-1α expression (Figure 7A).
Figure 7.
PGC-1α restores the impaired mitochondrial morphology and fatty acid oxidation pathway induced by Notch1 overexpression. (A) Representative transmission electron microscopy images of TECs transfected with pcDNA3, PGC-1α, ICN1, and ICN1/PGC-1α plasmids. (B) The mRNA expression of Tfam and mtDNA in control, Pax8-rtTA/tetO-Ppargc1a, Pax8-rtTA/tetO-ICN1, and Pax8-rtTA/tetO-ICN1/tetO-Ppargc1a mice and (C) cultured TECs transfected with pcDNA3, PGC-1α, ICN1, and ICN1/PGC-1α plasmids. (D) qPCR assay for fatty acid oxidation–related profibrotic markers in controls and TECs transfected with PGC-1α, ICN1, and ICN1/PGC-1α plasmids.
In parallel, PGC-1α expression also attenuated the Notch-induced reduction of mitochondrial transcripts, such as Tfam and mtDNA, in cells expressing ICNotch1 (Figure 7C).
We then examined transcript levels of fatty acid oxidation–related genes induced by Notch expression (Figure 7D). Cells expressing ICN1 plasmid had significantly reduced transcript levels of Ppargc1a, carnitine palmitoyl transferase 1 (Cpt1), and Acox. These alterations were attenuated by PGC-1α cotransfection. Notch expression in TECs resulted in increased expression of profibrotic genes. The increased expression of profibrotic genes, such as Procol1a and Fn, were attenuated by PGC-1α. In summary, in cultured cells, Notch induced changes of mitochondrial transcript level and structural mitochondrial defects. PGC-1α reversed mitochondrial defects induced by Notch expression.
PGC-1α Attenuates Alteration of Fatty Acid Oxidation and Notch1-Induced Kidney Injury In Vivo
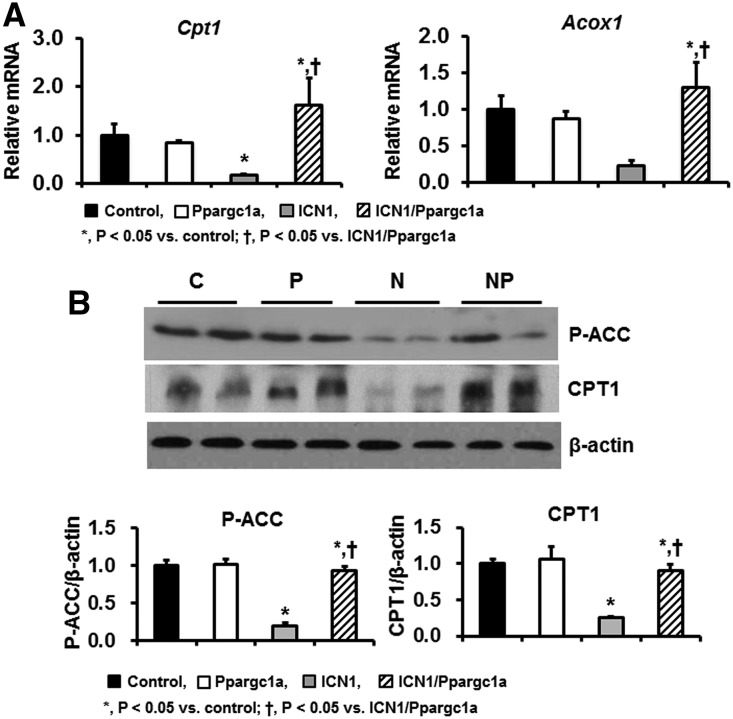
Next, we examined the effects of PGC-1α on Notch1-induced kidney injury in vivo. We quantified transcript levels of genes related to fatty acid oxidation. In Pax8-rtTA/tetO-ICN1 mice, mRNA expression levels of Cpt1 and Acox1 were significantly decreased compared with in control mice. PGC-1α expression almost completely normalized Cpt1 and Acox1 levels in vivo (Figure 8A). Western blot analysis revealed that protein levels of phosphoacetyl-CoA carboxylase and CPT1 were significantly decreased in Pax8-rtTA/tetO-ICN1 mice but restored in Pax8-rtTA/tetO-ICN1/tetO-Ppargc1a mice (Figure 8B).
Figure 8.
PGC-1α improves altered fatty acid oxidation and Notch1-induced kidney injury. (A) qPCR assay for fatty acid oxidation–related genes in kidneys of control, Pax8-rtTA/tetO-Ppargc1a, Pax8-rtTA/tetO-ICN1, and Pax8-rtTA/tetO-ICN1/tetO-Ppargc1a mice. (B) Representative images and quantification of Western blot analyses for phosphoacetyl-CoA carboxylase (P-ACC) and CPT1 in these mice groups. C, control; P, Pax8-rtTA/tetO-Ppargc1a; N, Pax8-rtTA/tetO-ICN1; NP, Pax8-rtTA/tetO-ICN1/tetO-Ppargc1a.
Previously, we showed that tubule epithelial cell proliferation was increased in Pax8-rtTA/tetO-ICN1 mice.10 Immunohistochemical staining showed an increased number of PCNA- and Ki67-positive cells in Pax8-rtTA/tetO-ICN1 mice, which was significantly lower in Pax8-rtTA/tetO-ICN1/tetO-Ppargc1a mice (Supplemental Figure 3).
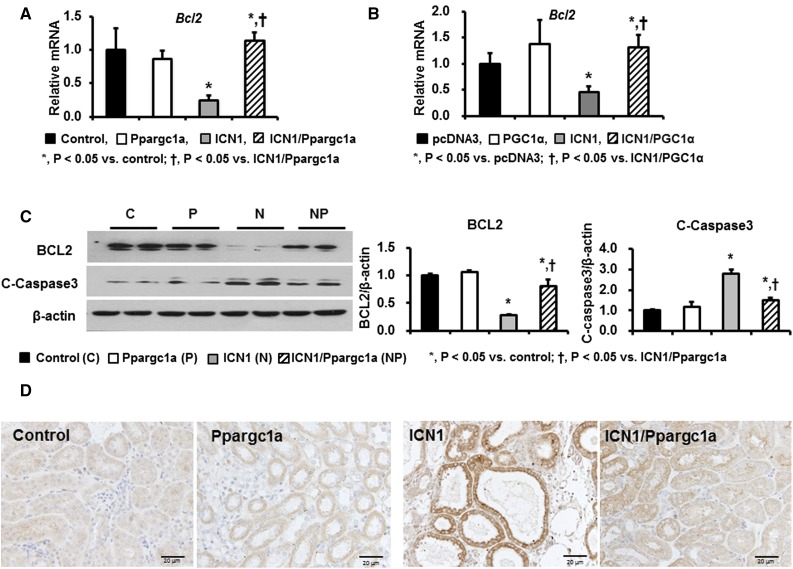
Next, we tested whether Notch1-induced apoptotic cell death was also attenuated by PGC-1α. qPCR analysis indicated that mRNA expression levels of B cell CLL/lymphoma 2 (Bcl2), an antiapoptotic gene, were significantly lower in Pax8-rtTA/tetO-ICN1 mice (Figure 9A) and RTECs transfected with the ICN1 plasmid (Figure 9B). Western blot analysis confirmed the decreased BCL2 levels in mice with tubule-specific Notch1 overexpression (Figure 9C). Notch transgenic mice also showed increased cleaved caspase 3 levels, likely consistent with increased apoptosis. Ppargc1a expression protected from the Notch induced increased apoptosis as examined by cleaved caspase 3 immunostaining (Figure 9D). In summary, in vivo expression of PGC-1α improved fatty acid oxidation, reduced apoptosis, and ameliorated kidney fibrosis.
Figure 9.
PGC-1α overexpression in TECs attenuates Notch1-induced apoptotic cell death. (A) Relative mRNA level of Bcl2 in control, Pax8-rtTA/tetO-Ppargc1a, Pax8-rtTA/tetO-ICN1, and Pax8-rtTA/tetO-ICN1/tetO-Ppargc1a mice. (B) Relative mRNA level of Bcl2 in control and TECs transfected with PGC-1α, ICN1, and ICN1/PGC-1α plasmids. (C) Representative images and quantification of Western blot analyses for BCL2 and cleaved caspase 3 in four mice groups. (D) Representative immunohistochemical staining with cleaved caspase 3 in control, Pax8-rtTA/tetO-Ppargc1a, Pax8-rtTA/tetO-ICN1, and Pax8-rtTA/tetO-ICN1/tetO-Ppargc1a mice. C, control; P, Pax8-rtTA/tetO-Ppargc1a; N, Pax8-rtTA/tetO-ICN1; NP, Pax8-rtTA/tetO-ICN1/tetO-Ppargc1a.
Discussion
Sustained Notch activation has been described in patients and mouse models of CKD.8–10 Notch activation is likely secondary to kidney injury and a part of a regenerative response. Indeed, increased activity of other regenerative pathways, such as Wnt and Hedgehog, has also been shown in fibrosis. Increased Notch activity is associated with higher tubule proliferation. Notch-induced proliferation may play an important role in epithelial repair and regeneration after an acute injury.12 In animal models of CKD, sustained Notch expression in RTECs is both sufficient and necessary for fibrosis development and disease progression. This study aimed to elucidate the mechanism of Notch-induced development of fibrosis in renal tubule cells. During development and in in vitro settings, Notch is a strong inducer of EMT,15,20 but the role of EMT in fibrosis development is a highly controversial issue.21
Here, we specifically asked the question of whether metabolic alterations are involved in Notch-induced fibrotic process. Our gene array analysis highlighted the lower expression of PGC-1α, mitochondrial transcripts, and enzymes involved in fatty acid oxidation. In addition, we evaluated the direct interaction between Notch1 and PGC-1α by ChIP and luciferase reporter assays and found that Notch signaling directly modulates transcriptional activity of PGC-1α in RTECs. Several recent reports suggest that Notch is a key regulator of metabolism.19,22,23 A study by Bi et al.19 showed that constitutive activation of Notch signaling inhibits Ppargc1a transcription in white adipocytes, showing the binding of Hes1 to the Ppargc1a regulatory region. Taken together, these findings suggest that PGC-1α seems to be a direct target of RTECs.
PGC-1α is a master regulator of mitochondrial biogenesis.24 Mitochondria are the powerhouse of the cell, and they play an important role in cellular homeostasis. Because RTECs have high energy–demanding function, mitochondrial dysfunction and reduced energy supply have been described in patients and animal models of CKD. Dysfunctional mitochondria eventually jeopardize cell viability,25,26 leading to cell death and dedifferentiation. PGC-1α orchestrates mitochondrial biogenesis by interacting with estrogen-related receptor-α, peroxisome proliferator–activated receptors, and nuclear respiratory factors 1 and 2, thereby increasing mitochondrial mass and overall mitochondrial function.6,27,28
Earlier studies indicated that mRNA expression of Ppargc1a was decreased in models of AKI by cisplantin.29 Transcript levels of PPARGC1A were notably decreased in patients with CKD compared with controls.30 In addition, mRNA expression of Ppargc1a was significantly reduced in not only models of Notch1 but also, unilateral ureteral obstruction–, folic acid– and APOL1-induced fibrosis models. Here, we show that PGC-1α is not only regulated by Notch but is involved in Notch-induced fibrosis development. Transgenic expression of PGC-1α was able to ameliorate Notch-induced fibrosis development. Our results indicate that metabolic dysregulation plays a key role in cellular dedifferentiation and that providing sufficient metabolic input can prevent RTECs from Notch-induced dedifferentiation, death, and fibrosis development.
In conclusion, in this study, we showed that Notch induces downregulation of PGC-1α, impairment of fatty acid oxidation, and mitochondrial dysfunction. PGC-1α is a direct Notch target gene, and genetic re-expression of PGC-1α in RTECs abrogates Notch-induced kidney fibrosis. Our findings suggest that metabolic pathways play a key role in Notch (a developmental pathway)-induced fibrosis development and that restoration of PGC-1α activity could be a promising treatment strategy against CKD.
Concise Methods
Generation of Mice Overexpressing ICN1 and/or Ppargc1a in the RTECs
Transgenic mice harboring the tetO-ICN1 transgene have been described previously.31 FVB-Tg (tetO-Ppargc1a)1Dpk/J mice were purchased from the Jackson Laboratory. To generate mice with conditional inducible expression of Notch1 and PGC-1α in RTECs, Pax8-rtTA mice were crossed with tetO-ICN1 and tetO-Ppargc1a mice, respectively. We identified transgenic mice by genomic PCR analysis using transgene-specific primers. The primer sequences for tetO-ICN1 and tetO-Ppargc1a are presented in Table 1. Mice were put on a doxycycline-containing chow diet (Bioserv S3888) starting at 4 weeks of age. Animal care and experiments were performed in accordance with the National Institutes of Health guidelines and approved by the Animal Care Committee at Perelman School of Medicine, University of Pennsylvania.
Table 1.
Sequences of oligonucleotide primers used for qPCR test
| Gene | Forward | Reverse |
|---|---|---|
| Ubc | GCCCAGTGTTACCACCAAGAAG | GCTCTTTTTAGATACTGTGGTGAGGAA |
| Ppargc1a | AGTCCCATACACAACCGCAG | CCCTTGGGGTCATTTGGTGA |
| Hes1 | CCCCAGCCAGTGTCAACAC | TGTGCTCAGAGGCCGTCTT |
| Hey1 | GCCTCCGACCCGCTTCT | TGGGATGCGTAGTTGTTGAGAT |
| Procol1a1 | GCCAAGAAGACATCCCTGAA | GTTTCCACGTCTCACCATTG |
| Procol3a1 | ACAGCTGGTGAACCTGGAAG | ACCAGGAGATCCATCTCGAC |
| Fn | ACAAGGTTCGGGAAGAGGTT | CCGTGTAAGGGTCAAAGCAT |
| Acta2 | CTGACAGAGGCACCACTGAA | AGAGGCATAGAGGGACAGCA |
| Cpt1 | GGTCTTCTCGGGTCGAAAGC | TCCTCCCACCAGTCACTCAC |
| Acox1 | cttggatggtagtccggaga | tggcttcgagtgaggaagtt |
| Bcl-2 | TGGGATGCCTTTGTGGAACT | CAGCCAGGAGAAATCAAACAGA |
| Tfam | GGAATGTGGAGCGTGCTAAAA | TGCTGGAAAAACACTTCGGAATA |
qPCR Analyses
We compared transcript levels of genes related to Notch signaling, β-oxidation, apoptosis, and dedifferentiation (Procol1a1, Procol3a1, Fn, and smooth muscle α-actin) by qPCR. To this end, total RNA samples from mouse kidney were prepared using the RNeasy Mini Kit (Qiagen, Valencia, CA). We examined the RNA quality on agarose gels and determined the quantity using NanoDrop. Next, 1 μg total RNA was reverse transcribed using the cDNA Archival Kit (Applied Biosystems). We performed qPCR analysis on a ViiA Seven Real-Time PCR System (Life Technologies) with the SYBR Green Master Mix using three-step standard cycling conditions with sequence-specific primers. The sequences of primers are presented in Table 1. We examined the melting curve to confirm that a single PCR product was amplified. For quantitative analysis, samples were normalized to Ubiquitin C gene expression by the ΔΔCT value method.
Mitochondrial DNA Analyses
Genomic DNA was extracted from kidney and cells using a commercially available kit (Wizard Genomic DNA Purification Kit; Promega, Madison, WI) according to the manufacturerʼs instructions. qPCR was then conducted with primers specific for the mtDNA-encoded Cox1 gene and the nuclear-encoded Ndufv1 gene; the relative mtDNA copy number was presented as the mtDNA-to-nuclear DNA ratio.
Western Blot Analyses
Protein expression levels of key enzymes of the fatty acid oxidation pathway and apoptosis markers were examined by Western blot analyses. We prepared cell lysates in RIPA lysis buffer containing a protease inhibitor cocktail (cOmplete Mini; Roche) and phosphatase inhibitor (PhosSTOP; Roche). Proteins were resolved by electrophoresis on 5%–15% gradient gels, transferred onto polyvinylidene difluoride membranes, and probed with the antibodies against the following proteins; phosphoacetyl-CoA carboxylase (3661; Cell Signaling Technology), CPT1 (ab176320; Abcam, Cambridge, United Kingdom), Hes1 (ab108937; Abcam), activated Notch1 (ab8925; Abcam), PGC-1α (ab54481; Abcam), BCL2 (sc-509; Santa Cruz Biotechnology, Santa Cruz, CA), cleaved caspase 3 (9664; Cell Signaling Technology), and β-actin (A5316; Sigma-Aldrich). A horseradish peroxidase–conjugated anti-rabbit (7074; Cell Signaling Technology) or anti-mouse IgG antibody (7076; Cell Signaling Technology) was served as a secondary antibody. After repeated washes, the membrane was developed by chemiluminescence (Western Lightning-ECL; Thermo Scientific). To quantify the band densities, we used ImageJ v1.49 software (National Institutes of Health, Bethesda, MD; online at http://rsbweb.nih.gov/ij).
Histology and Immunohistochemistry
To evaluate histologic features, formalin-fixed, paraffin-embedded kidney sections were stained with periodic acid–Schiff. We also performed Masson trichrome staining and immunohistochemical analysis. All slide pictures were captured using an Olympus DP73 microscope.
For Masson trichrome staining, 5-μm-thick sections of paraffin-embedded tissues were deparaffinized, hydrated in ethyl alcohol, washed in tap water, and refixed in Bouin solution at 56°C for 1 hour. After washing in running tap water for 10 minutes and staining with Weigert iron hematoxylin working solution for 10 minutes, we stained the slices with the Biebrich scarlet acid fuchsin solution for 15 minutes followed by a 10-minute wash. The slides were then differentiated in phosphomolybdic-phosphotungstic acid solution for 15 minutes, transferred to an aniline blue solution, and stained for 10 minutes, and they were reacted with 1% acetic acid solution for 5 minutes.
For immunohistochemical staining, the tissue slices were deparaffinized, hydrated in ethyl alcohol, and washed in tap water. Antigen retrieval was carried out in 1 mM EDTA, pH 8.0, by microwaving for 15 minutes. Endogenous peroxidase activity was blocked with 3% H2O2 for 10 minutes. The slices were blocked in 0.2% fish skin gelatin for 60 minutes at room temperature and incubated overnight at 4°C with a rabbit anticleaved caspase 3 (1:100; Cell Signaling Technology) antibody, rabbit anti–PGC-1α (1:250; ab54418; Abcam) antibody, a rat anti-mouse F4/80 (1:100; MCA497GA; Bio-Rad) antibody, a mouse anti-mouse CD68 (1:100; ab31630; Abcam) antibody, a rabbit anti-mouse Ki67 (1:100; ab15580; Abcam), and a rabbit anti-PCNA (1:200; PA5–16797; Thermo Scientific). Staining was visualized using horseradish peroxidase–conjugated antibodies against rabbit IgG and 3,3-diaminobenzidine by means of the Dako Envision Kit as per the manufacturer’s protocol (Vector Laboratories).
For double-immunofluorescence staining using human kidney samples, sections were deparaffinized and hydrated followed by microwave antigen retrieval in 10 mM sodium citrate, pH 6.0. Sections were blocked in 5% normal goat serum for 30 minutes at room temperature and incubated in a rabbit anti–PGC-1α (Abcam) and a rabbit anti-Notch1 (Abcam) overnight at 4°C. Anti-mouse Alexa Fluor 488 (1:200; 4408; Cell Signaling Technology) and anti-rabbit Alexa Fluor 555 (1:200; 4413; Cell Signaling Technology) were applied, and nuclei were stained with DAPI. To examine the localization of PGC-1α expression in tubules, sections were incubated with fluorescein lotus tetraglonolobus lectin (1:200; FL1321; Vector Laboratories), a proximal tubule marker, which was added for 60 minutes on the following day.
Primary Cell Cultures and Transfection
RTECs were isolated from wild-type mice. The cells were cultured in the RPMI 1640 medium (Gibco) containing 10% FBS (Gibco), 100 U/ml penicillin G (Sigma-Aldrich), 2.5 μg/ml amphotericin B (Sigma-Aldrich), and 20 ng/ml EGF (Sigma-Aldrich). In short, kidneys were dissected, placed in 1 ml ice-cold DPBS (CellGro), and minced into pieces of approximately 1 mm3. These pieces were transferred and digested for 60 minutes at 37°C, and the supernatants were sieved through a 100-μm nylon mesh. After centrifugation for 10 minutes at 3000 rpm, the pellet was resuspended in sterile red blood cell lysis buffer (8.26 g NH4Cl, 1 g KHCO3, and 0.037 g EDTA per 1 L ddH2O) and seeded in 10-cm culture dishes. At confluence of approximately 70%, the cells were transfected with pCDNA3, ICN1 plasmid, PGC-1α plasmid, scramble siRNA, and ICN1 siRNA (Dharmacon, Lafayette, CO) or both ICN1 and PGC-1α plasmids (Addgene, Cambridge, MA) using Lipofectamine 2000 and Plus reagents (Invitrogen). Next, 24 hours after transfection, media were changed to serum-free media, and the cells were incubated for an additional 48 hours.
ChIP Assay
ChIP assay was conducted as previously described.32 Briefly, 2×10⁷ primary culture cells were crosslinked, washed, and sonicated. The resulting lysates were subjected to immunoprecipitation with antibodies against Hes1 (Abcam) or control IgG (Santa Cruz Biotechnology). Protein A agarose/Salmon Sperm DNA (Temecula, CA) was used to capture the immunoprecipitates. After washing, bound proteins were eluted, and ChIP-enriched DNA was isolated by phenol:chloroform extraction. The eluted ChIP DNA and input control samples were analyzed by qPCR using the following primer pair within the Ppargc1a enhancer promoter. The primer sequences were sense 5′-TTTCAGTGTTTTTCCTTCATT-3′ and antisense 5′-CCCAGAAAACAAATGCTAGA-3′. Data were analyzed by the two methods and normalized to the input samples as described elsewhere.32
Luciferase Assay
The PGC-1α promoter luciferase plasmid was purchased from Addgene. Primary TECs were obtained as described above and seeded in six-well plates. The next day, 100 ng Renilla luciferase–encoding plasmid, 400 ng pGL-basic or pGL3–PGC-1α plasmid, 600 ng Hes1 plasmid (OriGene), and 100 nM Hes1 siRNA (Dharmacon) were cotransfected using Lipofectamine 2000 according to the manufacturer’s instructions. The cells were harvested 24 hours after transfection and analyzed with the Dual-Luciferase Reporter Assay System (Promega). Luminescence was measured on a CentroXS3 LB9601 luminometer. Luciferase activity of each group was normalized to Renilla luciferase activity, and between-group differences were expressed as relative fold changes.
Electron Microscopic Examination
We next examined mitochondrial structure by standard transmission electron microscopy. Primary RTECs were fixed with a mixture of 2% paraformaldehyde and 2.5% glutaraldehyde overnight, washed, dehydrated, and embedded in a resin according to standard procedures. Mitochondria were examined under a JEOL 1011 microscope (JEOL, Tokyo, Japan).
Human Kidney Samples and Microarray Analyses
We compared PPARGC1A transcript levels in the kidneys of healthy controls and patients with CKD using microarray data from our earlier work. Human kidney samples were obtained from routine surgical nephrectomies, and tubule and glomerular compartments were separately collected by microdissection. The microdissected tubule samples were subjected to a microarray experiment on the Affymetrix platform. The detailed method was described previously.16,17 Before the procedure, all of the samples were deidentified, and the corresponding clinical information was collected by an individual who was not involved in the research protocol (honest broker). The study was approved by the institutional review board.
Statistical Analyses
Statistical analysis was performed using the statistical package SPSS software version 20.0 for Windows (SPSS, Chicago, IL). All of the results are presented as mean±SD. To analyze a difference between two groups, t test was used. Bonferroni correction was applied when more than two groups were present. Difference with P values <0.05 were considered statistically significant.
Disclosures
The laboratory of K.S. received research support from Biogen, Lilly, Boehringer Ingelheim, GSK, Regeneron, ONO Pharma, and Celgene for work not related to this project.
Supplementary Material
Acknowledgments
This work was supported by faculty research grant 6-2015-0119 from Yonsei University College of Medicine for 2015 and a research grant from Hanmi Pharmaceuticals, Co., Ltd., and work in the laboratory of K.S. is supported by National Institutes of Health grant DK076077. M.W. thanks the China Scholarship Council for fellowship support through grant 3022 (2015).
Footnotes
Published online ahead of print. Publication date available at www.jasn.org.
This article contains supplemental material online at http://jasn.asnjournals.org/lookup/suppl/doi:10.1681/ASN.2017020130/-/DCSupplemental.
References
- 1.National Kidney Foundation : K/DOQI clinical practice guidelines for chronic kidney disease: Evaluation, classification, and stratification. Am J Kidney Dis 39[Suppl 1]: S1–S266, 2002 [PubMed] [Google Scholar]
- 2.Saran R, Li Y, Robinson B, Ayanian J, Balkrishnan R, Bragg-Gresham J, Chen JT, Cope E, Gipson D, He K, Herman W, Heung M, Hirth RA, Jacobsen SS, Kalantar-Zadeh K, Kovesdy CP, Leichtman AB, Lu Y, Molnar MZ, Morgenstern H, Nallamothu B, O’Hare AM, Pisoni R, Plattner B, Port FK, Rao P, Rhee CM, Schaubel DE, Selewski DT, Shahinian V, Sim JJ, Song P, Streja E, Kurella Tamura M, Tentori F, Eggers PW, Agodoa LY, Abbott KC: US Renal Data System 2014 Annual Data Report: Epidemiology of kidney disease in the United States. Am J Kidney Dis 66[Suppl 1]: S1–S305, 2015 [DOI] [PMC free article] [PubMed] [Google Scholar]
- 3.Hill NR, Fatoba ST, Oke JL, Hirst JA, O’Callaghan CA, Lasserson DS, Hobbs FD: Global prevalence of chronic kidney disease - a systematic review and meta-analysis. PLoS One 11: e0158765, 2016 [DOI] [PMC free article] [PubMed] [Google Scholar]
- 4.Coresh J, Selvin E, Stevens LA, Manzi J, Kusek JW, Eggers P, Van Lente F, Levey AS: Prevalence of chronic kidney disease in the United States. JAMA 298: 2038–2047, 2007 [DOI] [PubMed] [Google Scholar]
- 5.Boor P, Ostendorf T, Floege J: Renal fibrosis: Novel insights into mechanisms and therapeutic targets. Nat Rev Nephrol 6: 643–656, 2010 [DOI] [PubMed] [Google Scholar]
- 6.Handschin C, Spiegelman BM: Peroxisome proliferator-activated receptor gamma coactivator 1 coactivators, energy homeostasis, and metabolism. Endocr Rev 27: 728–735, 2006 [DOI] [PubMed] [Google Scholar]
- 7.Puigserver P, Wu Z, Park CW, Graves R, Wright M, Spiegelman BM: A cold-inducible coactivator of nuclear receptors linked to adaptive thermogenesis. Cell 92: 829–839, 1998 [DOI] [PubMed] [Google Scholar]
- 8.Murea M, Park JK, Sharma S, Kato H, Gruenwald A, Niranjan T, Si H, Thomas DB, Pullman JM, Melamed ML, Susztak K: Expression of Notch pathway proteins correlates with albuminuria, glomerulosclerosis, and renal function. Kidney Int 78: 514–522, 2010 [DOI] [PMC free article] [PubMed] [Google Scholar]
- 9.Niranjan T, Bielesz B, Gruenwald A, Ponda MP, Kopp JB, Thomas DB, Susztak K: The Notch pathway in podocytes plays a role in the development of glomerular disease. Nat Med 14: 290–298, 2008 [DOI] [PubMed] [Google Scholar]
- 10.Bielesz B, Sirin Y, Si H, Niranjan T, Gruenwald A, Ahn S, Kato H, Pullman J, Gessler M, Haase VH, Susztak K: Epithelial Notch signaling regulates interstitial fibrosis development in the kidneys of mice and humans. J Clin Invest 120: 4040–4054, 2010 [DOI] [PMC free article] [PubMed] [Google Scholar]
- 11.Bonegio R, Susztak K: Notch signaling in diabetic nephropathy. Exp Cell Res 318: 986–992, 2012 [DOI] [PMC free article] [PubMed] [Google Scholar]
- 12.Sirin Y, Susztak K: Notch in the kidney: Development and disease. J Pathol 226: 394–403, 2012 [DOI] [PMC free article] [PubMed] [Google Scholar]
- 13.Lin CL, Wang FS, Hsu YC, Chen CN, Tseng MJ, Saleem MA, Chang PJ, Wang JY: Modulation of notch-1 signaling alleviates vascular endothelial growth factor-mediated diabetic nephropathy. Diabetes 59: 1915–1925, 2010 [DOI] [PMC free article] [PubMed] [Google Scholar]
- 14.Waters AM, Wu MY, Onay T, Scutaru J, Liu J, Lobe CG, Quaggin SE, Piscione TD: Ectopic notch activation in developing podocytes causes glomerulosclerosis. J Am Soc Nephrol 19: 1139–1157, 2008 [DOI] [PMC free article] [PubMed] [Google Scholar]
- 15.Sharma S, Sirin Y, Susztak K: The story of Notch and chronic kidney disease. Curr Opin Nephrol Hypertens 20: 56–61, 2011 [DOI] [PMC free article] [PubMed] [Google Scholar]
- 16.Si H, Banga RS, Kapitsinou P, Ramaiah M, Lawrence J, Kambhampati G, Gruenwald A, Bottinger E, Glicklich D, Tellis V, Greenstein S, Thomas DB, Pullman J, Fazzari M, Susztak K: Human and murine kidneys show gender- and species-specific gene expression differences in response to injury. PLoS One 4: e4802, 2009 [DOI] [PMC free article] [PubMed] [Google Scholar]
- 17.Woroniecka KI, Park AS, Mohtat D, Thomas DB, Pullman JM, Susztak K: Transcriptome analysis of human diabetic kidney disease. Diabetes 60: 2354–2369, 2011 [DOI] [PMC free article] [PubMed] [Google Scholar]
- 18.Han SH, Malaga-Dieguez L, Chinga F, Kang HM, Tao J, Reidy K, Susztak K: Deletion of Lkb1 in renal tubular epithelial cells leads to CKD by altering metabolism. J Am Soc Nephrol 27: 439–453, 2016 [DOI] [PMC free article] [PubMed] [Google Scholar]
- 19.Bi P, Shan T, Liu W, Yue F, Yang X, Liang XR, Wang J, Li J, Carlesso N, Liu X, Kuang S: Inhibition of Notch signaling promotes browning of white adipose tissue and ameliorates obesity. Nat Med 20: 911–918, 2014 [DOI] [PMC free article] [PubMed] [Google Scholar]
- 20.Edeling M, Ragi G, Huang S, Pavenstädt H, Susztak K: Developmental signalling pathways in renal fibrosis: The roles of Notch, Wnt and Hedgehog. Nat Rev Nephrol 12: 426–439, 2016 [DOI] [PMC free article] [PubMed] [Google Scholar]
- 21.Zavadil J, Cermak L, Soto-Nieves N, Böttinger EP: Integration of TGF-beta/Smad and Jagged1/Notch signalling in epithelial-to-mesenchymal transition. EMBO J 23: 1155–1165, 2004 [DOI] [PMC free article] [PubMed] [Google Scholar]
- 22.Xu J, Chi F, Guo T, Punj V, Lee WN, French SW, Tsukamoto H: NOTCH reprograms mitochondrial metabolism for proinflammatory macrophage activation. J Clin Invest 125: 1579–1590, 2015 [DOI] [PMC free article] [PubMed] [Google Scholar]
- 23.Bi P, Kuang S: Notch signaling as a novel regulator of metabolism. Trends Endocrinol Metab 26: 248–255, 2015 [DOI] [PMC free article] [PubMed] [Google Scholar]
- 24.Liang H, Ward WF: PGC-1alpha: A key regulator of energy metabolism. Adv Physiol Educ 30: 145–151, 2006 [DOI] [PubMed] [Google Scholar]
- 25.Rasbach KA, Schnellmann RG: Signaling of mitochondrial biogenesis following oxidant injury. J Biol Chem 282: 2355–2362, 2007 [DOI] [PubMed] [Google Scholar]
- 26.Wu Z, Puigserver P, Andersson U, Zhang C, Adelmant G, Mootha V, Troy A, Cinti S, Lowell B, Scarpulla RC, Spiegelman BM: Mechanisms controlling mitochondrial biogenesis and respiration through the thermogenic coactivator PGC-1. Cell 98: 115–124, 1999 [DOI] [PubMed] [Google Scholar]
- 27.Lehman JJ, Barger PM, Kovacs A, Saffitz JE, Medeiros DM, Kelly DP: Peroxisome proliferator-activated receptor gamma coactivator-1 promotes cardiac mitochondrial biogenesis. J Clin Invest 106: 847–856, 2000 [DOI] [PMC free article] [PubMed] [Google Scholar]
- 28.Rasbach KA, Schnellmann RG: PGC-1alpha over-expression promotes recovery from mitochondrial dysfunction and cell injury. Biochem Biophys Res Commun 355: 734–739, 2007 [DOI] [PubMed] [Google Scholar]
- 29.Portilla D, Dai G, McClure T, Bates L, Kurten R, Megyesi J, Price P, Li S: Alterations of PPARalpha and its coactivator PGC-1 in cisplatin-induced acute renal failure. Kidney Int 62: 1208–1218, 2002 [DOI] [PubMed] [Google Scholar]
- 30.Kang HM, Ahn SH, Choi P, Ko YA, Han SH, Chinga F, Park AS, Tao J, Sharma K, Pullman J, Bottinger EP, Goldberg IJ, Susztak K: Defective fatty acid oxidation in renal tubular epithelial cells has a key role in kidney fibrosis development. Nat Med 21: 37–46, 2015 [DOI] [PMC free article] [PubMed] [Google Scholar]
- 31.Stanger BZ, Datar R, Murtaugh LC, Melton DA: Direct regulation of intestinal fate by Notch. Proc Natl Acad Sci USA 102: 12443–12448, 2005 [DOI] [PMC free article] [PubMed] [Google Scholar]
- 32.Sun G, Reddy MA, Yuan H, Lanting L, Kato M, Natarajan R: Epigenetic histone methylation modulates fibrotic gene expression. J Am Soc Nephrol 21: 2069–2080, 2010 [DOI] [PMC free article] [PubMed] [Google Scholar]
Associated Data
This section collects any data citations, data availability statements, or supplementary materials included in this article.


