

Abstract
Background
Unexpected death of a loved one (UD) is the most commonly reported traumatic experience in cross-national surveys. However, much remains to be learned about PTSD after this experience. The WHO World Mental Health (WMH) Survey Initiative provides a unique opportunity to address these issues.
Methods
Data from 19 WMH surveys (n=78,023; 70.1% weighted response rate) were collated. Potential predictors of PTSD (respondent socio-demographics, characteristics of the death, history of prior trauma exposure, history of prior mental disorders) after a representative sample of UDs were examined using logistic regression. Simulation was used to estimate overall model strength in targeting individuals at highest PTSD risk.
Results
PTSD prevalence after UD averaged 5.2% across surveys and did not differ significantly between high and low-middle income countries. Significant multivariate predictors included: the deceased being a spouse or child; the respondent being female and believing they could have done something to prevent the death; prior trauma exposure; and history of prior mental disorders. The final model was strongly predictive of PTSD, with the 5% of respondents having highest estimated risk including 30.6% of all cases of PTSD. Positive predictive value (i.e., the proportion of high-risk individuals who actually developed PTSD) among the 5% of respondents with highest predicted risk was 25.3%.
Conclusions
The high prevalence and meaningful risk of PTSD make UD a major public health issue. This study provides novel insights into predictors of PTSD after this experience and suggests that screening assessments might be useful in identifying high-risk individuals for preventive interventions.
Keywords: PTSD/Posttraumatic Stress Disorder, epidemiology, life events/stress, trauma, crossnational, international
INTRODUCTION
Unexpected death of a loved one (UD) is the most commonly reported traumatic experience in community epidemiological surveys across the world (Benjet et al., 2016). It is also one of the traumatic experiences associated with the highest number of cases of post-traumatic stress disorder (PTSD) in country-specific community surveys (Atwoli et al., 2013; Breslau et al., 1998; Carmassi et al., 2014; Olaya et al., 2014) and is also associated with significantly elevated risk of first onset of other mental disorders (Keyes et al., 2014). Awareness that PTSD occurs in the wake of unexpected death is relatively recent (Zisook, Chentsova-Dutton, & Shuchter, 1998), though, and raises questions about the prevalence and correlates of PTSD associated with this experience. Few community epidemiological surveys have specifically addressed these questions. The WHO World Mental Health (WMH) Surveys (Kessler & Ustun, 2008) provide a unique opportunity to do so by assessing prevalence and predictors of UD-related PTSD in general population samples across the globe. Here we focus on prevalence and predictors of UD-related DSM-IV PTSD. The predictors considered are those found to be significant in previous studies of more general PTSD (DiGangi et al., 2013; Ferry et al., 2014) as well as those significant in previous studies of bereavement and complicated grief (Kristensen et al., 2012; Lobb et al., 2010), including respondent socio-demographics, characteristics of the death, respondent childhood adversities, history of prior traumatic experiences, and history of prior psychopathology.
Consistent with previous community epidemiological surveys of PTSD, WMH respondents were asked to complete a checklist of lifetime exposures to a wide variety of traumatic experiences (TEs). Given that some people are exposed to a large number of different TEs in their lifetime, it is impossible to assess PTSD separately for each of these occurrences. The standard approach to this problem is to ask each respondent to select the one or two lifetime TE occurrences they consider to be their “worst” (or the ones associated with the most psychological distress) and to assess PTSD after those events (Breslau et al., 1998). But that approach leads to upwardly-biased estimates of conditional PTSD risk after TE exposure (Atwoli, Stein, Koenen, & McLaughlin, 2015). WMH addressed this problem by using probability sampling methods to select one lifetime occurrence of one TE for each respondent as that respondent’s “random TE,” obtaining information about the circumstances around that occurrence that could influence PTSD risk, and then retrospectively assessing symptoms of PTSD after that occurrence. We focus here on the random TEs involving unexpected death of a loved one and their associated UD-related PTSD.
MATERIALS AND METHODS
Samples
The WMH surveys are a coordinated set of community epidemiological surveys of the prevalence and correlates of common mental disorders carried out in nationally or regionally representative household samples in countries throughout the world (Kessler & Ustun, 2008). The data reported here come from the subset of 19 WMH surveys that used an expanded PTSD assessment to determine PTSD prevalence associated with random TEs as defined above. (Table 1) These surveys included 10 in countries classified by the World Bank (World Bank) as high income countries and 9 in countries classified as low or middle income countries. Each survey was based on a probability sample of household residents in the target population using a multi-stage clustered area probability sample design. Total sample size across surveys was 78,023, although we focus here on the 2,813 respondents with UD selected as their random TEs. A more complete description of WMH sampling procedures is available elsewhere (Heeringa et al., 2008).
Table 1.
Prevalence of DSM-IV/CIDI PTSD associated with unexpected death of a loved one (UD) among respondents for whom UD was their randomly selected traumatic event by survey (n=2,813)a
| % PTSDb
|
(95% CI)c
|
Number with PTSDb
|
Total sample sizeb
|
|
|---|---|---|---|---|
| I. High income countries | ||||
| Belgium | 6.8 | (2.2–19.3) | (6) | (74) |
| France | 2.7 | (0.8–4.6) | (14) | (107) |
| Germany | 8.1 | (2.5–23.4) | (7) | (73) |
| Italy | 5.3 | (3.0–7.6) | (12) | (104) |
| Japan | 1.4 | (0.1–2.6) | (8) | (114) |
| Netherlands | 3.8 | (1.3–6.2) | (8) | (82) |
| Northern Ireland | 12.6 | (3.7–21.5) | (27) | (139) |
| Spain | 4.1 | (1.2–7.0) | (18) | (172) |
| Spain - Murcia | 1.7 | (0.5–5.4) | (8) | (202) |
| United States | 4.5 | (1.3–7.7) | (50) | (516) |
| Total | 4.8 | (3.3–6.2) | (158) | (1,583) |
| χ29 | 19.0* | |||
| II. Low or middle income countries | ||||
| Brazil | 7.1 | (2.3–11.9) | (10) | (85) |
| Bulgaria | 13.8 | (4.0–38.0) | (15) | (72) |
| Colombia | 0.7 | (0.1–4.4) | (4) | (121) |
| Colombia - Medellín | 11.7 | (4.0–29.5) | (21) | (162) |
| Lebanon | 4.0 | (1.3–11.6) | (6) | (68) |
| Peru | 1.4 | (0.3–3.1) | (4) | (92) |
| Romania | 3.3 | (0.9–7.8) | (6) | (92) |
| South Africa | 3.3 | (0.2–6.4) | (8) | (374) |
| Ukraine | 10.4 | (3.1–17.7) | (20) | (164) |
| Total | 5.9 | (3.3–8.4) | (94) | (1,230) |
| χ28 | 15.3 | |||
| III. Total | 5.2 | (3.9–6.6) | (252) | (2,813) |
| Overall between country difference χ218 | 35.4* | |||
| High vs low or middle difference χ21 | 0.6 | |||
Significant at the .05 level, two-sided test.
Each respondent who reported lifetime exposure to one or more Traumatic Events (TEs) had one occurrence of one such experience selected at random for detailed assessment. Each of these randomly selected TEs was weighted by the inverse of its probability of selection at the respondent level to create a weighted sample of TEs that was representative of all TEs in the population. The randomly selected “deaths of a loved one” were the subset of these randomly selected TEs involving “death of a loved one”. The sum of weights of the randomly selected “deaths of a loved one” was standardized within surveys to sum to the observed number of respondents whose randomly selected TE was “death of a loved one”. The n reported in the last column of this table represents that number of respondents. The results reported here are for the surveys where at least one respondent with a randomly selected “death of a loved one” met DSM-IV/CIDI criteria for PTSD related to that TE. Two surveys were excluded for the following reasons: Mexico for low frequency of outcome (n=94) and Israel for having no respondents experiencing “death of a loved one” as a TE (n=0).
The reported sample sizes are unweighted. The unweighted proportions of respondents with PTSD do not match the prevalence estimates in the first column because the latter were based on weighted data.
Confidence intervals that include 0.0% as the lower bound were estimated using the Wilson-score method (Reed III, 2007). This method was used for the following countries: Belgium, Germany, Spain - Murcia, Bulgaria, Colombia, Colombia - Medellín, Lebanon, Peru, and Romania.
The Wilson interval method (Reed III, 2007) was used to calculate confidence intervals when the lower bound of 1.96 times the standard error was less than 0.0.
Field procedures
After obtaining informed consent, interviews were administered face-to-face in respondent homes in compliance with the Declaration of Helsinki and with approval from local IRBs. The interview schedule was developed in English and translated into other languages using a standardized WHO protocol (Harkness et al., 2008). Bilingual survey supervisors in participating countries were trained and supervised by centralized WMH field staff and interviewers were monitored using procedures described elsewhere (Pennell et al., 2008) to guarantee cross-national consistency in data quality.
Measures
Traumatic experiences
Respondents were asked about lifetime exposure to each of 27 different types of traumatic experiences (TEs) and 2 open-ended questions about exposure to “any other” TE and to a private TE the respondent did not want to name. Positive responses were probed for number of lifetime occurrences of each TE type and age at exposure to the first occurrence of each TE type. In the case of the random TEs, we also included questions about age of exposure and the context surrounding the TE (see below for UD). As noted above, the random TE for each respondent was selected using a probability sampling scheme from the full list of all lifetime TE types and occurrences reported by the respondent.
Unexpected death of a loved one (UD)
Reports of unexpected deaths were elicited by asking “Did someone very close to you ever die unexpectedly; for example, they were killed in an auto accident, murdered, committed suicide, or had a fatal heart attack at an early age?” In cases where a UD was the random TE, the respondent’s age at the time of the UD was recorded along with responses to five questions about the experience: the respondent’s relationship to the deceased (spouse, parent, child, sibling, other relative, or nonrelative); the cause of death (homicide, suicide, accident/medical error, or illness); length of illness if the death was due to illness; the age of the deceased at the time of death; and the respondent’s perception of whether they could have prevented the death assessed as a yes-no answer to the question: “Looking back on it now, is there any way you could have prevented the death from happening?”
PTSD
DSM-IV mental disorders were assessed with the Composite International Diagnostic Interview (CIDI) (Kessler & Ustun, 2004). As detailed elsewhere (Haro et al., 2006), blinded clinical reappraisal interviews with the Structured Clinical Interview for DSM-IV (SCID) found CIDI-SCID concordance for PTSD to be moderate (AUC=.69) (Landis & Koch, 1977). Sensitivity and specificity were .38 and .99, respectively, resulting in a likelihood ratio positive (LR+) of 42.0, which is well above the threshold of 10 typically used to consider a screening scale diagnosis definitive (Gardner & Altman, 2000). Consistent with the high LR+, the proportion of CIDI cases confirmed by the SCID was 86.1%, suggesting that the vast majority of CIDI/DSM-IV PTSD cases would independently be judged to have DSM-IV PTSD by a trained clinician.
Other mental disorders
The CIDI also assessed 14 prior (to respondent’s age of exposure to the random TE) lifetime DSM-IV mental disorders. These included mood disorders, anxiety disorders, disruptive behavior disorders, and substance disorders. Age-of-onset (AOO) of each disorder was assessed using special probing techniques shown experimentally to improve recall accuracy (Knäuper, Cannell, Schwarz, Bruce, & Kessler, 1999). This allowed us to determine based on retrospective AOO reports whether each respondent had a history of each disorder prior to the age of occurrence of the random TE. DSM-IV organic exclusion rules and diagnostic hierarchy rules were used (other than for oppositional defiant disorder, which was defined with or without conduct disorder, and substance abuse, which was defined with or without dependence). Agoraphobia was combined with panic disorder because of low prevalence. Dysthymic disorder was combined with major depressive disorder for the same reason.
Other PTSD predictors
We examined six classes of predictors. The first two were described above: characteristics of the death and the respondent’s history of prior mental disorders. The third class was socio-demographics: age, education, and marital status (each as of the time of the death), and sex. Age was coded in quartiles. Given the wide variation in education levels across countries, education was classified as low, low-average, high-average, or high (coded as a continuous 1–4 score) according to within-country norms (Scott et al., 2014). The next three classes of predictors assessed the respondent’s history of exposure to stressful experiences prior to the random UD: previous experience of UD; exposure to each of the other 28 lifetime TEs; and exposure to each of 12 childhood family adversities (CAs). Consistent with prior WMH research on CAs (Kessler et al., 2010), we distinguished between CAs in a highly-correlated set of seven that we labeled Maladaptive Family Functioning CAs (parental mental disorder, parental substance abuse, parental criminality, family violence, physical abuse, sexual abuse, neglect) and other CAs (parental divorce, parental death, other parental loss, serious physical illness, family economic adversity).
Analysis Methods
In addition to the sample weight, each respondent reporting a TE was weighted by the inverse of the probability of selection of the random TE occurrence. For example, a respondent who reported three TE types and two occurrences of the randomly-selected type would receive a TE weight of 6.0 for the selected random TE. The product of the sample weight with the TE weight was used in analyses of the random TEs, yielding a sample that is representative of all lifetime TEs occurring to all respondents. The sum of the consolidated weights across respondents with a randomly selected UD was standardized in each survey for purposes of pooled cross-national analysis to equal the observed number of respondents with this TE in the sample.
Prevalence of PTSD associated with randomly selected UDs was estimated using cross-tabulations. Logistic regression was then used to examine predictors of PTSD pooled across surveys. Predictors were entered in blocks, beginning with socio-demographics, followed sequentially by characteristics of the death, prior TE and CA exposure, and prior mental disorders. All models included dummy control variables for surveys, meaning that the reported coefficients represent pooled within-survey coefficients. Logistic regression coefficients and standard errors were exponentiated and are reported as odds-ratios (ORs) with 95% confidence intervals (CIs), with statistical significance evaluated using .05-level two-sided tests.
The design-based Taylor series method (Wolter, 1985) implemented in the SAS software system (SAS Institute Inc., 2008) was used to adjust for the weighting and clustering of observations. Design-based F tests were used to evaluate significance of each block of predictor, with numerator degrees of freedom equal to number of predictors and denominator degrees of freedom equal to number of geographically-clustered sampling error calculation units containing random UDs across surveys (n=1,062) minus the sum of primary sample units from which these sampling error calculation units were selected (n=569) and one less than the number of variables in the predictor set (Reed III, 2007), resulting in 493 denominator degrees of freedom in evaluating bivariate associations and fewer in evaluating multivariate associations.
Once the final model was estimated, a predicted probability of PTSD was generated for each respondent from model coefficients. A receiver operating characteristic (ROC) curve was then calculated from this summary predicted probability (Zou, O’Malley, & Mauri, 2007). Area under the ROC curve (AUC) was calculated to quantify overall prediction accuracy of the model (Hanley & McNeil, 1983). We also evaluated concentration of risk of PTSD among the 5% of respondents with highest predicted risk of PTSD based on the final model, which we defined as the proportion of all observed cases of PTSD that was found among this 5% of respondents. This was done to determine how well subsequent PTSD could have been predicted in the immediate aftermath of the death using our model. We also calculated positive predictive value, the proportion of the 5% of respondents with highest predicted risk that actually developed PTSD.
Given that a number of different predictors were examined, the possibility of false positives and over-fitting was taken into consideration in two ways. First, as noted above, we evaluated simultaneous significance of predictor blocks and interpreted individually significant coefficients only when the overall block was significant. Second, we used the method of replicated 10-fold cross-validation with 20 replicates (i.e., 200 separate estimates of model coefficients) to correct for the over-estimation of overall model prediction accuracy when estimating AUC, concentration of risk, and positive predictive value (Smith, Seaman, Wood, Royston, & White, 2014).
RESULTS
Prevalence of UD and association with PTSD
Prevalence of UD was 30.2% (2,813 respondents) across surveys (Interquartile range, IQR, 24.4–33.0%), with an average 1.6 lifetime occurrences per respondent with any and representing 16.4% of all TEs in the population (IQR 15.3–17.5% across surveys). (Detailed results are available upon request.) PTSD prevalence associated with random UDs averaged 5.2% across surveys and was comparable in high versus low/middle income countries (4.8% versus 5.9%; χ21=0.6, p=.45). (Table 1) However, prevalence differed significantly across all surveys (χ218=35.4, p=.010) and among surveys in high income countries (χ29=19.0, p=.030) but not among surveys in low/middle income countries (χ28=15.3, p=.06).
Predictors of PTSD associated with UD
Respondents who were in the oldest age quartile (35+) at the time they experienced the UD had significantly elevated univariate PTSD odds compared to those in the youngest quartile (ages 1–17) (OR 2.5; 95% CI 1.1–5.9). (Table 2) PTSD was also significantly more common among women than men (OR 3.0; 95% CI 1.5–6.0) and among the currently (at the time of the death) married (OR 2.1; 95% CI 1.3–3.6) and previously married (OR 3.2; 95% CI 1.3–7.7) than the never married in univariate models, but was not significantly associated with respondent education.
Table 2.
Associations of socio-demographics, trauma characteristics, and prior stressors with PTSD after randomly selected unexpected death of a loved one (n=2,813)a
| Univariate model
|
Model 1
|
Model 2
|
Model 3
|
Model 4
|
||||||
|---|---|---|---|---|---|---|---|---|---|---|
| OR | (95% CI) | OR | (95% CI) | OR | (95% CI) | OR | (95% CI) | OR | (95% CI) | |
|
|
|
|
|
|
||||||
| I. Socio-demographics at time of traumatic event | ||||||||||
| Respondent age at TE exposure (vs. 1–17 years) | ||||||||||
| Upper middle-older age (35+) | 2.5* | (1.1–5.9) | 1.7 | (0.5–6.2) | 1.2 | (0.4–3.9) | 1.6 | (0.5–5.3) | 0.9 | (0.2–3.1) |
| Lower middle age (25–34) | 1.4 | (0.5–3.8) | 1.1 | (0.3–3.9) | 1.1 | (0.4–3.3) | 1.2 | (0.4–3.7) | 0.7 | (0.2–2.3) |
| Young adult (18–24) | 0.7 | (0.3–1.9) | 0.7 | (0.2–2.1) | 0.8 | (0.3–2.1) | 0.9 | (0.3–2.5) | 0.6 | (0.2–1.5) |
| F3,491 | 5.1* | p=.002 | 1.5 | p=.21 | 0.4 | p=.76 | 0.5 | p=.70 | 0.6 | p=.60 |
| Female gender (vs. male) | 3.0* | (1.5–6.0) | 2.7* | (1.3–5.6) | 2.1* | (1.0–4.3) | 1.9* | (1.1–3.5) | 2.2* | (1.2–3.9) |
| Education | 1.0 | (0.7–1.3) | 1.0 | (0.7–1.5) | 1.0 | (0.7–1.4) | 1.0 | (0.7–1.3) | 1.0 | (0.8–1.4) |
| Marital history (vs. never married) | ||||||||||
| Currently married | 2.1* | (1.3–3.6) | 1.4 | (0.6–3.1) | 1.1 | (0.5–2.4) | 1.1 | (0.5–2.5) | 1.5 | (0.6–3.9) |
| Previously married | 3.2* | (1.3–7.7) | 1.7 | (0.5–5.4) | 2.2 | (0.6–7.5) | 1.7 | (0.5–5.2) | 0.8 | (0.5–6.2) |
| F2,492 | 5.3* | p=.005 | 0.4 | p=.65 | 0.9 | p=.39 | 0.5 | p=.59 | 0.5 | p=.63 |
| II. Trauma characteristics | ||||||||||
| Who died (vs. other relative or non-family member) | ||||||||||
| Spouse | 12.3* | (5.6–27.0) | – | – | 9.6* | (4.1–22.3) | 10.3* | (4.5–23.6) | 13.0* | (5.3–31.9) |
| Son or daughter | 12.1* | (5.8–25.3) | – | – | 8.7* | (4.2–18.0) | 11.7* | (1.4–6.7) | 15.1* | (7.2–31.5) |
| Some other child (0–12 years old) | 5.9* | (1.5–22.2) | – | – | 4.2* | (1.7–10.2) | 3.1* | (1.4–6.7) | 2.0* | (1.1–3.9) |
| Parent | 2.3* | (1.2–4.3) | – | – | 2.2* | (1.1–4.4) | 2.5* | (1.3–4.9) | 3.3* | (1.7–6.6) |
| F4,490 | 15.7* | p<.001 | – | – | 12.6* | p<.001 | 17.1* | p<.001 | 15.4* | p<.001 |
| Cause of death (vs. illness or other) | ||||||||||
| Homicide | 0.7 | (0.2–2.6) | – | – | 1.3 | (0.5–3.5) | 1.7 | (0.6–4.5) | 2.1 | (0.8–5.4) |
| Suicide | 0.4 | (0.1–1.3) | – | – | 0.5 | (0.2–1.4) | 0.5 | (0.2–1.4) | 0.4 | (0.1–1.5) |
| Accident, natural disaster, or medical mishap | 0.7 | (0.4–1.3) | – | – | 1.0 | (0.6–1.8) | 1.1 | (0.6–2.0) | 1.4 | (0.7–2.5) |
| F3,491 | 0.9 | p=.46 | – | – | 0.8 | p=.49 | 1.0 | p=.37 | 1.9 | p=.14 |
| III. Perceived preventability | ||||||||||
| R could have prevented death | 3.4* | (1.2–10.2) | – | – | 2.8* | (1.2–6.6) | 1.9 | (0.7–4.9) | 1.5 | (0.5–4.0) |
| IV. Prior vulnerability factors | ||||||||||
| Prior stresses | ||||||||||
| Prior exposure to any traumatic event (0–3)b | 2.5* | (1.4–4.5) | – | – | – | – | 2.6* | (1.2–5.9) | 1.7 | (1.0–3.1) |
| Maladaptive Family Functioning CAs (0–2)c | 3.5* | (2.2–5.6) | – | – | – | – | 2.8* | (1.7–4.8) | 2.2* | (1.3–3.8) |
| Prior mental disorders (0–8)d | 1.8* | (1.5–2.2) | – | – | – | – | – | – | 1.8* | (1.5–2.3) |
| F(7,487), (15,479), (17,477), (18,476)e | 5.6* | p<.001 | 7.6* | p<.001 | 11.4* | p<.001 | 11.1* | p<.001 | ||
Significant at the .05 level, two-sided test.
Models were based on weighted data. See the text for details. Each model included dummy variable controls for WMH survey.
Number of prior traumatic events (values=0–3+) was calculated as the sum of 4 individual prior TEs (beaten by caregiver, beaten by someone else, witnessed physical fight at home, and man-made disaster) from Appendix Table 4.
Number of Maladaptive Family Functioning Childhood Adversities (MFF CAs) (values=0–2+) was calculated as the sum of 3 significant individual MFF CA’s (parental mental, parental substance misuse, and sexual abuse) from Appendix Table 5.
Number of mental disorders was calculated as the weighted sum of ADHD, drug abuse/dependence, and alcohol abuse/dependence from Appendix Table 6.
Design-based F tests were used to evaluate significance of predictor sets, with numerator degrees of freedom equal to number of predictors and denominator degrees of freedom equal to number of geographically-clustered sampling error calculation units containing randomly selected deaths of a loved one across surveys (n=1,062) minus the sum of primary sample units from which these sampling error calculation units were selected (n=569) and one less than the number of variables in the predictor set (Reed III, 2007), resulting in 493 denominator degrees of freedom in evaluating bivariate associations and fewer in evaluating multivariate associations.
Model 1
However, sex was the only socio-demographic that remained significant in a multivariate model that included all the socio-demographics (Table 2, Model 1). We subsequently elaborated that model to include a methodological control for number of years between respondent age at the time of unexpected death and age at interview to investigate the possibility of time-related recall bias, but that association was non-significant (OR 1.1; 95% CI 0.9–1.3).
Model 2
The respondent’s relationship to the deceased was a significant predictor of PTSD (F4,490=12.6, p<.001) in the model that added characteristics of the death to the socio-demographic predictors (Table 2, Model 2), with highest odds of PTSD associated with death of the respondent’s spouse (OR 9.6; 95% CI 4.1–22.3) or son or daughter (OR 8.7; 95% CI 4.2–18.0) followed by death of any other child (OR 4.2; 95% CI 1.7–10.2) and of the respondent’s parent (OR 2.2; 95% CI 1.1–4.4) compared to others. Cause of death was not a significant predictor (F3,491=0.8, p=.49). The respondent’s perception that he/she could have done something to prevent the death was also a significant predictor (OR 2.8; 95% CI 1.2–6.6).
Model 3
Preliminary analysis found that prior lifetime exposure to TEs predicted PTSD significantly, but that this association was mainly due to TEs involving interpersonal violence or man-made disasters (detailed results are available on request), which were found to be significantly inter-correlated in an exploratory factor analysis reported elsewhere (Benjet et al., 2016). Multivariate analysis showed that those reporting these TEs had significantly increased odds of PTSD after the UD (OR 2.6; 95% CI 1.2–5.9 per TE in the range 0–3). (Table 2, Model 3) Preliminary analysis also showed that Maladaptive Family Functioning CAs predicted PTSD related to unexpected death (detailed results are available on request), while further analysis showed that these gross associations were due to three particular CAs –parental mental illness, parental alcohol abuse, sexual abuse (OR 2.8; 95% CI 1.7–4.8 per TE in the range 0–2). The respondent’s perception that he/she could have done something to prevent the death was non-significant in Model 3.
Model 4
Preliminary analysis showed that each of the 14 temporally primary lifetime DSM-IV/CIDI disorders assessed in the surveys had an elevated OR (10 of them significant at the .05 level) when considered one at a time, but that few remained significant in a multivariate model due to high comorbidity among the disorders. Further analysis (Table 2, Model 4) then showed that the most parsimonious characterization of these joint associations was provided by a composite variable that summed the number of anxiety disorders (0–3+), ADHD, and number of substance disorders (0–2) (OR 1.8; 95% CI 1.5–2.3 per disorder in the range 0–8).
Strength and consistency of overall model predictions
Estimated AUC based on 20 replicates of 10-fold cross-validated predictions (as described in the Methods) was .80 in the total sample and .74–.86 in subsamples defined by respondent sex, age, and education. (Figure 1) The 5% of respondents with highest predicted risk included 30.6% of all cases of UD-related PTSD. This is six times the proportion expected by chance. (Table 3) Subgroup values of this concentration of risk ranged from 36.8% among those with high/high-average education to 14.7% among men. Positive predictive value among the 5% of respondents with highest predicted risk was 25.3% in the total sample and ranged from 36.6% among respondents from low or middle income countries to 18.2% among respondents from high income countries.
Figure 1. AUC of PTSD model, total sample and by selected sub-groups, “Unexpected death of a loved one”, weighted analysis.
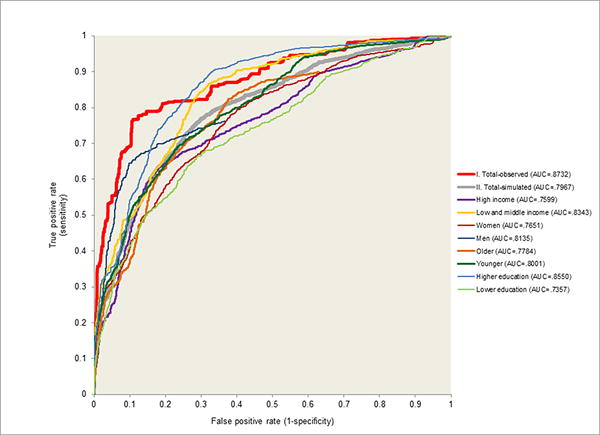
Note. “Older (top half of age range)” = 30+ years old; “Younger (bottom half of age range)” < 30 years old. “Higher education” = high and high-average; “Lower education” = low and low-average.
Table 3.
Concentration of risk and positive predictive value of observed PTSD among the 5% of respondents assessed for PTSD after randomly selected unexpected death of a loved one with highest predicted risk of PTSD in the total sample and stratified by subgroups
| Simulated samplea (n = 56,260)
|
Observed sampleb (n = 2,813)
|
|||||||
|---|---|---|---|---|---|---|---|---|
| Concentration of risk
|
Positive Predictive Value
|
Concentration of risk
|
Positive Predictive Value
|
|||||
| % PTSD | (SE) | % PTSD | (SE) | % PTSD | (SE) | % PTSD | (SE) | |
|
|
|
|
|
|||||
| I. Total | 30.6 | (6.2) | 25.3 | (5.3) | 53.7 | (6.5) | 37.2 | (5.9) |
| II. Country income | ||||||||
| High | 26.7 | (4.3) | 18.2 | (3.2) | 50.5 | (7.8) | 37.7 | (7.6) |
| Low or middle | 34.6 | (11.4) | 36.6 | (11.1) | 57.0 | (10.3) | 36.8 | (8.9) |
| III. Age | ||||||||
| 30+ years old | 35.7 | (6.5) | 22.0 | (3.2) | 61.1 | (8.2) | 35.5 | (6.1) |
| < 30 years old | 25.0 | (12.0) | 32.8 | (14.8) | 45.6 | (10.6) | 40.0 | (10.7) |
| IV. Gender | ||||||||
| Male | 14.7 | (4.0) | 22.6 | (9.7) | 48.2 | (15.0) | 42.5 | (15.2) |
| Female | 35.2 | (7.6) | 25.6 | (5.8) | 55.3 | (7.2) | 36.1 | (6.1) |
| V. Education | ||||||||
| Low or low-average | 24.6 | (5.4) | 22.9 | (5.6) | 45.0 | (9.2) | 27.5 | (7.1) |
| High or high-average | 36.8 | (10.7) | 27.2 | (8.3) | 62.7 | (8.3) | 50.5 | (8.6) |
Estimates calculated from 20 replicates of 10-fold cross-validation of the final model.
Estimates calculated from the final model.
DISCUSSION
The study has a number of limitations. First, although prospective evidence suggests that retrospective reports of TEs are valid (Dohrenwend et al., 2006), respondents with PTSD may have been biased towards higher recall of prior lifetime TE exposures or mental disorders (Roemer, Litz, Orsillo, Ehlich, & Friedman, 1998; Zoellner, Foa, Brigidi, & Przeworski, 2000). Second, PTSD might have led to respondent perceptions that they could have done something to prevent the death, inducing the significant positive association between that “predictor” and PTSD. Third, diagnoses were based on a fully structured lay-administered interview rather than a semi-structured clinical interview. While the WMH clinical appraisal data are reassuring (Haro et al., 2006), only a small number of countries carried out clinical reappraisal studies, potentially limiting generalizability. Fourth, although the combined sample size of the WMH surveys is large, the number of respondents selected for in-depth UD assessment was relatively small, reducing statistical power to carry out subtle analyses. In particular, with only 252 respondents meeting criteria for PTSD and 20 predictors, the resulting 12.6 events-per-variable (EPV) ratio, well above the 10.0 EPV recommended to avoid biased OR estimates in an additive model (Peduzzi, Concato, Kemper, Holford, & Feinstein, 1996), did not allow us to consider interactions of trauma characteristics with pre-existing vulnerabilities or other interactions. Fifth, the WMH interview schedule was developed before DSM-5 criteria for persistent complex bereavement disorder (PCBD; American Psychiatric Association, 2013) were codified. As a result, no information was obtained in the surveys on PCBD or other complicated grief syndromes (Cozza et al., 2016), making it impossible for us to evaluate the extent to which our results would be changed if they were adjusted for comorbidity or confounding of our PTSD diagnoses with these syndromes (Maercker & Znoj, 2010).
Despite these limitations, the present study makes several significant contributions to knowledge on the sequelae of UD. First, no previous cross-national study has reported on the prevalence of PTSD after UD. We found this to average 5.2%, which is somewhat higher than the 4.0% mean prevalence for any randomly selected TE across the WMH surveys (Kessler et al., 2014), although the prevalence of UD-related PTSD varied widely across surveys. It is unclear why this variation exists, but the higher mean prevalence than for other TEs emphasizes the public health importance of UD-related PTSD (Atwoli et al., 2013; Breslau et al., 1998; Carmassi et al., 2014; Ferry et al., 2014; Kawakami, Tsuchiya, Umeda, Koenen, & Kessler, 2014; Keyes et al., 2014; Olaya et al., 2014).
Second, we found a number of significant predictors of UD-related PTSD. While the literature on predictors of UD-related PTSD is sparse, our results are consistent with evidence about the predictors of PTSD after other types of TEs (Brewin, Andrews, & Valentine, 2000; DiGangi et al., 2013; Ferry et al., 2014; Ozer, Best, Lipsey, & Weiss, 2003), and the findings about relationship with the deceased, earlier lifetime traumatic events, and history of mental disorders are consistent with prior studies of complicated grief, including work on bereavement symptoms after loss of a spouse or child (Kristensen et al., 2012; Lobb et al., 2010). Overlap of predictors of UD-related PTSD with the predictors found in studies of complicated grief highlights important commonalities, supports inclusion in the same chapter of the psychiatric nosology (Maercker & Znoj, 2010), but again raises concerns about our lack of knowledge about how our results would have changed if data had been available in the WMH surveys to distinguish UD-related PTSD from PCBD.
Third, the lack of association between cause of death and PTSD is relevant to a key debate about the DSM-5 diagnostic criteria for PTSD. While DSM-IV (American Psychiatric Association, 2000) permitted unexpected death to qualify as a potentially traumatic event for PTSD, DSM-5 (American Psychiatric Association, 2013) developed a more stringent threshold for criterion A1, requiring that in cases of actual or threatened death of a family member or friend, the event(s) must have been directly witnessed, violent, or accidental. The WMH interview did not enquire about the respondent witnessing the death, making it impossible for us to know if the UD qualified as a DSM-5 TE. However, PTSD symptoms can occur after non-violent/non-witnessed death (Zisook et al., 1998) and this narrowing of the definition of qualifying death in DSM-5 has been questioned (Friedman, 2013; Keyes et al., 2014; Larsen & Pacella, 2016). It is relevant to this debate that our analysis found that specific manner of death of a loved one has little impact on the risk of subsequent DSM-IV PTSD. This is true, furthermore, even though some of the deaths reported were not “unexpected” in the sense that they were reportedly due to physical illnesses of some duration, although the exact time of death might have been unexpected (e.g., a relative known to have only a relatively short time to live but seemingly in stable condition suddenly dropping dead at a holiday dinner).
Perhaps the most striking result in our study was that 30.6% of people who experienced UD-related PTSD were among the 5% of respondents with highest predicted risk scores in our cross-validated model. This result is broadly consistent with other recent studies showing that PTSD can be predicted with good accuracy using predictor data collected in the immediate aftermath of trauma (Galatzer-Levy, Karstoft, Statnikov, & Shalev, 2014; Karstoft et al., 2015; Kessler et al., 2014). It is noteworthy that the high concentration of risk of PTSD we found was based on a replicated cross-validated simulation designed to adjust for over-fitting. Our results provide strong suggestive evidence that useful models could be developed in future prospective studies to target prevention and treatment of UD-related PTSD (Endo, Yonemoto, & Yamada, 2015; Maercker & Znoj, 2010; Simon, 2013).
CONCLUSION
Unexpected death of a loved one is a highly prevalent TE associated with a somewhat higher prevalence of PTSD than other TEs. Predictors of UD-related PTSD appear to be consistent with other PTSD. Preliminary evidence suggests that UD-related PTSD could be predicted with good accuracy from data available shortly after the death, although this evidence is based on retrospective data and needs to be confirmed prospectively. These findings emphasize that UD is a major public health issue and suggest that screening assessments might be useful in identifying high-risk individuals for early interventions.
Supplementary Material
Acknowledgments
The World Health Organization World Mental Health Survey collaborators are Tomasz Adamowski, PhD, MD, Sergio Aguilar-Gaxiola, MD, PhD, Ali Al-Hamzawi, MD, Mohammad Al-Kaisy, MD, Abdullah Al Subaie, MBBS, FRCP, Jordi Alonso, MD, PhD, Yasmin Altwaijri, MS, PhD, Laura Helena Andrade, MD, PhD, Lukoye Atwoli, MD, PhD, Randy P. Auerbach, PhD, William G. Axinn, PhD, Corina Benjet, PhD, Guilherme Borges, ScD, Robert M. Bossarte, PhD, Evelyn J. Bromet, PhD, Ronny Bruffaerts, PhD, Brendan Bunting, PhD, Ernesto Caffo, MD, Jose Miguel Caldas de Almeida, MD, PhD, Graca Cardoso, MD, PhD, Alfredo H. Cia, MD, Stephanie Chardoul, Somnath Chatterji, MD, Alexandre Chiavegatto Filho, PhD, Pim Cuijpers, PhD, Louisa Degenhardt, PhD, Giovanni de Girolamo, MD, Ron de Graaf, MS, PhD, Peter de Jonge, PhD, Koen Demyttenaere, MD, PhD, David D. Ebert, PhD, Sara Evans-Lacko, PhD, John Fayyad, MD, Fabian Fiestas, MD, PhD, Silvia Florescu, MD, PhD, Barbara Forresi, PhD, Sandro Galea, DrPH, MD, MPH, Laura Germine, PhD, Stephen E. Gilman, ScD, Dirgha J. Ghimire, PhD, Meyer D. Glantz, PhD, Oye Gureje, PhD, DSc, FRCPsych, Josep Maria Haro, MD, MPH, PhD, Yanling He, MD, Hristo Hinkov, MD, Chi-yi Hu, PhD, MD, Yueqin Huang, MD, MPH, PhD, Aimee Nasser Karam, PhD, Elie G. Karam, MD, Norito Kawakami, MD, DMSc, Ronald C. Kessler, PhD, Andrzej Kiejna, MD, PhD, Karestan C. Koenen, PhD, Viviane Kovess-Masfety, MSc, MD, PhD, Carmen Lara, MD, PhD, Sing Lee, PhD, Jean-Pierre Lepine, MD, Itzhak Levav, MD, Daphna Levinson, PhD, Zhaorui Liu, MD, MPH, Silvia S. Martins, MD, PhD, Herbert Matschinger, PhD, John J. McGrath, PhD, Katie A. McLaughlin, PhD, Maria Elena Medina-Mora, PhD, Zeina Mneimneh, PhD, MPH, Jacek Moskalewicz, DrPH, Samuel D. Murphy, DrPH, Fernando Navarro-Mateu, MD, PhD, Matthew K. Nock, PhD, Siobhan O’Neill, PhD, Mark Oakley-Browne, MB, ChB, PhD, J. Hans Ormel, PhD, Beth-Ellen Pennell, MA, Marina Piazza, MPH, ScD, Stephanie Pinder-Amaker, PhD, Patryk Piotrowski, MD, PhD, Jose Posada-Villa, MD, Ayelet M. Ruscio, PhD, Kate M. Scott, PhD, Vicki Shahly, PhD, Tim Slade, PhD, Jordan W. Smoller, ScD, MD, Juan Carlos Stagnaro, MD, PhD, Dan J. Stein, MBA, MSc, PhD, Amy E. Street, PhD, Hisateru Tachimori, PhD, Nezar Taib, MS, Margreet ten Have, PhD, Graham Thornicroft, PhD, Yolanda Torres, MPH, Maria Carmen Viana, MD, PhD, Gemma Vilagut, MS, Elisabeth Wells, PhD, Harvey Whiteford, PhD, David R. Williams, MPH, PhD, Michelle A. Williams, ScD, Bogdan Wojtyniak, ScD, Alan M. Zaslavsky, PhD.
The World Health Organization World Mental Health (WMH) Survey Initiative is supported by the National Institute of Mental Health (NIMH; R01 MH070884 and R01 MH093612-01), the John D. and Catherine T. MacArthur Foundation, the Pfizer Foundation, the US Public Health Service (R13-MH066849, R01-MH069864, and R01 DA016558), the Fogarty International Center (FIRCA R03-TW006481), the Pan American Health Organization, Eli Lilly and Company, Ortho-McNeil Pharmaceutical, Inc., GlaxoSmithKline, and Bristol-Myers Squibb. We thank the staff of the WMH Data Collection and Data Analysis Coordination Centres for assistance with instrumentation, fieldwork, and consultation on data analysis.
The São Paulo Megacity Mental Health Survey is supported by the State of São Paulo Research Foundation (FAPESP) Thematic Project Grant 03/00204-3. The Bulgarian Epidemiological Study of common mental disorders EPIBUL is supported by the Ministry of Health and the National Center for Public Health Protection. The Colombian National Study of Mental Health (NSMH) is supported by the Ministry of Social Protection. The Mental Health Study Medellín – Colombia was carried out and supported jointly by the Center for Excellence on Research in Mental Health (CES University) and the Secretary of Health of Medellín. The ESEMeD project is funded by the European Commission (Contracts QLG5-1999-01042; SANCO 2004123, and EAHC 20081308), (the Piedmont Region (Italy)), Fondo de Investigación Sanitaria, Instituto de Salud Carlos III, Spain (FIS 00/0028), Ministerio de Ciencia y Tecnología, Spain (SAF 2000-158-CE), Departament de Salut, Generalitat de Catalunya, Spain, Instituto de Salud Carlos III (CIBER CB06/02/0046, RETICS RD06/0011 REM-TAP), and other local agencies and by an unrestricted educational grant from GlaxoSmithKline. The World Mental Health Japan (WMHJ) Survey is supported by the Grant for Research on Psychiatric and Neurological Diseases and Mental Health (H13-SHOGAI-023, H14-TOKUBETSU-026, H16-KOKORO-013) from the Japan Ministry of Health, Labour and Welfare. The Lebanese Evaluation of the Burden of Ailments and Needs Of the Nation (L.E.B.A.N.O.N.) is supported by the Lebanese Ministry of Public Health, the WHO (Lebanon), National Institute of Health/Fogarty International Center (R03 TW006481-01), anonymous private donations to IDRAAC, Lebanon, and unrestricted grants from, Algorithm, AstraZeneca, Benta, Bella Pharma, Eli Lilly, Glaxo Smith Kline, Lundbeck, Novartis, Servier, Phenicia, UPO. The Northern Ireland Study of Mental Health was funded by the Health & Social Care Research & Development Division of the Public Health Agency. The Peruvian World Mental Health Study was funded by the National Institute of Health of the Ministry of Health of Peru. The Romania WMH study projects “Policies in Mental Health Area” and “National Study regarding Mental Health and Services Use” were carried out by National School of Public Health & Health Services Management (former National Institute for Research & Development in Health), with technical support of Metro Media Transilvania, the National Institute of Statistics-National Centre for Training in Statistics, SC. Cheyenne Services SRL, Statistics Netherlands and were funded by Ministry of Public Health (former Ministry of Health) with supplemental support of Eli Lilly Romania SRL. The South Africa Stress and Health Study (SASH) is supported by the US National Institute of Mental Health (R01-MH059575) and National Institute of Drug Abuse with supplemental funding from the South African Department of Health and the University of Michigan. Dr. Stein is supported by the Medical Research Council of South Africa (MRC). The Psychiatric Enquiry to General Population in Southeast Spain – Murcia (PEGASUS-Murcia) Project has been financed by the Regional Health Authorities of Murcia (Servicio Murciano de Salud and Consejería de Sanidad y Política Social) and Fundación para la Formación e Investigación Sanitarias (FFIS) of Murcia. The Ukraine Comorbid Mental Disorders during Periods of Social Disruption (CMDPSD) study is funded by the US National Institute of Mental Health (RO1-MH61905). The US National Comorbidity Survey Replication (NCS-R) is supported by the National Institute of Mental Health (NIMH; U01-MH60220) with supplemental support from the National Institute of Drug Abuse (NIDA), the Substance Abuse and Mental Health Services Administration (SAMHSA), the Robert Wood Johnson Foundation (RWJF; Grant 044708), and the John W. Alden Trust.
None of the funders had any role in the design, analysis, interpretation of results, or preparation of this paper. The views and opinions expressed in this report are those of the authors and should not be construed to represent the views of the sponsoring organizations, agencies, or governments.
A complete list of all within-country and cross-national WMH publications can be found at http://www.hcp.med.harvard.edu/wmh/.
Footnotes
Conflict of interest disclosures: Dr. Stein has received research grants and/or consultancy honoraria from Abbott, AstraZeneca, Eli-Lilly, GlaxoSmithKline, Jazz Pharmaceuticals, Johnson & Johnson, Lundbeck, Orion, Pfizer, Pharmacia, Roche, Servier, Solvay, Sumitomo, Sun, Takeda, Tikvah, and Wyeth. Dr. Demyttenaere has served as a consultant with Servier, Lundbeck, Lundbeck Institute, AstraZeneca and Naurex. In the past three years, Dr. Kessler received support for his epidemiological studies from Sanofi Aventis, was a consultant for Johnson & Johnson Wellness and Prevention, and served on an advisory board for the Johnson & Johnson Services Inc. Lake Nona Life Project. Dr. Kessler is a co-owner of DataStat, Inc., a market research firm that carries out healthcare research. The other authors report no biomedical financial interests or potential conflicts of interest relevant to this manuscript.
References
- American Psychiatric Association. Diagnostic and Statistical Manual of Mental Disorders, Fourth Edition, Text Revised. Washington, DC: American Psychiatric Press; 2000. [Google Scholar]
- American Psychiatric Association. Diagnostic and Statistical Manual of Mental Disorders, Fifth Edition DSM-5. Arlington, VA: American Psychiatric Association; 2013. [Google Scholar]
- Atwoli L, Stein DJ, Koenen KC, McLaughlin KA. Epidemiology of posttraumatic stress disorder: prevalence, correlates and consequences. Curr Opin Psychiatry. 2015;28:307–311. doi: 10.1097/yco.0000000000000167. [DOI] [PMC free article] [PubMed] [Google Scholar]
- Atwoli L, Stein DJ, Williams DR, McLaughlin KA, Petukhova M, Kessler RC, Koenen KC. Trauma and posttraumatic stress disorder in South Africa: analysis from the South African Stress and Health Study. BMC Psychiatry. 2013;13:182. doi: 10.1186/1471-244x-13-182. [DOI] [PMC free article] [PubMed] [Google Scholar]
- Benjet C, Bromet E, Karam EG, Kessler RC, McLaughlin KA, Ruscio AM, Koenen KC. The epidemiology of traumatic event exposure worldwide: results from the World Mental Health Survey Consortium. Psychol Med. 2016;46:327–343. doi: 10.1017/s0033291715001981. [DOI] [PMC free article] [PubMed] [Google Scholar]
- Breslau N, Kessler RC, Chilcoat HD, Schultz LR, Davis GC, Andreski P. Trauma and posttraumatic stress disorder in the community: the 1996 Detroit Area Survey of Trauma. Arch Gen Psychiatry. 1998;55:626–632. doi: 10.1001/archpsyc.55.7.626. [DOI] [PubMed] [Google Scholar]
- Brewin CR, Andrews B, Valentine JD. Meta-analysis of risk factors for posttraumatic stress disorder in trauma-exposed adults. J Consult Clin Psychol. 2000;68:748–766. doi: 10.1037//0022-006x.68.5.748. [DOI] [PubMed] [Google Scholar]
- Carmassi C, Dell’Osso L, Manni C, Candini V, Dagani J, Iozzino L, de Girolamo G. Frequency of trauma exposure and Post-Traumatic Stress Disorder in Italy: analysis from the World Mental Health Survey Initiative. J Psychiatr Res. 2014;59:77–84. doi: 10.1016/j.jpsychires.2014.09.006. [DOI] [PMC free article] [PubMed] [Google Scholar]
- Cozza SJ, Fisher JE, Mauro C, Zhou J, Ortiz CD, Skritskaya N, Shear MK. Performance of DSM-5 Persistent Complex Bereavement Disorder Criteria in a Community Sample of Bereaved Military Family Members. Am J Psychiatry. 2016 doi: 10.1176/appi.ajp.2016.15111442. appiajp201615111442. [DOI] [PubMed] [Google Scholar]
- DiGangi JA, Gomez D, Mendoza L, Jason LA, Keys CB, Koenen KC. Pretrauma risk factors for posttraumatic stress disorder: a systematic review of the literature. Clin Psychol Rev. 2013;33:728–744. doi: 10.1016/j.cpr.2013.05.002. [DOI] [PubMed] [Google Scholar]
- Dohrenwend BP, Turner JB, Turse NA, Adams BG, Koenen KC, Marshall R. The psychological risks of Vietnam for U.S. veterans: a revisit with new data and methods. Science. 2006;313:979–982. doi: 10.1126/science.1128944. [DOI] [PMC free article] [PubMed] [Google Scholar]
- Endo K, Yonemoto N, Yamada M. Interventions for bereaved parents following a child’s death: A systematic review. Palliat Med. 2015;29:590–604. doi: 10.1177/0269216315576674. [DOI] [PubMed] [Google Scholar]
- Ferry F, Bunting B, Murphy S, O’Neill S, Stein D, Koenen K. Traumatic events and their relative PTSD burden in Northern Ireland: a consideration of the impact of the ‘Troubles’. Soc Psychiatry Psychiatr Epidemiol. 2014;49:435–446. doi: 10.1007/s00127-013-0757-0. [DOI] [PubMed] [Google Scholar]
- Friedman MJ. Finalizing PTSD in DSM-5: getting here from there and where to go next. J Trauma Stress. 2013;26:548–556. doi: 10.1002/jts.21840. [DOI] [PubMed] [Google Scholar]
- Galatzer-Levy IR, Karstoft KI, Statnikov A, Shalev AY. Quantitative forecasting of PTSD from early trauma responses: a Machine Learning application. J Psychiatr Res. 2014;59:68–76. doi: 10.1016/j.jpsychires.2014.08.017. [DOI] [PMC free article] [PubMed] [Google Scholar]
- Gardner M, Altman DS. Statistics with Confidence: Confidence Intervals and Statistical Guidelines. London: BMJ Books; 2000. [Google Scholar]
- Hanley JA, McNeil BJ. A method of comparing the areas under receiver operating characteristic curves derived from the same cases. Radiology. 1983;148:839–843. doi: 10.1148/radiology.148.3.6878708. [DOI] [PubMed] [Google Scholar]
- Harkness J, Pennell BP, Villar A, Gebler N, Aguilar-Gaxiola S, Bilgen I. Translation procedures and translation assessment in the World Mental Health Survey Initiative. In: Kessler RC, Üstün TB, editors. The WHO World Mental Health Surveys: Global Perspectives on the Epidemiology of Mental Disorders. New York, NY: Cambridge University Press; 2008. pp. 91–113. [Google Scholar]
- Haro JM, Arbabzadeh-Bouchez S, Brugha TS, de Girolamo G, Guyer ME, Jin R, Kessler RC. Concordance of the Composite International Diagnostic Interview Version 3.0 (CIDI 3.0) with standardized clinical assessments in the WHO World Mental Health surveys. Int J Methods Psychiatr Res. 2006;15:167–180. doi: 10.1002/mpr.196. [DOI] [PMC free article] [PubMed] [Google Scholar]
- Heeringa SG, Hubbard F, Mneimneh ZN, Chiu WT, Sampson NA, Berglund PA. Sample designs and sampling procedures. In: Kessler RC, Üstün TB, editors. The WHO World Mental Health Surveys: Global Perspectives on the Epidemiology of Mental Disorders. New York, NY: Cambridge University Press; 2008. pp. 14–32. [Google Scholar]
- Karstoft KI, Galatzer-Levy IR, Statnikov A, Li Z, Shalev AY, members of Jerusalem Trauma, O., & Prevention Study, g. Bridging a translational gap: using machine learning to improve the prediction of PTSD. BMC Psychiatry. 2015;15:30. doi: 10.1186/s12888-015-0399-8. [DOI] [PMC free article] [PubMed] [Google Scholar]
- Kawakami N, Tsuchiya M, Umeda M, Koenen KC, Kessler RC. Trauma and posttraumatic stress disorder in Japan: Results from the World Mental Health Japan Survey. J Psychiatr Res. doi: 10.1016/jpsychires.2014.01.015. (Epub 06 February 2014) http://dx.doi.org/10.1016/jpsychires.2014.01.015. [DOI] [PMC free article] [PubMed]
- Kessler RC, McLaughlin KA, Green JG, Gruber MJ, Sampson NA, Zaslavsky AM, Williams DR. Childhood adversities and adult psychopathology in the WHO World Mental Health Surveys. Br J Psychiatry. 2010;197:378–385. doi: 10.1192/bjp.bp.110.080499. [DOI] [PMC free article] [PubMed] [Google Scholar]
- Kessler RC, Rose S, Koenen KC, Karam EG, Stang PE, Stein DJ, Carmen Viana M. How well can post-traumatic stress disorder be predicted from pre-trauma risk factors? An exploratory study in the WHO World Mental Health Surveys. World Psychiatry. 2014;13:265–274. doi: 10.1002/wps.20150. [DOI] [PMC free article] [PubMed] [Google Scholar]
- Kessler RC, Ustun TB, editors. The WHO World Mental Health Surveys: Global Perspectives on the Epidemiology of Mental Disorders. New York, NY: Cambridge University Press; 2008. [Google Scholar]
- Kessler RC, Ustun TB. The World Mental Health (WMH) Survey Initiative Version of the World Health Organization (WHO) Composite International Diagnostic Interview (CIDI) Int J Methods Psychiatr Res. 2004;13:93–121. doi: 10.1002/mpr.168. [DOI] [PMC free article] [PubMed] [Google Scholar]
- Keyes KM, Pratt C, Galea S, McLaughlin KA, Koenen KC, Shear MK. The burden of loss: unexpected death of a loved one and psychiatric disorders across the life course in a national study. Am J Psychiatry. 2014;171:864–871. doi: 10.1176/appi.ajp.2014.13081132. [DOI] [PMC free article] [PubMed] [Google Scholar]
- Knäuper B, Cannell CF, Schwarz N, Bruce ML, Kessler RC. Improving accuracy of major depression age-of-onset reports in the US National Comorbidity Survey. Int J Methods Psychiatr Res. 1999;8:39–48. [Google Scholar]
- Kristensen P, Weisaeth L, Heir T. Bereavement and mental health after sudden and violent losses: a review. Psychiatry. 2012;75:76–97. doi: 10.1521/psyc.2012.75.1.76. [DOI] [PubMed] [Google Scholar]
- Landis JR, Koch GG. The measurement of observer agreement for categorical data. Biometrics. 1977;33:159–174. [PubMed] [Google Scholar]
- Larsen SE, Pacella ML. Comparing the effect of DSM-congruent traumas vs. DSM-incongruent stressors on PTSD symptoms: A meta-analytic review. J Anxiety Disord. 2016;38:37–46. doi: 10.1016/j.janxdis.2016.01.001. [DOI] [PubMed] [Google Scholar]
- Lobb EA, Kristjanson LJ, Aoun SM, Monterosso L, Halkett GK, Davies A. Predictors of complicated grief: a systematic review of empirical studies. Death Stud. 2010;34:673–698. doi: 10.1080/07481187.2010.496686. [DOI] [PubMed] [Google Scholar]
- Maercker A, Znoj H. The younger sibling of PTSD: similarities and differences between complicated grief and posttraumatic stress disorder. Eur J Psychotraumatol. 2010;1 doi: 10.3402/ejpt.v1i0.5558. [DOI] [PMC free article] [PubMed] [Google Scholar]
- Olaya B, Alonso J, Atwoli L, Kessler RC, Vilagut G, Haro JM. Association between traumatic events and post-traumatic stress disorder: results from the ESEMeD-Spain study. Epidemiol Psychiatr Sci. 2014:1–12. doi: 10.1017/S2045796014000092. [DOI] [PMC free article] [PubMed] [Google Scholar]
- Ozer EJ, Best SR, Lipsey TL, Weiss DS. Predictors of posttraumatic stress disorder and symptoms in adults: a meta-analysis. Psychol Bull. 2003;129:52–73. doi: 10.1037/0033-2909.129.1.52. [DOI] [PubMed] [Google Scholar]
- Peduzzi P, Concato J, Kemper E, Holford TR, Feinstein AR. A simulation study of the number of events per variable in logistic regression analysis. J Clin Epidemiol. 1996;49:1373–1379. doi: 10.1016/s0895-4356(96)00236-3. [DOI] [PubMed] [Google Scholar]
- Pennell BE, Mneimneh Z, Bowers A, Chardoul S, Wells JE, Viana MC, Vilagut G. Implementation of the World Mental Health Surveys. In: Kessler RC, Üstün TB, editors. The WHO World Mental Health Surveys: Global Perspectives on the Epidemiology of Mental Disorders. New York, NY: Cambridge University Press; 2008. pp. 33–57. [Google Scholar]
- Reed JF., III Better Binomial Confidence Intervals. Journal of Modern Applied Statistical Methods. 2007;6:15. [Google Scholar]
- Roemer L, Litz BT, Orsillo SM, Ehlich PJ, Friedman MJ. Increases in retrospective accounts of war-zone exposure over time: the role of PTSD symptom severity. J Trauma Stress. 1998;11:597–605. doi: 10.1023/a:1024469116047. [DOI] [PubMed] [Google Scholar]
- SAS Institute Inc. SAS Software Version 9.2 (Version 9.3 for Unix) Cary, NC: SAS Institute Inc.; 2008. [Google Scholar]
- Scott KM, Al-Hamzawi AO, Andrade LH, Borges G, Caldas-de-Almeida JM, Fiestas F, Kessler RC. Associations between subjective social status and DSM-IV mental disorders: results from the World Mental Health surveys. JAMA Psychiatry. 2014;71:1400–1408. doi: 10.1001/jamapsychiatry.2014.1337. [DOI] [PMC free article] [PubMed] [Google Scholar]
- Simon NM. Treating complicated grief. JAMA. 2013;310:416–423. doi: 10.1001/jama.2013.8614. [DOI] [PMC free article] [PubMed] [Google Scholar]
- Smith GC, Seaman SR, Wood AM, Royston P, White IR. Correcting for optimistic prediction in small data sets. Am J Epidemiol. 2014;180:318–324. doi: 10.1093/aje/kwu140. [DOI] [PMC free article] [PubMed] [Google Scholar]
- Wolter KM. Introduction to Variance Estimation. New York, NY: Springer-Verlag; 1985. [Google Scholar]
- World Bank. Data: Countries and Economies. from http://data.worldbank.org/country.
- Zisook S, Chentsova-Dutton Y, Shuchter SR. PTSD following bereavement. Ann Clin Psychiatry. 1998;10:157–163. doi: 10.1023/a:1022342028750. [DOI] [PubMed] [Google Scholar]
- Zoellner LA, Foa EB, Brigidi BD, Przeworski A. Are trauma victims susceptible to “false memories”? J Abnorm Psychol. 2000;109:517–524. doi: 10.1037/0021-843X.109.3.517. [DOI] [PubMed] [Google Scholar]
- Zou KH, O’Malley AJ, Mauri L. Receiver-operating characteristic analysis for evaluating diagnostic tests and predictive models. Circulation. 2007;115:654–657. doi: 10.1161/circulationaha.105.594929. [DOI] [PubMed] [Google Scholar]
Associated Data
This section collects any data citations, data availability statements, or supplementary materials included in this article.