

Summary
Transcriptional regulation during CD4+ T cell fate decisions enables their differentiation into distinct states, guiding immune responses towards antibody production via Tfh cells or inflammation by Teff cells. Tfh–Teff fate commitment is regulated by mutual antagonism between the transcription factors Bcl6 and Blimp-1. Here we examined how T cell receptor (TCR) signals establish and arbitrate Bcl6–Blimp-1 counter-antagonism. We found that the TCR-signal induced transcription factor Irf4 is essential for the differentiation of Bcl6-expressing Tfh and Blimp-1-expressing Teff cells. Increased TCR signaling raised Irf4 amounts and promoted Teff fates at the expense of Tfh ones. Importantly, orthogonal induction of Irf4 expression redirected Tfh fate trajectories towards those of Teff. Mechanistically, we linked greater Irf4 abundance with its recruitment towards low affinity binding sites within Teff cis-regulatory elements, including those of Prdm1. We propose that the Irf4 locus functions as the “reader” of TCR signal strength, in turn, concentration-dependent activity of Irf4 “writes” T helper fate choice.
Keywords: transcription factors, CD4 T cell differentiation, T cell receptor, T follicular helper cells, T effector cells, antibody responses, Irf4, Blimp-1, Bcl6
Graphical Abstract
Introduction
Cell fate determination of CD4+ T cells into helper cells (Th) of the T follicular helper (Tfh) and T effector (Teff) fates is central to adaptive immunity. Tfh cells are essential for orchestrating antibody responses with B cells whereas Teff cells are essential for directing inflammatory cell activation in microbe-damaged tissue (Qi, 2016). This Tfh–Teff cell help axis is complementary when mounted against complex pathogens that encode both intracellular and extracellular antigens. Nevertheless, reports that specific conditions bias Tfh or Teff cell differentiation suggest that specific signals, including cytokines, costimulation, and the inflammatory milieu, are integrated to coordinate the array of Th cell fates (Kanno et al., 2012).
The precise signals involved in the coordination of Tfh–Teff cell fate choices have emerged as an important focus of CD4+ T cell biology. It is thought that this split occurs in the outer T cell zone of secondary lymphoid organs where guidance cues involving the chemokine receptors EBI2, CCR7 and CXCR5 partner newly activated CD4+ T cells with activated dendritic cells (Qi, 2016). Next, combined signaling by the costimulatory receptor Icos and interleukin-2 receptor (IL-2R) on activated T cells functions to specify Tfh cell fates if IL-2R signaling is weak. In contrast, it is thought that if IL-2R signaling is intense, Teff cell fate specification predominates at the expense of that of Tfh (Choi et al., 2011; Johnston et al., 2012; Li et al., 2016; Pepper et al., 2011). After Tfh cell specification, interactions with antigen specific B cells involving ICOS and SLAM promote Tfh cell fate commitment. T cell receptor (TCR) signal intensity has been implicated in mediating Tfh–Teff cell fate decisions (Fazilleau et al., 2009; Keck et al., 2014; Tubo et al., 2013; van Panhuys et al., 2014); however, the molecular basis of this signal as well as how cells integrate the TCR input with that of ICOS and IL-2R are not known.
Differential gene regulation is central to the acquisition of varied Th cell fate and function, as such, transcription factors direct cell fate determination by coordinating the expression of gene programs that specify fate as well as that suppress alternate cell fate gene programs (Kanno et al., 2012). Teff cells depend on the Tbet, Rorc, Gata3, Klf2, Tcf1/Lef1, Blimp-1, and Irf4 transcription factors, whereas Tfh cells depend on the Bcl6, Tcf1/Lef1, Batf, Id2, Ascl2, and Irf4 transcription factors for their generation (Qi, 2016). In addition, members of the cytokine activated STAT family of transcription factors play complex roles in Th cell formation (Kanno et al., 2012). Among the above transcription factors, transcriptional counter-antagonism between Blimp-1 and Bcl6 serves as a primary mechanism for commitment to the Teff and Tfh cell fates, respectively (Crotty et al., 2010). However, because Blimp-1 and Bcl6 expression is induced during the course of T cell activation, understanding how this negative feedback loop is established and negotiated as cells differentiate remains an important goal.
The Irf4 transcription factor has emerged as a central determinant of B and T cell activation and differentiation. Induction of Irf4 expression occurs immediately following antigen receptor signaling in these cells and is not regulated by IFN signaling (Matsuyama et al., 1995). In fact, we and others have shown that the amounts of Irf4 scale with the intensity of antigen receptor signaling (Man et al., 2013; Nayar et al., 2014; Ochiai et al., 2013; Yao et al., 2013). In contrast to lineage-specific (Th1, Th2, Th9, Th17, etc.) transcription factors, Irf4 plays a broad role in Th cell differentiation by controlling the generation of many of these lineages (Huber and Lohoff, 2014), suggesting a unique role for Irf4 in Th cell fate decisions. Our group and others have shown that Irf4 plays an essential and direct role in the induction of Blimp-1 and Bcl6 expression during B cell differentiation into plasma and Germinal Center (GC) B cells, respectively (Ochiai et al., 2013; Sciammas et al., 2006; Willis et al., 2014) as well as in the induction of Blimp-1 during Treg cell differentiation (Cretney et al., 2011). However, whether this ability of Irf4 is conserved in the context of Th cell fate decisions is not known. Irf4 binds to distinctive DNA sequence elements depending on its interaction with diverse transcription factors as well as its expression levels (Ochiai et al., 2013). For example, ChIP-seq experiments in B cells and Th17 cells have demonstrated that Irf4 binds to Interferon-Stimulated Response Elements (ISRE) as a homodimer as well as to AP-1-IRF Composite Elements (AICE) in a complex with Batf-JunB or Batf-c-Jun (Ciofani et al., 2012; Glasmacher et al., 2012; Li et al., 2012; Ochiai et al., 2013). In light of the unusual role of Irf4 in Th cell activation and differentiation, how its expression levels and its binding site choice are coordinated in order to direct Tfh and Teff cell fate decisions remains speculative.
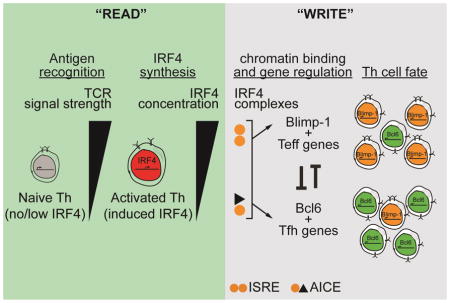
Here we asked whether an Irf4-based, TCR signal-induced gene regulatory network controls Teff–Tfh cell fate choices. We found that, in response to protein immunization, Irf4 is required cell-intrinsically to activate the expression of Blimp-1 and Bcl6, thus coordinating the differentiation of Teff and Tfh cells, respectively. Titrating weak and strong agonist peptide antigens demonstrated that augmenting TCR signal strength increased Irf4 concentrations and enhanced Teff cell fate trajectories at the expense of those of Tfh. Because TCR signal strength positively correlated with Irf4 expression and Teff cell fate outcomes, we hypothesized that augmenting Irf4 amounts, during a given configuration of TCR-pMHCII interactions, would “redirect” Tfh cell fates towards that of Teff. Using an orthogonal genetic system based on a tetracycline-inducible allele of Irf4, we found that greater amounts of Irf4, under a fixed TCR signal intensity, antagonized Tfh cell specification and instead promoted Teff cell fate choice. Of note, this occurred independently of IL-2 signaling. At the molecular level, the abundance of Irf4 is linked with its recruitment to divergent DNA binding sequences that differ in affinity as well as to the Tfh- and Teff-affiliated regulatory elements that they are deposited in, including those that associate with Bcl6 and Blimp-1. These findings suggest that graded expression of Irf4 combined with its differential affinity to divergent DNA sequences functions to coordinate Teff–Tfh cell fate choice. Accordingly, we propose a model whereby the Irf4 locus functions as the “reader” of TCR signal strength, in turn, the concentration dependent activity of the Irf4 transcription factor functions as the “writer” of Th cell fate choice.
Results
Irf4 is required in a cell autonomous manner for Tfh and Teff differentiation
Irf4 has been shown to play a role in Tfh differentiation (Bollig et al., 2012); however, it was unclear whether Irf4 was required for clonal expansion, survival, or differentiation. We determined whether the defect in Tfh differentiation was cell autonomous by creating 50:50 mixed bone marrow chimeras using Irf4+/+ or Irf4−/− progenitors. Following hematopoietic reconstitution, mice were immunized with sheep red blood cells, Fig. S1A. Whereas CD45.1+ Irf4+/+ CD4+ T cells displayed the characteristic CXCR5+PD-1+ Tfh phenotype, no such cells were observed in CD45.2+ Irf4−/− CD4+ T cell compartment, Fig. S1B. In addition, Irf4−/− CD4+ cells were impaired in their ability to activate the expression of Tfh-specific Bcl6 as well as Teff-specific Prdm1 and Tbx21 transcripts (genes encoding Blimp-1 and TBET), Fig. S1C (see below). This defect was intrinsic to Irf4−/− CD4 T cells because these chimeric animals contained wild type dendritic and B cells capable of the necessary supportive signals.
Given the polyclonal nature of the chimera experiment, it was unclear whether the absence of Tfh cells was due to impaired clonal expansion or differentiation. To address this question, OT-II TCR transgenic (Tg) mice, specific for the 323-39aa segment of chicken ovalbumin (pOVA) when presented on I-Ab, were bred to Irf4−/− mice to generate a source of donor T cells (CD45.2) that could be tracked upon adoptive transfer into CD45.1 congenic mice; importantly, the donor mice were also bred to Rag1−/− mice to fix OT-II TCR specificity, Fig. 1A. Recipient mice harboring Irf4+/+ or Irf4−/− OT-II cells were immunized with CFA-emulsified RFP-OVA and the draining lymph nodes were analyzed 5 days later using flow cytometry. RFP-OVA is a fusion protein that we developed that is comprised of Red Fluorescent Protein and OVA323-39 epitopes (see methods). The motivation to fuse the peptide epitopes to the larger RFP was twofold: i) linkage of RFP-specific B cell epitopes to pOVA would promote T-B interactions important for Tfh differentiation and ii) an inherently fluorescent tetrameric protein that could be used to track RFP-specific B cell responses by flow cytometry.
Figure 1.

Irf4 is required in a cell autonomous manner for Tfh and Teff differentiation. (A) Immunization scheme of Irf4+/+ or Irf4−/− OT-II TCR Tg cells (CD45.2+, Rag1−/−), congenic CD45.1+ hosts, and RFP-OVA antigen. 5 days after immunization, donor cells (CD45.1−B220−MHCII−CD45.2+CD4+) were analyzed. Contour plots (B) and frequencies, mean±SD (C) of the indicated PD-1 and CXCR5 populations; contour plots (D) and frequencies, mean±SD (E) of the indicated Tbet and Bcl6 populations; contour plots (K) and frequencies, mean±SD (L) of IFNγ secretion. (F) Immunization scheme as in (A) except using Tcrβ−/−δ−/− hosts. 7 days after immunization, contour plots (G) and frequencies, mean±SD (H) of B cells (B220+) binding RFP; contour plots (I) and frequencies, mean±SD (J) of RFP-binding GC B cells (Fas+GL7+). Experiments in B–E, and K–L are from 15 mice in 4 experiments performed while G–J are from 6 mice in 2 experiments performed; contour plots are concatenated files from all mice of a given group in a given experiment. See also Figure S1.
We observed high expression of CD44 in OT-II cells of both genotypes; however, the Irf4−/− OT-II cells exhibited lower cell yields (Fig. S1D & E) consistent with a role for Irf4 in the control of T cell activation (Man et al., 2013). Analysis of PD-1 and CXCR5 expression revealed that Irf4+/+ OT-II cells clustered into the three populations, non-Tfh, pre-Tfh, and GC-Tfh, those that progressively gain PD-1 and CXCR5 expression; however, Irf4−/− OT-II cells did not express CXCR5 or PD-1, Fig. 1B & C, S1J. Furthermore, Irf4−/− OT-II cells failed to express Bcl6 protein, Fig. 1D & E, S1J. We note, Irf4−/− OT-II cells expressed comparable levels of CD28 and IL2rα but lower levels of CTLA-4 precluding a role for these molecules in regulating Tfh differentiation, Fig. S1E. However, we observed reduced expression of ICOS, Fig. S1E, as previously described (Zheng et al., 2009). Nevertheless, given the moderate effect on Tfh differentiation by shRNA-mediated knockdown of ICOS expression (Pedros et al., 2016), it is unlikely to fully explain the marked Tfh defect of Irf4−/− cells. Thus, besides T cell activation, Irf4 likely plays an essential role in regulating the differentiation of Tfh cells.
To determine whether B cell helper activity was impaired along with the lack of identifiable Irf4−/− OT-II Tfh cells, we transferred Irf4+/+ or Irf4−/− OT-II cells into Tcrβ−/−δ−/− mice and measured B cell responses to RFP, Fig. 1F. We observed a marked decrease in the percentages and numbers of RFP-binding, IgD− antigen specific B cells in mice harboring Irf4−/− OT-II cells compared to those with Irf4+/+ OT-II cells, Fig. 1G–H. Accompanying the lack of B cell clonal expansion, RFP-binding B cells in recipients of Irf4−/− OT-II cells failed to acquire GC B cell phenotypes, to undergo class switch recombination, and generate RFP-specific IgG antibodies, although these parameters were efficiently measured in recipients of Irf4+/+ OT-II cells, Fig. 1I–J, S1F–H. Together, this analysis demonstrates that Irf4 plays an essential role in controlling Tfh cell identity as well as function.
To determine whether the Irf4−/− OT-II cells were instead diverted into the Teff lineage, we focused on cells that expressed high levels of TBET protein and secreted IFN-γ. This analysis revealed impaired generation of TBET+ and IFN-γ secreting cells among Irf4 depleted cells, Fig. 1D & E, K & L, S1J, consistent with a recent report (Mahnke et al., 2016). Furthermore, sorting of responding OT-II cells 5 days after immunization uncovered a paucity of Tbx21 and Prdm1 transcripts in Irf4−/− OT-II cells, Fig. S1I. Together, these observations demonstrate that Irf4 plays a key role in Teff cell differentiation.
Given that Tfh and Teff cell fates antagonize each other via reciprocal repression between the Bcl6 and Blimp-1 transcription factors, our data suggest that Irf4 plays a front-end role to establish this Th cell counter antagonistic gene regulatory module comprised of Bcl6 and Blimp-1, a property of Irf4 we had demonstrated in B cells (Ochiai et al., 2013). Following, we dissect the role of TCR signal strength-regulated Irf4 expression levels and, in turn, how those cellular concentrations are integrated by the genome to coordinate Th cell fate choice.
Irf4 amounts scale proportionally with increased TCR signal strength
We next focused on the TCR because it is known that Irf4 is an immediate-early inducible gene of the TCR and BCR (Matsuyama et al., 1995). In addition, we had previously shown that increasing BCR signal strength augmented Irf4 expression (Ochiai et al., 2013; Sciammas et al., 2011), an observation that has been extended to the TCR of CD8 T cells (Man et al., 2013; Nayar et al., 2014; Yao et al., 2013). The role of the 5c.c7 TCR in antigen recognition and T cell activation has been extensively characterized and several altered peptide ligands (APLs) that differ in activation potency have been identified (Davis et al., 2007). 5c.c7 T cells recognize the moth cytochrome C peptide (88–103) when presented by I-Ek. We measured Irf4 expression levels in 5c.c7 TCR Tg CD4+ T cells responding to I-Ek expressing P13 cells displaying a range of cell surface densities and potencies of pMHCII complexes comprised of, in increasing activity, T102S, MCC, and K5 APLs (Corse et al., 2010), Fig. 2A. Indeed, we observed that induced levels of Irf4 transcripts at 4 hours presage Irf4 protein concentrations at 12–48 hours in proportion to increasing TCR signal strength in both undivided and divided cells in vitro, Fig. 2B–C and S2E (and not shown).
Figure 2.

Initial Irf4 amounts scale proportionally with increased TCR signal strength. (A) Stimulation scheme of CFSE labeled 5c.c7 TCR Tg CD4+ T cells (CD45.2+, Rag2−/−), P13 antigen presenting fibroblasts (I-Ek+B7-1+ICAM+), and MCC APL. (B) 4hrs after stimulation, Irf4 transcripts were measured by RT-qPCR and normalized to Oct1; average and SEM of four biological replicates from two experiments performed. (C) 2 days after stimulation contour plots of CFSE and Irf4 expression on CD4+ cells are shown. Representative result of 3 experiments performed. (D) Immunization scheme of 5c.c7 TCR Tg CD4+ T cells (CD45.2+, Rag2−/−), congenic CD45.1+ B10.A hosts, and RFP-MCC or RFP-T102S antigens. 1.5 days (E–F) 3 days (G–H) or five days (I–J) after immunization, donor cells (CD45.1−B220−MHCII−CD45.2+CD4+) were analyzed. Histograms (E, G, I) and gMFI, mean±SD (F, H, J) of Irf4. Experiments in E–J are from 8 mice in 2 experiments performed; contour plots are concatenated files from all mice of a given group in a given experiment. Numbers above the bars in (F) represent gMFI fold change over that of the no antigen control. See also Figure S2.
To extend these observations in vivo as well as to develop a system where we could correlate TCR-regulated Irf4 expression levels with Th cell fate outcomes, we generated RFP-fused immunogens (as above) that included the HEL48-62 peptide and the MCC88-103 strong agonist or the MCC108-103 (T102S) weak agonist APL. The HEL48-62 peptide from Hen Egg Lysozyme was used to quantitate productive HEL/I-Ak pMHCII complexes using the Aw3.19 mAb (Dadaglio et al., 1997). The K5 altered peptide ligand was not used in these studies as it does not behave as a super-agonist in vivo (Corse et al., 2010). To examine the effects of TCR signal strength on Irf4 expression dynamics and Th cell fate choice, 5c.c7 TCR Tg CD4 T cells (Rag2−/−) were adoptively transferred into B10.A CD45.1 congenic mice and then immunized with varying doses of RFP-MCC or RFP-T102S, Fig. 2D. At day 1.5, we observed that the intensity of TCR signal strength increased the amplitude of peak Irf4 expression, Fig. 2E & F. For example, comparison of the gMFI of Irf4 measurements between no antigen and 400μg of RFP-MCC shows a ~3.9 fold increase. Interestingly, by days 3 and 5, Irf4 levels drop to a new baseline that is seemingly uncoupled from TCR signal strength, Fig. 2G–J. Higher expression of IL2rα, another gene product regulated by TCR signal strength, was observed in MCC-responding cells at day 1.5, consistent with earlier reports (Gottschalk et al., 2012), Fig. S2A & B. Of note, we can exclude differences in the quantity of pMHCII APL complexes formed by the two immunogens; the Aw3.19 mAb detected a similar abundance of the surrogate pMHCII complex, HEL48-62/I-Ak, that was processed from both RFP fusion proteins, Fig. S2C & D. Combined, these results demonstrate that the Irf4 locus functions as a sensor of TCR signal strength such that Irf4 protein accumulation scales with increasing signal intensity, prior to Th cell fate decisions.
TCR regulated Irf4 concentrations control alternate Th cell fate decisions
We next determined whether the changes in Irf4 expression levels induced by the intensity of TCR signal strength correlated with changes in Th cell fate decisions. Adoptive transfers of 5c.c7 TCR Tg cells and immunization of recipient mice were performed and the outcome of Th cell fate specification was analyzed at day 3 and Th cell fate commitment at day 5 after immunization, Fig. 3A. At the onset of Tfh specification (day 3), we observed a marked decrease in the frequency of Bcl6 expressing cells as a function of TCR signal intensity consistent with a role of increasing TCR signal strength in limiting Tfh differentiation, Fig. 3B–C, S3C. However, we did not observe a corresponding increase in IL2rα expressing cells under these conditions. Upon commitment at day 5, the Tfh cell response, especially in the GC-Tfh compartment (PD1hiCXCR5hi), markedly decreased in MCC-responding cells compared to T102S-responding cells, Fig. 3D & E, a phenotype that was accompanied with a statistically significant decrease in the frequency of Bcl6 expressing cells, Fig. 3F & G. Indeed, the frequency of Teff cells expressing TBET (Fig. 3F & G) and secreting IFN-γ (Fig. 3H & S3A) was consistently higher for the MCC-responding cells compared to T102S-responding cells and increased proportionally with higher doses of antigen in MCC-responding cells although this trend did not show significance for TBET measurements. Reflective of its diminished potency, the absolute numbers of T102S-responding cells were less than MCC-responding cells in all doses used, Fig. S3B; however, in accord with the small changes in the T102S- or MCC-responding cells as a function of escalating dose, the observed changes in proportions likely reflect alternate cell decisions rather than a specific effect on a given population, Fig. S3B, D. Together these data demonstrate that increasing TCR signal strength substantially impacts Teff–Tfh cell fate decisions such that the latter is expended in favor of the former at high intensity TCR signal strength.
Figure 3.

TCR regulated Irf4 concentrations control alternate Th cell fate decisions. (A) Immunization scheme of 5c.c7 TCR Tg CD4+ T cells (CD45.2+, Rag2−/−), congenic CD45.1+ B10.A hosts, and RFP-MCC or RFP-T102S antigens. 3 days (B) and 5 days (D–H) after immunization, donor cells (CD45.1−B220−MHCII−CD45.2+CD4+) were analyzed. Contour plots (B) and frequencies, mean±SD (C) of the indicated Bcl6 and IL2rα populations; contour plots (D) and frequencies, mean±SD (E) of the indicated PD-1 and CXCR5 populations; contour plots (F) and frequencies, mean±SD (G) of the indicated Tbet and Bcl6 populations; frequencies, mean±SD (H) of IFNγ secretion. Experiments in B are from 8 mice, in C–H are from 7 mice, all from two experiments performed; contour plots are concatenated files from all mice of a given group in a given experiment. Experiment in B used 200μg antigen. See also Figure S3.
Cell concentrations of Irf4 direct Tfh versus Teff cell differentiation
The strong correlations between TCR signal strength, Irf4 expression, and Teff–Tfh cell fate outcomes suggested a functional role for Irf4 concentrations in alternate Th cell fate decisions. To test the hypothesis that Irf4 expression levels functioned dominantly in this setting, we employed an Irf4-inducible system that we had previously developed to orthogonally perturb Irf4 expression levels in vivo independently of antigen receptor stimulation (Ochiai et al., 2013). Mice harboring an inducible Irf4 allele (a transcriptional unit comprised of a minimal promoter harboring tet-operator sites upstream of an Irf4 cDNA) and encoding the tetracycline-regulatable transactivator (M2rtTA) were bred to Irf4+/+ OT-II mice (Rag1−/−) described above (hereafter referred to as Irf4-inducible OT-II mice). OT-II cells from these mice express Irf4 normally; however, in the presence of doxycycline (DOX) Irf4 expression increases due to expression from the transgenic allele (Ochiai et al., 2013). Engineered OT-II cells from these mice were used as donor cells in adoptive transfer experiments. Based on the results in Figs. 2 & 3, we hypothesized that increasing the levels of Irf4 expression in OT-II TCR Tg cells, whose TCR signal strength efficiently generates Tfh cells, would lead to Teff cell fate choices at the expense of those of Tfh and result in reduced antibody responses.
Importantly, because we observed that Irf4 expression peaks at day 1.5 and declines by day 3 after immunization, we opted to model these dynamics and perturb the early amplitude of Irf4 expression by treating adoptively transferred mice transiently with DOX, only during the first two days of RFP-OVA immunization, Fig. 4A. Kinetic analysis of Irf4 expression showed that, as in 5c.c7 TCR Tg cells, Irf4 expression in OT-II cells peaks at day 1.5 and establishes a new baseline by day 3, Fig. 4B & C. As expected, transient DOX treatment raised the amount of Irf4 at day 1.5 but not day 3. In fact, we calculate a ~3.6 fold induction of Irf4; within the range of 5c.c7 TCR Tg cells responding to MCC (compare to Fig. 2F). Normal OT-II Tfh cell differentiation occurred in the absence of DOX; however, after transient DOX treatment, marginal frequencies of Tfh cells and Bcl6+ cells were detectable at either specification (day 3) or commitment (day 5), Fig. 4D–G, S4D–F. At day 3 we observed more IL2rα-expressing cells (Fig. 4D & E) which likely yielded the corresponding emergence of CXCR5− Teff cells that exhibited high TBET protein expression and greater IFN-γ secretion at day 5, Fig. 4H–K, S4F. Furthermore, markedly diminished anti-RFP B cell responses were observed only in mice with transient DOX treatment, Fig. 4L–P, S4A–C. Interestingly, we observed up to 10 fold fewer overall OT-II cells in the transiently-treated DOX group compared to control, Fig. S4D. Because, in both the treated and untreated groups we observed similar numbers of OT-II cells at day 3 that exhibited similar division histories (based on CFSE dye-dilution) as well as equivalent frequencies of cells expressing activated caspase 3, Fig. S4G, we hypothesize that the lower recovery of cells at the later time points is related to their functional efferent migration (see gene expression patterns below). Overall, we conclude that, under conditions of TCR-permissive Tfh cell generation, greater Irf4 abundance during priming functions to divert Tfh-destined cells to adopt a Teff cell fate.
Figure 4.

Cell concentrations of Irf4 direct Tfh versus Teff cell fates. (A) Immunization scheme of Irf4-inducible (Irf4+/+) OT-II TCR Tg CD4+ T cells (CD45.2+, Rag1−/−), congenic CD45.1+ hosts, RFP-OVA antigen, and ± DOX treatment during the first two days of immunization only. 1.5 days (B), 3 days (C–E), or 5 days (F–K) after immunization, donor cells (CD45.1−B220−MHCII−CD45.2+CD4+) were analyzed. Irf4 histograms and gMFI, mean±SD (B–C); contour plots (D) and frequencies, mean±SD (E) of the indicated Bcl6 and IL2rα populations; contour plots (F) and frequencies, mean±SD s (G) of the indicated PD-1 and CXCR5 populations; contour plots (H) and frequencies, mean±SD (I) of the indicated Tbet and Bcl6 populations; contour plots (J) and frequencies, mean±SD (K) of the indicated IFNγ populations. (L) Immunization scheme as in (A) except using Tcrβ−/−δ−/− hosts. 7 days after immunization, contour plots (M) and frequencies, mean±SD (N) of B cells (B220+) binding RFP; contour plots (O) and frequencies, mean±SD (P) of RFP-binding GC B cells (Fas+GL7+). Experiments in B–E are from 4 mice of a single experiment, in F–K are from 14 mice in 4 experiments performed, in M–P are from 6 mice in 2 experiments performed; contour plots are concatenated files from all mice of a given group in a given experiment. Numbers above the bars in (B) represent gMFI fold change over the no antigen control. See also Figure S4.
Low and high Irf4 expression levels control distinct Th cell fate programs
To better understand the molecular basis of Irf4 activity in controlling Teff–Tfh cell fate decisions, we compared the gene expression patterns of three groups of OT-II cells: Irf4−/−, Irf4+/+, and Irf4-inducible (Irf4+/+) in the presence of transient DOX treatment at day 3 of Tfh cell fate specification. RNA-seq measurements show that Irf4 dosage regulates distinct gene expression profiles in relation to a curated list of Tfh or Teff cell-specific genes (Choi et al., 2015). Specifically, in the absence of Irf4, many Tfh or Teff genes are not induced, including the signature genes Bcl6 and Prdm1, Fig. 5A. In contrast, when Irf4 levels are induced, above that of Irf4+/+ OT-II cells, the Teff pattern of gene expression dominates, e.g. activation of Prdm1, Tbx21, Ifng, Prf1, and Gzmb with concurrent repression of the Tfh pattern, e.g. Bcl6, Pdcd1, Cxcr5, Slamf6, Fig. 5A. We note that a composite pattern of both Tfh and Teff genes are expressed among Irf4+/+ OT-II cells due to the presence of both populations. Interestingly, a fraction of genes, mostly from the Tfh signature of this curated list appear to be regulated normally in Irf4−/− OT-II cells yet repressed in DOX-treated Irf4-inducible OT-II cells, suggesting that their induction is independent of, yet their repression is dependent on Irf4. Thus, the observed trends in gene expression reflect the changes in cellular fate trajectories described above.
Figure 5.

Low and high Irf4 expression levels control distinct Th cell gene programs. Irf4−/−, Irf4+/+, or Irf4-inducible (Irf4+/+) OT-II TCR Tg CD4+ T cells (CD45.2+, Rag1−/−) were adoptively transferred into congenic CD45.1+ hosts and immunized with RFP-OVA. Three days after immunization, donor cells (CD45.1−B220−MHCII−CD45.2+CD4+) were sorted and processed for RNA-seq. Mice harboring Irf4-inducible OT-II cells were administered water containing DOX for the first two days of immunization only. Three to five biological replicates, comprised of pooled cells from multiple mice, were processed for each group. (A) RNA-seq absolute expression in counts per million (CPM) of indicated transcripts and indicated groups including LCMV-specific Tfh and Th1 cells (GEO: GSM1645004-7). (B) Six patterns of differentially expressed RNA transcripts, R1-6, are shown as box plots (median ±%75th for the box and ±%25th for the whiskers) plotted as a function of averaged Z-scored values. Genes from the Irf4 analysis was used to filter those from Tfh and Th1 (as in A). The number of gene members of each cluster as well as representative genes of the cluster are shown. To the right of the box plots, spider plots display the highest scoring gene ontology terms, organized by p-value. (C) Dot plot of differential gene expression; select Tfh and Teff genes are called out in red. See also Figure S5 and Tables S1–2.
Inspection of the overall differential gene expression data revealed 6 patterns, R1-6, that differed based on their dependence on Irf4 concentrations, Fig. 5B. Within each cluster we observed enrichment of functional T cell differentiation gene ontology categories, Fig. 5B. We note that genes exhibiting higher expression in DOX-treated Irf4-inducible OT-II cells (cluster 4) include chemokine (Ccr9, Cxcr6) as well as integrin (Itgam and Itga4) receptors that may relate to the functional migratory behavior of these Teff cells, Fig. 5C, Fig. S5A. Thus, transcriptome analysis demonstrates that Irf4 broadly regulates the Tfh and Teff gene programs, including the fate-determining Bcl6 and Prdm1 genes. Moreover, if Irf4 levels exceed a certain point, a wholesale change in gene expression trajectories towards the Teff cell gene program occurs and collapses that of the Tfh program.
High cell concentrations of Irf4 directs Teff cell differentiation independently of IL-2 signaling
The IL-2–IL-2R–Stat5 pathway plays a pivotal role in promoting Teff cell fate decisions at the expense of Tfh ones (Choi et al., 2011; Johnston et al., 2012; Li et al., 2016; Pepper et al., 2011). Both TCR signal strength (Fig. S2A) and Irf4 dosage appeared to differentially regulate gene members of the IL-2 pathway (Il2ra and Il2rb, Fig. 5A), raising the possibility that an Irf4-dependent, yet indirect mechanism of Teff cell fate choice is orchestrated whereby increased signaling by IL-2, communicated by high expression levels of Irf4, drives Teff cell fate choice. To test this possibility, we used the Irf4-inducible OT-II cell adoptive transfer model, and induced Irf4 expression with DOX as above, while neutralizing IL-2, Fig. 6A. We performed these experiments in Tcrβ−/−δ−/− host mice to preclude any indirect effects of IL-2-neutralization on Treg cell activity on the outcome. In line with the importance of IL-2 in suppressing Tfh cell fate choice in favor of that of Teff cells, IL-2 neutralization enhanced the generation of Tfh cells (CXCR5+PD1+, Bcl6+) and reduced Teff cells (CXCR5−PD1−, TBET+) relative to control antibodies in the control group (no DOX), Fig. 6B–E, S6A–C. In contrast, when Irf4 expression is transiently raised (+DOX group), Teff cells persist and Tfh cell fate trajectories continue to be inhibited despite IL-2 neutralization, Fig. 6A & B, S6A–C. Unexpectedly, we observed much greater Teff cell generation (TBET and IFN-γ expression) in the control groups (no DOX) in Tcrβ−/−δ−/− hosts compared to wild type hosts (Fig. 1D & E) perhaps due to the absence of Tregs in the former. Additionally, the fewer Teff cells in the (+DOX) may relate to the increased migratory potential of DOX-treated Irf4-inducible OT-II cells. Thus, these data demonstrate that preferential Teff cell fate trajectories due to increased Irf4 concentrations does not appear to be based on regulating IL-2 signaling.
Figure 6.

High cell concentrations of Irf4 directs Teff cell fate independently of IL-2 signaling. (A) Immunization scheme of Irf4-inducible (Irf4+/+) OT-II TCR Tg CD4+ T cells (CD45.2+, Rag1−/−), congenic CD45.1+ hosts, RFP-OVA antigen, ± anti-IL2 treatment, and ± DOX treatment during the first two days of immunization only. 5 days after immunization, donor cells (CD45.1−B220−MHCII−CD45.2+CD4+) were analyzed. Contour plots (B) and frequencies, mean±SD (C) of the indicated PD-1 and CXCR5 populations; contour plots (D) and frequencies, mean±SD (E) of the indicated Tbet and Bcl6 populations; Experiments in B–E are from 6 mice in 2 experiments; contour plots are concatenated files from all mice of a given group in a given experiment. See also Figure S6.
Irf4 targets divergent DNA motifs to control Tfh and Teff gene programs
To refine the molecular analysis, we sought to identify Irf4 target genes and binding site usage. As normal Tfh differentiation does not fully occur under in vitro culture conditions (Choi et al., 2015) we opted to identify Irf4 target genes in vivo using the genetic OT-II systems described above. Because the amounts of Irf4-bound chromatin obtained from the small numbers of responding OT-II cells would be prohibitive to perform classical ChIP-seq experiments, we reasoned that the high complexity of the ISRE and AICE DNA elements that are recognized by Irf4 (Fig. S7B and Table S7) would enable us to infer, using statistical bioinformatics, the subset of Irf4-bound regions among the group of all chromatin-accessible regions (ChARs) of the genome. Thus, we performed the low cell input Assay for Transposase-Accessible Chromatin with high throughput sequencing (ATAC-seq) experiment (Buenrostro et al., 2013) on the three groups of OT-II CD4+ cells that differ with respect to Irf4 concentrations: Irf4−/−, Irf4+/+, and Irf4-inducible cells treated transiently with DOX. ATAC-seq libraries were generated from the same cells analyzed by RNA-seq. Union analysis of the three groups revealed ~96,000 ChARs that agreed well with previous analyses despite differences in the types of cells (ex vivo vs in vitro) and platforms (ATAC-seq vs DNAseI-seq), Fig. S7A. A large number (~30,000) of ChARs exhibited differential accessibility as a function of Irf4 concentrations and assorted into five clusters, A1-5, based on patterns of accessibility, e.g. A4 and A5 gained accessibility with increasing amounts of Irf4, Fig. 7A. Analysis of Bcl6 and Prdm1 gene tracks demonstrates that within genes, different ChAR patterns are evident revealing dynamic chromatin dynamics, Fig. 7B. Thus, a third of all ChARs in activated Th exhibit Irf4 dose dependent changes in accessibility suggesting that Irf4 plays a prominent role in staging chromatin remodeling during Th cell fate decisions.
Figure 7.

Irf4 targets distinct DNA motifs to control Tfh and Teff gene programs. ATAC-seq libraries were generated from the same cells in Figure 5. (A) Five patterns of differentially ChARs, A1-5, are shown as box plots (median ±%75th for the box and ±%25th for the whiskers) plotted as a function of averaged Z-scored values. The number of regions within each cluster are shown. (B) Peak tracks at the Bcl6 and Prdm1 loci from the indicated groups; CD4+ naïve and activated are from (GEO: GSE37074). ChARs from a given cluster are highlighted with a downward facing arrowhead and the parental cluster. Peaks with no arrows are not differentially accessible. (C) Heat map depicting the enrichment ratio (Log2) of given Irf4 DNA binding motifs (x-axis) in clusters A1-5 (y-axis); inset text represents the enrichment p-value (Fisher’s Exact Test). (D) Binding saturation curves of Irf4 to the AICE or ISRE motifs. Binding reactions using the AICE probe derived from Bcl11b were carried out in the presence of a constant amount of BATF and JunB containing nuclear extracts. Irf4 containing nuclear extract was increased in 2-fold increments as indicated. The ISRE probe from Prdm1 was used in binding reactions with Irf4 containing nuclear extracts as for the AICE reaction. Nuclear extracts containing a DNA-binding deficient Irf4 (R98A, C99A) were used at the highest concentration of the wild type Irf4 saturation curve as a specificity control. Arrows indicate complexes; AP-1 (blue), Irf4/AP-1 (red), and Irf4 homodimer (green); asterisk indicates non-specific binding. Densitometry analysis is shown to the right of the gel. Representative of two experiments performed. E) Heat map depicting the enrichment ratio of gene members from RNA clusters R1-6 (x-axis) in ChARs A1-5 (y-axis); inset text represents the enrichment p-value (Fisher’s Exact Test). See also Figure S7 and Tables S1–7.
We next searched for Irf4 binding sequence motifs using position weight matrices representing the ISRE element and two versions of the AICE element, Fig. S7B, identified from our and others Irf4 ChIP-seq experiments (Ciofani et al., 2012; Glasmacher et al., 2012; Li et al., 2012; Ochiai et al., 2013). The two AICE elements differ with respect to the AP-1 portion of the AICE, intact or partial; the latter representing a relatively weaker-bound element that is stabilized with greater amounts of Irf4 (Glasmacher et al., 2012). Searching within all ChARs, we identified 49,231, 14,800, and 22,990 hits for the ISRE, intact AICE, and partial AICE Irf4 binding sequence motifs, respectively.
To corroborate the presence of an Irf4 binding sequence motif with functional Irf4 binding, we performed two experiments. First, we compared those ChARs harboring a motif with Irf4 ChIP-seq data (Ciofani et al., 2012) (GEO: GSE40918) of in vitro generated Th17 cells and found that an Irf4 ChIP-seq signal was found in 30%, 21%, and 15% of ChARs that contained an intact AICE, partial AICE, or ISRE motif, respectively, Table S6. Second, within our ATAC-seq data, we performed “footprint” analyses by analyzing the number of sequence read start positions around the Irf4 binding sequence motifs compared to that of surrounding sequences within that ChAR (Buenrostro et al., 2013). A positive “footprint” indicates depletion of reads starting within the motif but not in the surrounding sequence due to protection from transposase integration by bound transcription factors; bumps in the depleted region are thought to reveal “exposed” nucleotide residues. We observed significant depletion of sequence reads in the region spanning the intact AICE, partial AICE and ISRE motifs (Fig. S7C) supporting the presence of putative Irf4 complexes at many of these genomic locations. We note, however, that the results were confounded by the presence of “footprints” in Irf4−/− samples that we cannot exclude to be due to the presence of IRF8 in these cells which exhibits similar sequence specificity and complex formation (Glasmacher et al., 2012). Of note, performing footprint analysis on the Rorc motif, bound by Rorγt that is not expressed in these cells, revealed negligible sequence depletion. Together, our ChAR-restricted motif search is identifying many candidate regions that display properties of being bound by Irf4 laying the groundwork for functional annotation of these regions.
The divergent Irf4 binding sequence motifs appeared in each of the 5 accessibility clusters to different degrees suggesting a functional relationship. We calculated cluster-specific enrichment of each motif by calculating the fraction of ChARs in a cluster that displayed a motif versus that fraction in all ChARs; a positive value indicates enrichment and a negative score indicates depletion. Remarkably, the ISRE and partial AICE motifs were enriched in clusters A4 and A5, those that displayed greatest accessibility in the presence of high levels of Irf4, Fig. 7C. In contrast, the A2 cluster, which showed greatest accessibility with intermediate amounts of Irf4, exhibited substantial enrichment for the intact AICE motif, but not that of ISRE or partial AICE. Interestingly, the intact AICE element was also highly enriched in the A5 cluster. Deeper analysis revealed that the majority of these latter AICE motifs were co-embedded in half of the ~5000 ISRE motif-associating ChARs in this cluster. The generic STAT motif was enriched and depleted among the same clusters as the ISRE and partial AICE, suggesting that the STAT proteins collaborate with these complexes. In contrast the Rorc motif, bound by Rorγt, was differentially enriched to a limited degree. Overall, this analysis suggests that the distribution of divergent Irf4 binding motifs within ChARs differentially partitions to regions that display differing dependencies on Irf4 expression levels.
ISRE sequence motifs were enriched in chromatin that exhibited greater accessibility upon increased Irf4 concentrations raising the possibility that Irf4 was recruited to these sites in a concentration-dependent manner. Thus, we compared the relative binding efficiency of Irf4 to the ISRE with that to the intact AICE which was enriched in ChARs that exhibited greatest accessibility with intermediate amounts of Irf4. Nuclear extracts containing BATF, JunB, and Irf4 were prepared from transiently transfected 293T cells and used in electromobility shift assays with a canonical AICE probe (Glasmacher et al., 2012) and the ISRE probe found in Prdm1 (Ochiai et al., 2013). As expected, the BATF-containing AP-1 complex bound the AICE probe in the absence of Irf4 whereas Irf4 failed to bind the AICE probe in the absence of AP-1, Fig. 7D. Also, as expected, extracts containing both Irf4 and AP-1 formed a slower-migrating complex than that of AP-1 alone. This complex became more prominent with increasing amounts of Irf4-containing extracts. In contrast, the binding efficiency of Irf4 to the ISRE probe was markedly reduced (~5 fold, Fig. 7D) throughout the same Irf4 extract titration. Indeed, extracts containing a mutant of IRF4 (R98A, C99A) that fails to bind DNA did not form a quartenary complex on the AICE probe or a homodimeric complex on the ISRE probe. Thus, IRF4, as homodimer, innately binds the ISRE sequence inefficiently suggesting that it is recruited to ISRE sequences predominantly when expressed at high amounts. Whether post-translational modifications of IRF4 or other unknown binding partners, not recapitulated in the in vitro binding experiments, enable more efficient binding to ISRE sequences in vivo is not presently known.
Given the Irf4-dose dependent correlations with functional changes in ChARs and differential enrichment of divergent Irf4 binding motifs, we next sought to correlate these annotated ChARs with changes in gene expression. For this analysis, we examined the gene expression patterns (clusters R1-6 in Fig. 5B) of genes that were encompassed within 50kb of each ChAR. By comparing those gene expression patterns to genome-wide expression patterns, i.e. not specific to a ChAR cluster, we could then measure the enrichment and statistical significance of those genes’ expression patterns to given ChARs. This allows us to assign a presumptive Irf4-dependent regulatory role for a given ChAR to an Irf4-dependent differentially expressed gene. The results of this analysis are displayed in a heat map that plots ChAR clusters A1-5 against differential transcriptome clusters R1-6, Fig. 7E. The results reveal correlations of high significance such that ChARs exhibiting greatest accessibility in the presence of high amounts of Irf4 are enriched for genes, including Prdm1, whose activation is dependent on high amounts of Irf4, e.g. A4 with R6 and A5 with R5. Furthermore, the A4-5 collection of ChARs are depleted of genes whose activation is dependent on low/intermediate amounts of Irf4 expression, e.g. A4-5 with R1-4. In contrast, ChARs preferentially regulated by intermediate amounts of Irf4 expression display enrichment for genes, including Bcl6, whose regulation is dependent on intermediate amounts of Irf4 expression, e.g. A2 with R4. Moreover, the A2-3 collection of ChARs are depleted of genes whose regulation is dependent on high amounts of Irf4 expression, e.g. A2-3 with R5-6. Thus, specific Irf4-dependent changes in accessibility of ChARs associate with genes affiliated with alternate Th cell fate genes.
Discussion
We have demonstrated that concentrations of Irf4, set by TCR signal strength, coordinate Tfh–Teff cell fate trajectories by activating the Bcl6–Blimp-1 counter antagonistic gene regulatory module. Concentrations of Irf4 appear to be important for binding to divergent DNA recognition elements that differ in affinity. Putative high affinity binding sites are aligned with regulation of gene members, including Bcl6, of the Tfh program whereas presumed low affinity binding sites are affiliated with regulation of genes, including Prdm1, of the Teff program. This role of Irf4 precedes that of IL-2 in mediating this cell fate decision. Together, our study demonstrates a bimodal manner in which Irf4 orchestrates Tfh cell fate decisions: Tfh cells arise if intermediate amounts of Irf4 are expressed but not when Irf4 is absent or expressed at high levels. In contrast, Teff cell fate trajectories are linearly related with increasing amounts of Irf4. We propose that, because Irf4 expression levels are constrained by TCR signal strength, this Irf4-based mechanism of alternate Th cell fate choice distributes appropriate TCR repertoires required for Tfh and Teff function.
The effects of TCR signal intensity on Th cell fate choice described here are at odds with recent studies that themselves only partially agree. For example, Tubo et al. conclude that increasing TCR signal strength results in increased Tfh cells at the expense of Th1 cells (Tubo et al., 2013). In contrast, Keck et al. conclude that increasing TCR signal strength results in more Th1 as well as Tfh cells (Keck et al., 2014). In contrast to both Tubo et al. and Keck et al. we observe that increasing TCR signal strength diminishes Tfh cell fate trajectories; however, our results are more similar to Keck et. al. in that Teff cell fates are promoted by increased TCR signal strength. A third study, by Fazilleau et al., concluded that high TCR signal strength was important for Tfh cell fates (Fazilleau et al., 2009); however, this study depended mostly on CXCR5 measurements that did not resolve Tfh and GC-Tfh subsets, the latter of which was mostly affected in our work. Conflicting results between Tubo et al. and Keck et al. and ours may be technical; these two groups use Listeria monocytogenes as the antigen delivery system where the ensuing cytokine milieu may feedback to affect Th cell fate choices set by TCR signal strength. We submit, that the protein in adjuvant system afforded us with the ability to increase the amount of antigen, perhaps to a level where, had the other studies achieved, would have obtained similar results to ours. In addition, we note that Tubo et al. and Keck et al. used the same TCR–APL system (3K). Here we use a distinct TCR–APL system, 5c.c7. Like us, Fazilleau et al. also use the 5c.c7 TCR-APL system; however, combined with other technical differences, they focused on the pigeon cytochrome c APL which exerts a lower TCR signal strength than that from moth (Krogsgaard et al., 2003). Although various biophysical parameters (e.g. Kd, EC50, Ta(s), etc.) can be matched across TCR–pMHCII systems, our incomplete knowledge of the relevant deterministic parameters of the TCR–pMHCII interaction that confers signal intensity to the resolution of alternate Th cell fate gene programs prevents a direct comparison.
Notwithstanding the differences described above, super-induction of a single TCR-regulated gene using the Irf4-inducible genetic system (thus copying the effects of increased TCR signal strength on elevating Irf4 amounts), demonstrates that under a given dose and potency of cognate pMHCII, responding Th cells will redirect their cell fate trajectories such that they opt for a Teff instead of a Tfh one. This genetic experiment supports our observations that increasing TCR signal strength suppresses Tfh cell fate trajectories in favor of that of Teff. Inhibition of Tfh cell fates by increased Irf4 amounts was observed in the OT-II system, a TCR-pMHC interaction that we propose, based on Irf4 expression patterns, mimics 5c.c7-T102S weak agonist stimulation. We note however, that blunting Tfh cell fates by intense TCR signal strength, e.g. 5c.c7-MCC strong agonist stimulation, was not as penetrant as that observed in the Irf4-inducible experiment. This raises the possibility that additional factors controlled by TCR signal strength function to modulate Irf4, Blimp-1 and/or Bcl6 activity in regulating Th cell fate trajectories.
Combined, our results suggest that, during TCR-mediated alternate Th cell fate choice, the Irf4 locus functions as the “reader” of TCR signal strength and that Irf4 transcriptional activity functions as the “writer” of TCR signal strength by regulating both Tfh and Teff gene programs, including (but not limited to) the Bcl6 and Prdm1 loci. In naïve cells, Irf4 is expressed at low levels; however, following TCR signaling Irf4 expression is immediately induced. Peak expression is observed around 1.5 days after activation which then decays to a new base line level. Because this new baseline is seemingly uniform, independent of initial TCR signal intensity, we suggest that secondary mechanisms come in to play to stabilize the resultant Th cell program initially set by Irf4, such as IL-2 (see below). Using the orthogonal genetic system, based on the Irf4-inducible allele, we showed that limiting the enhanced amplitude of Irf4 expression (with transient DOX treatment) to the earliest stages of T cell activation was sufficient to redirect Tfh cell fate trajectories to that of Teff. This suggests that Irf4 coordinates Th cell specification early, consistent with earlier reports that show that IL2rα expressing cells at days 2–3 of T cell activation express Blimp-1 and display a Teff destiny (Choi et al., 2011). Of note, this “writer” activity of high cellular concentrations of Irf4 is not mediated by increased IL-2 signaling suggesting, rather, that IL-2 stabilizes Teff cell fate choice initiated by Irf4-driven Blimp-1 expression. Because Irf4 appears to target and activate the expression of both Prdm1 and Il2ra, we propose that high levels of Irf4 “writes” Teff cell fate in sequence: i) both Prdm1 and Il2ra expression are initially activated and ii) IL-2 signaling stabilizes the Teff gene program as well as Blimp-1 expression. Whether IL-2 signals regulate Irf4 expression levels is currently being investigated.
To gain insight into how Irf4 engages the genome, we identified Irf4 concentration-dependent changes in ChARs in differentiating Th cells in vivo and linked those regions to differential gene regulation and putative Irf4 binding sites. Such ChARs delimit promoters and enhancers involved in gene regulation (Buenrostro et al., 2013). One third of the ~96,000 ChARs identified in activated Th cells displayed Irf4 dose-dependent changes in accessibility suggesting that Irf4 plays a prominent role in staging the genomic regulatory landscape during Tfh–Teff cell fate decisions. Remarkably, within these dynamic ChARs, we found that those chromatin regions that were most accessible when Irf4 amounts were intermediate uniquely harbored high affinity AICE motifs. In contrast, the relatively lower affinity ISRE motif was enriched in ChARs that were most accessible when Irf4 concentrations were highest. Thus, the dynamic subsets of ChARs exhibit unequal placement of the presumed high and low affinity Irf4 binding sites. Moreover, the subset of ChARS that was most accessible with intermediate amounts of Irf4 and that harbored putative high affinity AICE binding sites was enriched for regulated genes of the Tfh program. In contrast, regulated Teff genes were enriched among ChARs that enlarged upon increased amounts of Irf4 and that harbored ostensible low affinity ISRE binding sites. Interestingly, a subset of Teff ChARs harbored intact AICE, partial AICE and ISRE motifs suggesting a dynamic interplay between the Irf4-dependent complexes that assemble on these elements. We speculate that as Irf4 levels rise, such regulatory elements may be primed by occupation of intact AICE sequences. At maximal Irf4 levels, recruitment of Irf4 to ISRE and partial-AICE may dominate. It has been shown that the partial AICE motif inefficiently recruits the AP-1 complex unless high levels of Irf4 are present suggesting a scenario whereby stabilization of the Irf4-AP-1 complex on partial AICE sequences depends on high levels of Irf4 (Glasmacher et al., 2012). Although the motif search that we performed may over-estimate putative Irf4-bound regions, congruous relationships were observed between motif, gene expression patterns, Irf4 dose, and the observed Th cell biology that we document. In support, our analysis of chromatin-bound Irf4 involved in B cell fate decisions also showed favored binding to high affinity EICE and AICE sites when Irf4 is expressed at low amounts and to low affinity ISRE sites when Irf4 is expressed at increased amounts (Ochiai et al., 2013). Furthermore, those divergent sites partition to genes important for the GC B cell state or the plasma cell state. Mechanistically, our findings predict a molecular framework for conceptualizing how TCR-regulated Irf4 amounts results in changes in gene expression important for alternate Th cell fate trajectories by the formation of distinct biochemical modes of Irf4 activity.
Linkage between TCR signal strength with the concentration-dependent “writer” activity of Irf4 suggests that Irf4 partitions the TCR repertoire with alternate Th cell fates. Why would Teff cell fate decisions involve higher affinity TCRs? Teff cell activation in peripheral tissues and IFN-γ secretion occurs in bursts which is controlled by cyclical re-activation of PD-1 expression (Honda et al., 2014). Perhaps, higher avidity TCRs would allow these burst to occur at greater frequency or longevity. Why would Tfh cell fate decisions involve lower affinity TCRs? Selection of rare high affinity B cell clones among many clones that do not exhibit high affinity antigen binding during affinity maturation is screened by Tfh cells. High affinity B cell clones present many more copies of pMHCII due to increased antigen capture from follicular dendritic cells that display antigen. In an opinion article, “counting” of pMHCII in the immunological synapse formed between a Tfh and a B cell functions to identify higher affinity B cell clones (Dustin, 2014). Based on our results, we propose that an Irf4-dependent constraint of lower affinity TCRs among Tfh cells would enable greater “counting” sensitivity and efficient affinity maturation.
STAR★Methods
Contact for Reagent and Resource Sharing
Further information and requests for resources and reagents should be directed to and will be fulfilled by the Lead Contact, Roger Sciammas (rsciammas@ucdavis.edu).
Experimental Model and Subject Details
Mice
Irf4−/− and Irf4-inducible mice (Irf4+/+) mice (Mittrucker et al., 1997; Sciammas et al., 2011) were intercrossed extensively to OT-II TCR Tg mice (Rag1−/−) obtained from the NIAID/Taconic Repository (Taconic Farms Inc.) to obtain homozygosity at 3 and 5 loci, respectively. Host mice for adoptive transfer of OT-II T cells, strain B6.SJL-Ptprca Pepcb/BoyJ, congenic for CD45.1, were obtained from The Jackson Laboratory. Host mice for transfer of Irf4-inducible (Irf4+/+) OT-II TCR transgenic CD4 cells were created in house by crossing B6.SJL-Ptprca Pepcb/BoyJ with Rosa26M2rtTA/M2rtTA mice; this was done to prevent neo-antigen mediated rejection of donor cells (Ochiai et al., 2013). MCC-specific (Line4094) 5c.c7 TCR Tg mice (Rag2−/−) were obtained from the NIAID/Taconic Repository (Taconic Farms Inc.). Host mice for adoptive transfer of 5c.c7 T cells, Line 31; B10.A-Cd45a(Ly5a)/Nai N5, were obtained from the NIAID/Taconic Repository (Taconic Farms Inc.). Tcrβ−/−δ−/− mice were obtained from The Jackson Laboratory.
All animal experiments were performed in AAALAC-accredited animal housing facilities and in accordance of the Institutional Animal Care and Use Committee guidelines of TMHRI and UC Davis. All mice were housed in groups of 2–5 animals per cage in specific pathogen-free facilities at the TMHRI and UC Davis. Both male and female mice of 8–16 weeks old were used in all experiments and all experiments involved 3–5 mice per group.
Cells
P13 cells (Yamane et al., 2005), L cell fibroblasts engineered to express I-Ek, B7-1, and ICAM were used for 5c.c7 TCR CD4+ stimulations. P13 cells were a generous gift of Ron Germain (NIAID).
Method Details
RFP antigens
Several DNA constructs were synthesized by Blue Heron Biotech (Bothell, WA) that comprised of E. coli codon optimized sequences encoding dsRED2 fused at the 3′ end with the indicated T cell epitopes followed by hexahistidine. Constructs were cloned into pET42 (Novagen) and BL21 Rosetta (DE3) cells (Promega; Madison, WI) were used for protein production. Expression was induced with IPTG overnight at 14C. Lysis entailed several freeze thaw cycles prior to mixing with Ni-NTA agarose beads (Qiagen). Following elution, protein was subjected to endotoxin removal using SM beads and Triton X-114 extractions (Aida and Pabst, 1990); after this procedure, purified protein was found to contain ≤1 EU endotoxin.
Adoptive transfer of TCR Tg cells and immunizations
CD4+ TCR transgenic cells from lymph nodes of donor mice were quantitated by measuring the frequency of CD4+Vβ5+ cells for OT-II TCR transgenic cells or CD4+ cells for 5c.c7 TCR transgenic cells. For experiments where the phenotype or function of TCR Tg cells were recorded at day 5 or day 7 after immunization, 105 cells were adoptively transferred. For experiments where Irf4 levels or TCR Tg phenotypes were measured at day 1.5 or day 3 following immunization, 5x10⁵ cells were adoptively transferred. For experiments where cells were sorted for transcriptome or chromatin accessibility analyses at day 3 following immunization, 5x10⁵ cells were adoptively transferred. For all transfers involving Irf4-inducible OT-II cells, donor cells were enriched by negative selection involving a cocktail of biotinylated antibodies (CD8, CD11b, GR-1, DX5, B220, CD19, IgM, CD25, CD44) followed by anti-biotin magnetic beads (Miltenyi) and magnetic separation; cells were typically ≥90% CD4+ after the procedure. Indicated numbers of cells were transferred into the indicated hosts by retro-orbital injections and mice were immunized the next day with the indicated type and dose of antigen at the base of tail. Antigen was emulsified in Complete Freund’s Adjuvant (Sigma-Aldrich). For some experiments, donor cells were labeled with 1uM CFSE prior to transfer. Experiments involving IL-2 neutralization were carried out with daily i.p. injections 250ug each of anti-IL-2 mAb clones S4B6 and JES6-1A12 (Bio X Cell). Control groups received 500ug of anti-TNP mAb clone 2A3 (Bio X Cell). Injections started the day of adoptive transfer of donor CD4+ cells.
In vitro T cell stimulations and media
CD4+ TCR transgenic cells were obtained from lymph nodes and quantitated by measuring the frequency of CD4+ cells from 5c.c7 TCR transgenic mice (Rag2−/−). These cells were plated in a 3:1 ratio with P13 cells (Yamane et al., 2005), L cell fibroblasts engineered to express I-Ek, B7-1, and ICAM in the presence of peptide. All primary T cells isolated from mice were cultured in RPMI medium with 10% (vol/vol) FCS, 2 mM glutamine, 100 IU/mL of penicillin, 0.1 mg/mL, of streptomycin and 20 mM HEPES buffer, pH 7.2–7.5 (all from Invitrogen), 1 mM sodium pyruvate, nonessential amino acids (gibco), and 2 μM β-mercaptoethanol (Invitrogen).
Flow cytometry analysis and sorting
Lymph node cells were analyzed using an LSR II or Fortessa instrument (BD) and FlowJo software (Tree Star, Inc.). Typically, RBC-depleted spleen cell suspensions were prepared and washed with isotonic buffer (Yenson and Baumgarth, 2014). Cell suspensions were stained with antibodies listed in Key Resources Table. For sorting, donor OT-II cells were sorted on the FACSAria (BD). Detection of Irf4, Bcl6, and TBET was performed by fixing and permeabilizing cells with Fix/Perm staining kit (eBioscience). CD45.1−B220−MHCII−CD45.2+CD4+ donor cells were measured for IFNγ and IL-2 cytokine expression after stimulation with PMA/Ionomycin for 6 hours in the presence of monensin and brefeldinA. Statistical analyses using non-parametric unpaired t-tests were performed with Prism.
KEY RESOURCES TABLE.
| REAGENT or RESOURCE | SOURCE | IDENTIFIER |
|---|---|---|
| Antibodies | ||
| Irf4 | Santa Cruz Biotech | goat polyclonal; purified |
| Goat IgG | Jackson ImmunoResearch | donkey polyclonal; biotin |
| CXCR5 | BD Biosciences | 2G8; Purified |
| CXCR5 | BD Biosciences | 2G8; PECF594 |
| CD45.2 | Biolegend | 104; FITC |
| CD45.1 | Biolegend | A20; APC-Cy7 |
| B220 | Biolegend | RA3-6B2; APC-Cy7 |
| IA-IE (MHCII) | Biolegend | M5/114.15.2; APC-Cy7 |
| CD4 | Biolegend | RM4-5; APC |
| CD4 | BD Biosciences | RM4-5; PECy7 |
| PD-1 | eBiosciences | J43; PECy7 |
| GL-7 | BD Biosciences | GL7; PE |
| GL-7 | Biolegend | GL7; FITC |
| Bcl6 | BD Biosciences | K112-91; PE |
| TBET | Biolegend | 4B10; APC |
| TNFa | BD Biosciences | MP6-XT22; BV421 |
| IFNg | BD Biosciences | XMG1.2; APC |
| IL-2 | BD Biosciences | JES6-5H4; PE |
| CD3 | Biolegend | 145-2c11; Pacific Blue |
| GR-1 | Biolegend | RB6-8C5; Pacific Blue |
| Activated Caspase 3 | BD Biosciences | rabbit polyclonal; PE |
| TCRVβ5.1/2 | Biolegend | MR9-4; PE |
| IgD | Biolegend | 11-26c.2a; PerCPCy5.5 |
| Fas | BD Biosciences | JO2; PE Cy7 |
| IgG1 | BD Biosciences | X56; APC |
| IgG | Jackson ImmunoResearch | polyclonal, Alkaline Phosphatase |
| IL-2 | Bio X Cell | S4B6; Purified |
| IL-2 | Bio X Cell | JES6-1A12; Purified |
| TNP (control for IL-2) | Bio X Cell | 2A3; Purified |
| HEL48-62/I-Ak pMHCII | in house | Aw3.19; APC |
| CD8α | BD Biosciences | 53-6.7; biotin |
| GR-1 | BD Biosciences | RB6-8C5; biotin |
| CD11b | BD Biosciences | M1/70; biotin |
| CD25 | BD Biosciences | 7D4; biotin |
| CD44 | BD Biosciences | IM7; biotin |
| CD49b | BD Biosciences | DX7; biotin |
| B220 | BD Biosciences | RA3-6B2; biotin |
| CD19 | BD Biosciences | 1D3; biotin |
| IgM | BD Biosciences | II/41; biotin |
| CD25 | Biolegend | PC61; BV786 |
| CD44 | Biolegend | IM7; AF700 |
| CTLA-4 | Biolegend | UC10-4B9; PE |
| CD28 | Biolegend | 37.51; PerCP-Cy5.5 |
| ICOS | Biolegend | c398.4a; PE-Cy7 |
| CD11c | Biolegend | N418; PE-Cy7 |
| CD11b | Biolegend | M1/70; APC-Cy7 |
| Chemicals, Peptides, and Recombinant Proteins | ||
| peptide - MCC | Anaspec | AS-60204-1 |
| peptide - T102S | Anaspec | custom synthesis |
| peptide - K5 | Anaspec | custom synthesis |
| peptide - RFP-MCC | This paper | N/A |
| peptide - RFP-T102S | This paper | N/A |
| peptide - RFP-OVA | This paper | N/A |
| PMA hydrochloride solution | SIGMA | P-050-1mL |
| Ionomycin calcium salt from Streptomyces conglobatus | SIGMA | I0634-1MG |
| Nickel-NTA beads | Qiagen | 30230 |
| Biobeads SM-2 | Biorad | 152-3920 |
| TritonX-114 | Sigma | X114 |
| Critical Commercial Assays | ||
| RNeasy Micro Kit | Qiagen | 74004 |
| Fugene6 Transfection Reagent | Promega | E2691 |
| Intracellular Fixation & Permeabilization Buffer Set | eBioscience | 88-8824-00 |
| Kapa Stranded RNA-seq Kit | Kapa Biosystems | KK8420 |
| RNA pico bioanalyzer | Agilent | 5067-1513 |
| DNA bioanalyzer HS | Agilent | 5067-4626 |
| Qubit dsDNA HS (High Sensitivity) Assay Kit | Thermo Fisher Scientific | Q32854 |
| Qubit® RNA HS Assay Kit | Thermo Fisher Scientific | Q32855 |
| Kapa library Quant Kit | Kapa Biosystems | KK4824 |
| Nextera DNA Library Prep Kit | Illumina | FC-121-1030 |
| Nextera Index Kit (24 indexes, 96 samples) | Illumina | FC-121-1011 |
| Deposited Data | ||
| RNA-seq and ATAC-seq | This paper | GEO: GSE92272 |
| ChIP-seq | Ciofani et al., 2012 | GEO: GSE40918 |
| RNA-seq | Choi et al., 2013 | GEO: GSM1645004-7 |
| DNaseI-seq | mouse ENCODE | GEO: GSE37074 |
| Recombinant DNA | ||
| Plasmid: pET42 backbone expressing RFP-MCC | This paper | N/A |
| Plasmid: pET42 backbone expressing RFP-T102S | This paper | N/A |
| Plasmid: pET42 backbone expressing RFP-OVA | This paper | N/A |
| Plasmid: pMIG backbone expressing Irf4 | Sciammas et al., 2006 | N/A |
| Plasmid: pMIG backbone expressing Irf4 R98A, C99A double mutant | Sciammas et al., 2006 | N/A |
| Plasmid: pMIG backbone expressing JunB | Addgene | Plasmid #40349 |
| Plasmid: pcDNA3 backbone expressing Batf | Addgene | Plasmid #34575 |
| Primers for mRNA expression, see Methods | This paper | N/A |
| Primers for EMSA, see Methods | This paper | N/A |
| Experimental Models: Cell LInes | ||
| Mammalian: P13 | Yamane et al., 2005 | N/A |
| Bacterial: BL21 Rosetta (DE3) | Promega | L1191 |
| Bacterial: NEB® 5-alpha | New England Biolabs | C2988J |
| Experimental Models: Organisms/Strains | ||
| Mouse: B6.129P2-Irf4tm1Mak/Cnbc | Mittrucker et al., 1997 | N/A |
| Mouse: Gt(ROSA)26Sortm1(rtTA*M2)Jae Col1a1tetO-Irf4 | Sciammas et al., 2011 | N/A |
| Mouse: B6.129S7-Rag1tm1Mom Tg(TcraTcrb)425Cbn | Taconic Farms Inc. | 4234 |
| Mouse: B6.129S7-Rag1tm1Mom Tg(TcraTcrb)425Cbn B6.129P2-Irf4tm1Mak/Cnbc | This Paper | N/A |
| Mouse: B6.129S7-Rag1tm1Mom Tg(TcraTcrb)425Cbn Gt(ROSA)26Sortm1(rtTA*M2)JaeCol1a1tetO-Irf4 | This Paper | N/A |
| Mouse: B6.SJL-Ptprca Pepcb/BoyJ | The Jackson Laboratory | 2014 |
| Mouse: B6.SJL-Ptprca Pepcb/BoyJ Gt(ROSA)26Sortm1(rtTA*M2)Jae | Ochiai et al., 2013 | N/A |
| Mouse: B10.A-Rag2tm1Fwa H2-T18a Tg (Tcra5CC7,Tcrb5CC7)lwep (Line4094) | Taconic Farms Inc. | 4094 |
| Mouse: B6.129S7-Rag1tm1Mom Tg(TcraTcrb)425Cbn | Taconic Farms Inc. | 4234 |
| Mouse: B10.A-Cd45a(Ly5a)/Nai N5 (Line31) | NIAID/Taconic Repository (Taconic Farms Inc.) | 31 |
| Mouse: B6.129P2-Tcrbtm1Mom Tcrdtm1Mom/J | The Jackson Laboratory | 2122 |
| Software and Algorithms | ||
| FlowJo Software | TreeStar | N/A |
| GraphPad Prism 6 | GraphPad Software | N/A |
| STAR aligner | Dobin et al., 2013 | https://github.com/alexdobin/STAR |
| featureCounts | Liao et al., 2014 | http://subread.sourceforge.net |
| edgeR | McCarthy et al.,2012; Robinson et al., 2010 | https://bioconductor.org/packages/release/bioc/html/edgeR.html |
| bowtie | Langmead et al., 2009 | http://bowtie-bio.sourceforge.net |
| BWA MEM | Li and Durbin, 2010 | http://bio-bwa.sourceforge.net/bwa.shtml |
| Picard MarkDuplicates | Wysocker et al., 2013 | https://broadinstitute.github.io/picard/ |
| Macs2 | Zhang et al., 2008 | https://github.com/taoliu/MACS |
| bedtools genomecov | Quinlan and Hall, 2010 | http://bedtools.readthedocs.io/en/latest/ |
| bedGraphToBigWig | Kent et al., 2010 | http://hgdownload.soe.ucsc.edu/admin/exe/ |
| bedtools merge | Quinlan et al., 2014 | http://bedtools.readthedocs.io/en/latest/ |
| K-means clustering in R | Forgy, 1965; Hartigan and Wong, 1979 | https://stat.ethz.ch/R-manual/R-devel/library/stats/html/kmeans.html |
| bigWigAverageOverBed | Kent et al., 2010 | http://hgdownload.soe.ucsc.edu/admin/exe/ |
| FIMO | Bailey et al., 2009 | http://meme-suite.org |
ELISA
RFP-specific serum IgG was detected using a sandwich ELISA with 96 well plates coated with RFP-OVA and detected with anti-mouse IgG Alkaline-Phosphatase conjugated antibodies. Relative titer was calculated by determining the dilution that resulted in half-maximal absorbance.
RNA-seq and ATAC-seq libraries and RT-qPCR
Cells for transcriptome analysis and ATAC-seq analysis comprised of day three immunized and then sorted CD45.1−B220−MHCII−CD45.2+CD4+ OT-II TCR transgenic cells (Rag1−/−) of either the Irf4+/+, Irf4−/−, and Irf4-inducible (Irf4+/+) + DOX groups. Three to five biological replicates, comprised of pooled cells from multiple mice, were processed for each group.
For transcriptome analysis, total RNA was prepared using RNEasy micro kit (Qiagen) and analyzed on RNA pico bioanalyzer chips (Agilent) prior to library construction. Strand-specific RNA-seq libraries were generated for each sample from 100 ng of total RNA using the Kapa Stranded RNA-seq kit (Kapa Biosystems, Cape Town, South Africa) after poly-A enrichment according to the instructions of the manufacturer. The consistent fragment lengths of the sequencing libraries were ascertained using a Bioanalyzer 2100 micro-capillary gel electrophoresis instrument (Agilent, Santa Clara, CA). The barcoded libraries were quantified by fluorometry on a Qubit instrument (LifeTechnologies, Carlsbad, CA), and pooled in equimolar ratios. The pool was quantified by qPCR with a Kapa Library Quant kit (Kapa Biosystems) and sequenced on one lane of an Illumina HiSeq 4000 sequencer (Illumina, San Diego, CA) run with single-end 90 bp reads. ATAC-seq libraries were constructed using the Nexterra kit (Illumina) and then subjected to 8 rounds of amplification with index-specific primers. The ATAC-seq libraries were quantified by both Bioanalyzer and Qubit measurements and pooled in equimolar ratios. They were sequenced on an Illumina HiSeq 4000 sequencer with paired-end 100bp reads on 6 lanes.
For RT-qPCR analysis, total RNA was prepared by sorting 5,000 cells from adoptively transferred mice directly into RLT buffer from the RNeasy Micro Kit (Qiagen). Alternatively, for in vitro Irf4 transcript measurements, RNA was isolated from wells containing a co-culture of 5c.c7 TCR Tg and P13 cells using RLT and RNA was isolated using the manufacturer’s recommendations and cDNA was prepared using SuperScript II (Invitrogen). For ex vivo measurement, 500 cell equivalents were used for each SYBR green based qPCR analysis using 2X master mix (Clontech) whereas for the in vitro measurements, 1uL of the cDNA reaction was used. Each primer pair was analyzed in duplicate reactions. Oct1 transcript measurements were used to normalize expression levels of the other transcripts and fold change calculated using a standard curve or 2−δδCT. Oligos for Prdm1 detection include forward 5′-CCCTCTGAAGAAACAGAATG-3′ and reverse 5′-GCTTGTGCTGCTAAATCTCT-3′; Tbx21 detection include forward 5′-AGGTGTCTGGGAAGCTGAGA-3′ and reverse 5′-CCACATCCACAAACATCCTG-3′; Irf4 detection include forward 5′-AGATTCCAGGTGACTCTGTG-3′ and reverse 5′-CTGCCCTGTCAGAGTATTTC-3′; and Oct1 detection include forward 5′-AGAAGTGGCTAAATGATGC-3′ and reverse 5′-CATATTGAGCTGTTCAGCAA-3′.
Electromobility Shift Assay
Nuclear extracts were prepared from 293T HEK cells (ATCC) that were transiently transfected with expression vectors encoding BATF, JunB (Addgene), or Irf4 (Ochiai et al., 2013). Extracts were incubated with FAM-labeled DNA probes (IDT) to form protein–DNA complexes, reactions were separated on non-denaturing PAGE and the fluorescent signal was imaged using a Typhoon Scanner (GE Healthcare). Optical density of indicated bands were calculated using Image J software (http://imagej.nih.gov/ij/). ISRE (Blimp-1 CNS9) duplexes were formed with 5′-(FAM)-CAACTGAAACCGAGAAAGC-3′and 5′-(FAM)-GCTTTCTCGGTTTCAGTTG-3′. AICE (Bcl11b) duplexes were formed with 5′-(FAM)-TAGTGCAGAAATGAGTCAGAGATCAAAGAAG-3′ and 5′-(FAM)-CTTCTTTGATCTCTGACTCATTTCTGCACTA-3′.
Quantification and Statistical Analysis
Cellular analyses
Statistical significance was performed with Prism software (Graphpad) using the parametric unpaired T-test.
RNA-seq processing
Raw reads were mapped to reference genome mm9 using the STAR aligner (Dobin et al., 2013). Expression was quantified as raw counts against Refseq gene annotations using featureCounts (Liao et al., 2014). We computed differential expression statistics using edgeR (McCarthy et al., 2012; Robinson et al., 2010), both multi-group statistics across Irf4+/+, Irf4−/−, and Irf4-inducible (Irf4+/+) + DOX mice using the generalized linear model framework, as well as pair-wise comparisons between each of these conditions with the exact test. FDR corrected p-values were computed in both cases to account for multiple testing. Normalized expression levels are reported as counts-per-million (CPM).
For transcriptome comparisons to LCMV-specific Tfh and Th1 cells, raw data was obtained from GEO study GSE67334. Data for these reads was mapped to a colorspace-indexed reference mm9 genome with bowtie (Langmead et al., 2009), and reads were quantified against the mm9 gene features used for our RNA-seq data with featureCounts (Liao et al., 2014), and normalized to counts-per-million (CPM). These values were used in conjunction with our RNA-seq data, whether as comparisons of normalized or z-scored expression levels.
ATAC-seq processing
Raw reads were mapped to reference genome mm9 using BWA MEM (Li and Durbin, 2010), and apparent PCR duplicates were removed using Picard MarkDuplicates (Wysocker et al., 2013). Read alignment positions were adjusted to account for the transposase binding motif: alignments to the + strand were adjusted by +4 bp, and reads on the – strand by -5bp. Open chromatin peak calls were called using Macs2 (Zhang et al., 2008) with a q-value threshold of 1e-5 and --nomodel selected.
Bedgraph tracks quantifying open chromatin were created using bedtools genomecov (Quinlan and Hall, 2010) on the adjusted alignments, followed by conversion to bigWig using UCSC tool bedGraphToBigWig (Kent et al., 2010). Open chromatin enrichment tracks were normalized to counts per billion bases, based on the sum of read lengths in the library. BigWig profiles of adjusted alignment start positions were also created by after first truncating reads to the first base for alignments on the + strand, or the last base for alignments on the – strand; these tracks were used for footprinting, and were normalized to counts per million reads. We also computed averaged open chromatin and start position tracks over all biological replicates in each condition.
To quantify ATAC enrichment and perform differential enrichment analysis, a union of peak calls from all ATAC-seq samples was created using bedtools merge (Quinlan, 2014). Enrichment was quantified as raw counts against this annotation of merged peak calls using featureCounts (Liao et al., 2014). We computed differential expression statistics in the same manner as for RNA-seq above, with one exception: using principle component analysis (not shown), we noticed a batch effect among the ATAC samples that separated the samples into three batches, correlated with their processing dates (Table S3: file “ATAC batch designations”). We controlled for the batch effect in the edgeR processing by including the batch as a factor in the differential enrichment analysis and using removeBatchEffect to subtract it from the log-scaled normalized enrichment levels.
Clustering analysis
Clustering analysis was performed identically for both RNA-seq and ATAC-seq data. First, genes or peaks were filtered based on a FDR <0.1 cutoff in the multi-group test between Irf4+/+, Irf4−/−, and Irf4-inducible conditions to retain only those features that showed a differential effect in at least one condition. Second, differential profiles were computed for each gene or peak as the product of the log2 fold-change and the –log10 FDR for each pairwise comparison, over 3 pairwise comparisons (Irf4+/+ vs Irf4−/−, Irf4+/+ vs Irf4-inducible (Irf4+/+) + DOX, and Irf4−/− vs Irf4-inducible (Irf4+/+) + DOX).
These differential profiles were repeatedly clustered using k-means clustering in R (kmeans function) (Forgy, 1965; Hartigan and Wong, 1979): the number of clusters (K) was varied from 2 to 20, and 10 clustering runs with different random initializations were performed for each K, with the initialization for each clustering run chosen from 10 starts (nstart=10 in the kmeans function).
To assess which value of K best described the true number of patterns in the data, pairwise differences between each of the 10 repeated clustering runs were computed for each K as (C1 + C2 – 2*S)/T, where C1 and C2 are the number of co-clustered feature pairs in the first and second clustering runs, S is the number of co-clustered feature pairs in both clustering runs, and T is the total number of clustering pairs. These differences are averaged over all pairs of clustering runs for a given K, and the largest K for which the average difference was smaller than 1e-5 was chosen as the number of clusters that can generate reproducible clusters at the maximum granularity. For RNA data this was K=6, and for ATAC data it was K=5.
Visualizations of gene expression or peak enrichment patterns for each cluster were generated from Z-scored log-scaled CPM values and plotted as boxplots using the boxplot function in R.
Comparison to DNaseI-seq data sets
BigWig enrichment tracks for DNase data sets were downloaded from gene expression omnibus (GEO: GSE37074; ID 5895 and 5896) compared to our open chromatin track averaged over all WT samples. We quantified the average enrichment levels in each of the ~90,000 union peak calls obtained over all ATAC-seq samples using UCSC tool bigWigAverageOverBed (Kent et al., 2010), and plotted the comparisons in a scatterplot.
ATAC-RNA association analysis
To infer associations between ATAC and RNA clusters, we first assigned peaks within 50kb of a gene TSS as putative regulators of that gene. Then we compared the distribution of the number of genes in each gene cluster associated with peaks from each ATAC cluster to the overall distribution of gene clusters. We compared the number of ATAC cluster peak-associated genes in or not in that RNA cluster to the overall number of genes in or not in that RNA cluster, computing the enrichment ratio from these two fractions and the statistical significance from Fisher’s Exact Test. We note that we repeated this analysis at shorter (5kb) and long (200kb) associative ranges (not shown) and observed similar patterns of enrichment, indicating that the regulatory inferences made using this approach are not sensitive to the distance chosen.
Motif analysis
We searched for motif instances across all merged ATAC-seq peak calls using FIMO (Bailey et al., 2009), with a p-value threshold of 1e-4. To determine enrichment of motifs within a given ATAC peak cluster, we compared the fraction of peaks containing a motif in that cluster to the overall fraction of peaks containing a motif, computing enrichment ratios from the ratio of those fractions and p-values from Fisher’s Exact Test. Motif co-enrichment for a pair of motifs was computed by comparing the fraction of peaks containing both motifs to the fraction containing either motif individually, and p-values again computed using Fisher’s Exact Test.
Footprinting analysis
Motif footprints were obtained by extracting the enrichment profile within a 2000bp window centered around each motif position from the bigWig profiles of adjusted start positions, which will specifically highlight the exclusion of transposase binding from TF-occupied chromatin. The profile around each individual motif was normalized using an outlier-insensitive version of the Z-score, subtracting the median and dividing by the interquartile range across the 2000bp window. To preserve the original units of the bigWig profiles, we reversed the Z-scoring using the global statistics across all motif windows, multiplying by the global interquartile range and adding the global median. For each base we then computed the trimmed mean, removing the top and bottom 1%, of the enrichment levels across all motif positions. These values were computed for the averaged bigWig profiles in each condition, and plotted as the motif footprints.
Supplementary Material
Acknowledgments
We are grateful to David Fooksman (Albert Einstein College of Medicine), Michael Kuhns (U of Arizona) and Marcus Clark (U of Chicago) for discussions. We thank Malay Mandal (U of Chicago) for help with ATAC-seq and Laurie Minze (THMRI) for help with retro-orbital injections. The NIAID/Taconic Repository graciously provided mice. We thank the TMHRI and UC Davis flow cytometry facility for cell sorting and the DNA Technologies and Expression Analysis Cores at the UC Davis Genome Center, supported by NIH Shared Instrumentation Grant 1S10OD010786-01. Research was supported by the NCATS grant UL1TR000050 (MMC and NB) and by NIAID grant R01AI113145 (RS).
Footnotes
Author Contributions
VK, SK, SC, JC, EC and RS performed cellular analyses. VK and ES performed molecular analysis. SK developed the RFP-antigen system. MM-C and NB performed the bioinformatics analyses. EC and AC provided important advice with the 5c.c7 adoptive transfer system. RS coordinated the project and wrote the manuscript with input from everyone.
Accession Numbers
Raw and analyzed data reported in this paper are available under accession number GEO: GSE92272. http://www.ncbi.nlm.nih.gov/geo/query/acc.cgi?acc=GSE92272
Supplement contains 7 figures and 7 tables
Publisher's Disclaimer: This is a PDF file of an unedited manuscript that has been accepted for publication. As a service to our customers we are providing this early version of the manuscript. The manuscript will undergo copyediting, typesetting, and review of the resulting proof before it is published in its final citable form. Please note that during the production process errors may be discovered which could affect the content, and all legal disclaimers that apply to the journal pertain.
References
- Aida Y, Pabst MJ. Removal of endotoxin from protein solutions by phase separation using Triton X-114. J Immunol Methods. 1990;132:191–195. doi: 10.1016/0022-1759(90)90029-u. [DOI] [PubMed] [Google Scholar]
- Bailey TL, Boden M, Buske FA, Frith M, Grant CE, Clementi L, Ren J, Li WW, Noble WS. MEME SUITE: tools for motif discovery and searching. Nucleic Acids Res. 2009;37:W202–208. doi: 10.1093/nar/gkp335. [DOI] [PMC free article] [PubMed] [Google Scholar]
- Bollig N, Brustle A, Kellner K, Ackermann W, Abass E, Raifer H, Camara B, Brendel C, Giel G, Bothur E, et al. Transcription factor IRF4 determines germinal center formation through follicular T-helper cell differentiation. Proc Natl Acad Sci U S A. 2012;109:8664–8669. doi: 10.1073/pnas.1205834109. [DOI] [PMC free article] [PubMed] [Google Scholar]
- Buenrostro JD, Giresi PG, Zaba LC, Chang HY, Greenleaf WJ. Transposition of native chromatin for fast and sensitive epigenomic profiling of open chromatin, DNA-binding proteins and nucleosome position. Nat Methods. 2013;10:1213–1218. doi: 10.1038/nmeth.2688. [DOI] [PMC free article] [PubMed] [Google Scholar]
- Choi YS, Gullicksrud JA, Xing S, Zeng Z, Shan Q, Li F, Love PE, Peng W, Xue HH, Crotty S. LEF-1 and TCF-1 orchestrate T(FH) differentiation by regulating differentiation circuits upstream of the transcriptional repressor Bcl6. Nat Immunol. 2015;16:980–990. doi: 10.1038/ni.3226. [DOI] [PMC free article] [PubMed] [Google Scholar]
- Choi YS, Kageyama R, Eto D, Escobar TC, Johnston RJ, Monticelli L, Lao C, Crotty S. ICOS receptor instructs T follicular helper cell versus effector cell differentiation via induction of the transcriptional repressor Bcl6. Immunity. 2011;34:932–946. doi: 10.1016/j.immuni.2011.03.023. [DOI] [PMC free article] [PubMed] [Google Scholar]
- Ciofani M, Madar A, Galan C, Sellars M, Mace K, Pauli F, Agarwal A, Huang W, Parkhurst CN, Muratet M, et al. A validated regulatory network for Th17 cell specification. Cell. 2012;151:289–303. doi: 10.1016/j.cell.2012.09.016. [DOI] [PMC free article] [PubMed] [Google Scholar]
- Corse E, Gottschalk RA, Krogsgaard M, Allison JP. Attenuated T cell responses to a high-potency ligand in vivo. PLoS biology. 2010:8. doi: 10.1371/journal.pbio.1000481. [DOI] [PMC free article] [PubMed] [Google Scholar]
- Cretney E, Xin A, Shi W, Minnich M, Masson F, Miasari M, Belz GT, Smyth GK, Busslinger M, Nutt SL, et al. The transcription factors Blimp-1 and IRF4 jointly control the differentiation and function of effector regulatory T cells. Nat Immunol. 2011;12:304–311. doi: 10.1038/ni.2006. [DOI] [PubMed] [Google Scholar]
- Crotty S, Johnston RJ, Schoenberger SP. Effectors and memories: Bcl-6 and Blimp-1 in T and B lymphocyte differentiation. Nat Immunol. 2010;11:114–120. doi: 10.1038/ni.1837. [DOI] [PMC free article] [PubMed] [Google Scholar]
- Dadaglio G, Nelson CA, Deck MB, Petzold SJ, Unanue ER. Characterization and quantitation of peptide-MHC complexes produced from hen egg lysozyme using a monoclonal antibody. Immunity. 1997;6:727–738. doi: 10.1016/s1074-7613(00)80448-3. [DOI] [PubMed] [Google Scholar]
- Davis MM, Krogsgaard M, Huse M, Huppa J, Lillemeier BF, Li QJ. T cells as a self-referential, sensory organ. Annu Rev Immunol. 2007;25:681–695. doi: 10.1146/annurev.immunol.24.021605.090600. [DOI] [PubMed] [Google Scholar]
- Dobin A, Davis CA, Schlesinger F, Drenkow J, Zaleski C, Jha S, Batut P, Chaisson M, Gingeras TR. STAR: ultrafast universal RNA-seq aligner. Bioinformatics. 2013;29:15–21. doi: 10.1093/bioinformatics/bts635. [DOI] [PMC free article] [PubMed] [Google Scholar]
- Dustin ML. What counts in the immunological synapse? Mol Cell. 2014;54:255–262. doi: 10.1016/j.molcel.2014.04.001. [DOI] [PMC free article] [PubMed] [Google Scholar]
- Fazilleau N, McHeyzer-Williams LJ, Rosen H, McHeyzer-Williams MG. The function of follicular helper T cells is regulated by the strength of T cell antigen receptor binding. Nat Immunol. 2009;10:375–384. doi: 10.1038/ni.1704. [DOI] [PMC free article] [PubMed] [Google Scholar]
- Forgy E. Cluster Analysis of Multivariate Data: Efficiency versus Interpretability of Classification. Biometrics. 1965;21:768–769. [Google Scholar]
- Glasmacher E, Agrawal S, Chang AB, Murphy TL, Zeng W, Vander Lugt B, Khan AA, Ciofani M, Spooner CJ, Rutz S, et al. A genomic regulatory element that directs assembly and function of immune-specific AP-1-IRF complexes. Science. 2012;338:975–980. doi: 10.1126/science.1228309. [DOI] [PMC free article] [PubMed] [Google Scholar]
- Gottschalk RA, Hathorn MM, Beuneu H, Corse E, Dustin ML, Altan-Bonnet G, Allison JP. Distinct influences of peptide-MHC quality and quantity on in vivo T-cell responses. Proc Natl Acad Sci U S A. 2012;109:881–886. doi: 10.1073/pnas.1119763109. [DOI] [PMC free article] [PubMed] [Google Scholar]
- Hartigan JA, Wong MA. A K-means clustering alogrithm. Applied Statistics. 1979;28:100–108. [Google Scholar]
- Honda T, Egen JG, Lammermann T, Kastenmuller W, Torabi-Parizi P, Germain RN. Tuning of antigen sensitivity by T cell receptor-dependent negative feedback controls T cell effector function in inflamed tissues. Immunity. 2014;40:235–247. doi: 10.1016/j.immuni.2013.11.017. [DOI] [PMC free article] [PubMed] [Google Scholar]
- Huber M, Lohoff M. IRF4 at the crossroads of effector T-cell fate decision. Eur J Immunol. 2014;44:1886–1895. doi: 10.1002/eji.201344279. [DOI] [PubMed] [Google Scholar]
- Johnston RJ, Choi YS, Diamond JA, Yang JA, Crotty S. STAT5 is a potent negative regulator of TFH cell differentiation. J Exp Med. 2012;209:243–250. doi: 10.1084/jem.20111174. [DOI] [PMC free article] [PubMed] [Google Scholar]
- Kanno Y, Vahedi G, Hirahara K, Singleton K, O’Shea JJ. Transcriptional and epigenetic control of T helper cell specification: molecular mechanisms underlying commitment and plasticity. Annu Rev Immunol. 2012;30:707–731. doi: 10.1146/annurev-immunol-020711-075058. [DOI] [PMC free article] [PubMed] [Google Scholar]
- Keck S, Schmaler M, Ganter S, Wyss L, Oberle S, Huseby ES, Zehn D, King CG. Antigen affinity and antigen dose exert distinct influences on CD4 T-cell differentiation. Proc Natl Acad Sci U S A. 2014;111:14852–14857. doi: 10.1073/pnas.1403271111. [DOI] [PMC free article] [PubMed] [Google Scholar]
- Kent WJ, Zweig AS, Barber G, Hinrichs AS, Karolchik D. BigWig and BigBed: enabling browsing of large distributed datasets. Bioinformatics. 2010;26:2204–2207. doi: 10.1093/bioinformatics/btq351. [DOI] [PMC free article] [PubMed] [Google Scholar]
- Krogsgaard M, Prado N, Adams EJ, He XL, Chow DC, Wilson DB, Garcia KC, Davis MM. Evidence that structural rearrangements and/or flexibility during TCR binding can contribute to T cell activation. Mol Cell. 2003;12:1367–1378. doi: 10.1016/s1097-2765(03)00474-x. [DOI] [PubMed] [Google Scholar]
- Langmead B, Trapnell C, Pop M, Salzberg SL. Ultrafast and memory-efficient alignment of short DNA sequences to the human genome. Genome Biol. 2009;10:R25. doi: 10.1186/gb-2009-10-3-r25. [DOI] [PMC free article] [PubMed] [Google Scholar]
- Li H, Durbin R. Fast and accurate long-read alignment with Burrows-Wheeler transform. Bioinformatics. 2010;26:589–595. doi: 10.1093/bioinformatics/btp698. [DOI] [PMC free article] [PubMed] [Google Scholar]
- Li J, Lu E, Yi T, Cyster JG. EBI2 augments Tfh cell fate by promoting interaction with IL-2-quenching dendritic cells. Nature. 2016;533:110–114. doi: 10.1038/nature17947. [DOI] [PMC free article] [PubMed] [Google Scholar]
- Li P, Spolski R, Liao W, Wang L, Murphy TL, Murphy KM, Leonard WJ. BATF-JUN is critical for IRF4-mediated transcription in T cells. Nature. 2012;490:543–546. doi: 10.1038/nature11530. [DOI] [PMC free article] [PubMed] [Google Scholar]
- Liao Y, Smyth GK, Shi W. featureCounts: an efficient general purpose program for assigning sequence reads to genomic features. Bioinformatics. 2014;30:923–930. doi: 10.1093/bioinformatics/btt656. [DOI] [PubMed] [Google Scholar]
- Mahnke J, Schumacher V, Ahrens S, Kading N, Feldhoff LM, Huber M, Rupp J, Raczkowski F, Mittrucker HW. Interferon Regulatory Factor 4 controls TH1 cell effector function and metabolism. Sci Rep. 2016;6:35521. doi: 10.1038/srep35521. [DOI] [PMC free article] [PubMed] [Google Scholar]
- Man K, Miasari M, Shi W, Xin A, Henstridge DC, Preston S, Pellegrini M, Belz GT, Smyth GK, Febbraio MA, et al. The transcription factor IRF4 is essential for TCR affinity-mediated metabolic programming and clonal expansion of T cells. Nat Immunol. 2013;14:1155–1165. doi: 10.1038/ni.2710. [DOI] [PubMed] [Google Scholar]
- Matsuyama T, Grossman A, Mittrucker HW, Siderovski DP, Kiefer F, Kawakami T, Richardson CD, Taniguchi T, Yoshinaga SK, Mak TW. Molecular cloning of LSIRF, a lymphoid-specific member of the interferon regulatory factor family that binds the interferon-stimulated response element (ISRE) Nucleic Acids Res. 1995;23:2127–2136. doi: 10.1093/nar/23.12.2127. [DOI] [PMC free article] [PubMed] [Google Scholar]
- McCarthy DJ, Chen Y, Smyth GK. Differential expression analysis of multifactor RNA-Seq experiments with respect to biological variation. Nucleic Acids Res. 2012;40:4288–4297. doi: 10.1093/nar/gks042. [DOI] [PMC free article] [PubMed] [Google Scholar]
- Nayar R, Schutten E, Bautista B, Daniels K, Prince AL, Enos M, Brehm MA, Swain SL, Welsh RM, Berg LJ. Graded levels of IRF4 regulate CD8+ T cell differentiation and expansion, but not attrition, in response to acute virus infection. J Immunol. 2014;192:5881–5893. doi: 10.4049/jimmunol.1303187. [DOI] [PMC free article] [PubMed] [Google Scholar]
- Ochiai K, Maienschein-Cline M, Simonetti G, Chen J, Rosenthal R, Brink R, Chong AS, Klein U, Dinner AR, Singh H, et al. Transcriptional Regulation of Germinal Center B and Plasma Cell Fates by Dynamical Control of IRF4. Immunity. 2013;38:918–929. doi: 10.1016/j.immuni.2013.04.009. [DOI] [PMC free article] [PubMed] [Google Scholar]
- Pedros C, Zhang Y, Hu JK, Choi YS, Canonigo-Balancio AJ, Yates JR, 3rd, Altman A, Crotty S, Kong KF. A TRAF-like motif of the inducible costimulator ICOS controls development of germinal center TFH cells via the kinase TBK1. Nat Immunol. 2016;17:825–833. doi: 10.1038/ni.3463. [DOI] [PMC free article] [PubMed] [Google Scholar]
- Pepper M, Pagan AJ, Igyarto BZ, Taylor JJ, Jenkins MK. Opposing signals from the Bcl6 transcription factor and the interleukin-2 receptor generate T helper 1 central and effector memory cells. Immunity. 2011;35:583–595. doi: 10.1016/j.immuni.2011.09.009. [DOI] [PMC free article] [PubMed] [Google Scholar]
- Qi H. T follicular helper cells in space-time. Nat Rev Immunol. 2016;16:612–625. doi: 10.1038/nri.2016.94. [DOI] [PubMed] [Google Scholar]
- Quinlan AR. BEDTools: The Swiss-Army Tool for Genome Feature Analysis. Curr Protoc Bioinformatics. 2014;47:11 12 11–34. doi: 10.1002/0471250953.bi1112s47. [DOI] [PMC free article] [PubMed] [Google Scholar]
- Quinlan AR, Hall IM. BEDTools: a flexible suite of utilities for comparing genomic features. Bioinformatics (Oxford, England) 2010;26:841–842. doi: 10.1093/bioinformatics/btq033. [DOI] [PMC free article] [PubMed] [Google Scholar]
- Robinson MD, McCarthy DJ, Smyth GK. edgeR: a Bioconductor package for differential expression analysis of digital gene expression data. Bioinformatics. 2010;26:139–140. doi: 10.1093/bioinformatics/btp616. [DOI] [PMC free article] [PubMed] [Google Scholar]
- Sciammas R, Li Y, Warmflash A, Song Y, Dinner AR, Singh H. An incoherent regulatory network architecture that orchestrates B cell diversification in response to antigen signaling. Mol Syst Biol. 2011;7:495–509. doi: 10.1038/msb.2011.25. [DOI] [PMC free article] [PubMed] [Google Scholar]
- Sciammas R, Shaffer AL, Schatz JH, Zhao H, Staudt LM, Singh H. Graded expression of interferon regulatory factor-4 coordinates isotype switching with plasma cell differentiation. Immunity. 2006;25:225–236. doi: 10.1016/j.immuni.2006.07.009. [DOI] [PubMed] [Google Scholar]
- Tubo NJ, Pagan AJ, Taylor JJ, Nelson RW, Linehan JL, Ertelt JM, Huseby ES, Way SS, Jenkins MK. Single naive CD4+ T cells from a diverse repertoire produce different effector cell types during infection. Cell. 2013;153:785–796. doi: 10.1016/j.cell.2013.04.007. [DOI] [PMC free article] [PubMed] [Google Scholar]
- van Panhuys N, Klauschen F, Germain RN. T-cell-receptor-dependent signal intensity dominantly controls CD4(+) T cell polarization In Vivo. Immunity. 2014;41:63–74. doi: 10.1016/j.immuni.2014.06.003. [DOI] [PMC free article] [PubMed] [Google Scholar]
- Willis SN, Good-Jacobson KL, Curtis J, Light A, Tellier J, Shi W, Smyth GK, Tarlinton DM, Belz GT, Corcoran LM, et al. Transcription factor IRF4 regulates germinal center cell formation through a B cell-intrinsic mechanism. J Immunol. 2014;192:3200–3206. doi: 10.4049/jimmunol.1303216. [DOI] [PubMed] [Google Scholar]
- Wysocker A, Tibbetts K, Fennell T. Picard tools version 1.107. 2013 http://picardsourceforgenet.
- Yamane H, Zhu J, Paul WE. Independent roles for IL-2 and GATA-3 in stimulating naive CD4+ T cells to generate a Th2-inducing cytokine environment. J Exp Med. 2005;202:793–804. doi: 10.1084/jem.20051304. [DOI] [PMC free article] [PubMed] [Google Scholar]
- Yao S, Buzo BF, Pham D, Jiang L, Taparowsky EJ, Kaplan MH, Sun J. Interferon regulatory factor 4 sustains CD8(+) T cell expansion and effector differentiation. Immunity. 2013;39:833–845. doi: 10.1016/j.immuni.2013.10.007. [DOI] [PMC free article] [PubMed] [Google Scholar]
- Yenson V, Baumgarth N. Purification and immune phenotyping of B-1 cells from body cavities of mice. Methods Mol Biol. 2014;1190:17–34. doi: 10.1007/978-1-4939-1161-5_2. [DOI] [PubMed] [Google Scholar]
- Zhang Y, Liu T, Meyer CA, Eeckhoute J, Johnson DS, Bernstein BE, Nusbaum C, Myers RM, Brown M, Li W, et al. Model-based analysis of ChIP-Seq (MACS) Genome Biol. 2008;9:R137. doi: 10.1186/gb-2008-9-9-r137. [DOI] [PMC free article] [PubMed] [Google Scholar]
- Zheng Y, Chaudhry A, Kas A, deRoos P, Kim JM, Chu TT, Corcoran L, Treuting P, Klein U, Rudensky AY. Regulatory T-cell suppressor program co-opts transcription factor IRF4 to control T(H)2 responses. Nature. 2009;458:351–356. doi: 10.1038/nature07674. [DOI] [PMC free article] [PubMed] [Google Scholar]
Associated Data
This section collects any data citations, data availability statements, or supplementary materials included in this article.