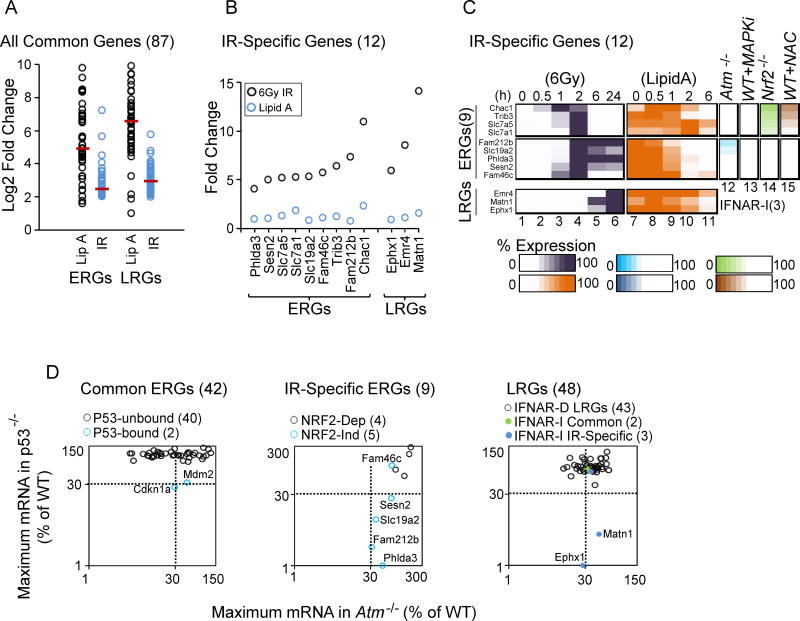
Figure 6. Identification and Analysis of 12 IR-Specific Genes: Roles of NRF2 and p53 in IR Specificity.
(A) A dot plot displays the Log2 fold induction by Lipid A and IR for 42 commonly induced ERGs and 45 commonly induced LRGs.
(B) The graph displays the maximum fold induction of the 12 IR-specific genes by IR and Lipid A.
(C) A heat map shows the expression kinetics (percent of maximum expression) for the 12 IR-specific genes following treatment with IR (column 1–6) and Lipid A (column 7–11). Columns 12–15 highlight the dependence of each IR-specific ERG on ATM, MAPKs, NRF2 and ROS.
(D) The scatter plot at the left shows the maximum transcript levels for commonly induced ERGs in p53−/− (y-axis) and Atm−/− (x-axis) BMDMs. The two genes containing p53 binding sites within 1 kb of the TSS are highlighted in blue (see Figure 7). The center plot displays maximum transcript levels for IR-specific ERGs in p53−/− (y-axis) and Atm−/− (x-axis) BMDMs. NRF2-independent genes are highlighted in blue. The right plot displays maximum transcript levels for IFNAR-dependent LRGs, commonly induced IFNAR-independent LRGs, and IR-specific IFNAR-independent LRGs in p53−/− (y-axis) and Atm−/− (x-axis) BMDMs.

