

Abstract
The present prospective observational study aimed to identify the existence of successful cognitive agers among a group of well-defined cognitively healthy older adults (n = 354, mean age = 75 years), and to examine baseline individual-level predictors and associated health outcomes over time. Episodic memory (EM) and executive function (EF) composite scores and multiple health outcomes were obtained annually over 5 years. Potential individual-level predictors that were related to Alzheimer's pathology or genetic risk, neurodegeneration, and vascular risks were collected at baseline. Three latent classes with matched age and education were identified using growth mixture modeling: a group of participants who exhibited high, stable EM and EF (40.7% of the sample, “successful agers”); a group who had initial high cognitive performance that declined over time (21.2%, “declining agers”); and a group who had normal (EM) or poor (EF) but stable cognitive performance over time (38.1%, “low stable agers”). The group classification predicted significant differences in the incidence of global cognitive impairment, the development of at least one depressive symptom, and everyday functional impairment. Sex, Apolipoprotein E allele 4, beta-amyloid1-42, and t-tau significantly contributed to the difference in cognitive trajectories between the successful agers and the other two groups. Characterizing successful cognitive agers who are relatively resistant to both tau and amyloid pathology provides potential pathways for promoting successful cognitive aging and preventing cognitive decline.
Keywords: tau, beta-amyloid, successful cognitive aging, executive function, episodic memory
Introduction
Historically, cognitive decline was largely believed to be inevitable in the aging process and accelerated in neurodegenerative diseases, such as Alzheimer's disease (AD) [1, 2]. Recent literature, however, suggests that there is inter-individual variability in the maintenance of cognitive capacities in old age [3-5]. Some older adults have superior cognitive capacities compared to age- and education-matched cognitively normal older adults [6, 7] or even when compared to cognitively normal younger or middle-age individuals [8-11]. Some retain excellent cognitive capacities over decades [12-14]. These emerging studies encourage more research to better understand the nature of “successful cognitive aging” or even so-called “Supernormals” [6, 7] or “Superagers” [9].
There are two issues regarding the identification of older adults exhibiting successful cognitive aging. First, most of the existing studies (although see [12, 15, 16]) identify excellent cognitive capacities via a brief screening for global cognition or a single domain, such as episodic memory (EM). Differing degrees of change across different cognitive domains are known in the aging process. For example, global cognition usually declines slower than specific cognitive domains because older adults can compensate for global cognitive loss via multiple factors [17-19]. Moreover, decline in EM and executive function (EF), two important cognitive abilities, may have different roles in AD pathology vs. normal aging-related neurodegeneration that EM may be more sensitive to AD while EF may be more relevant to aging [20-23]. Other studies have developed composite scores that incorporating multiple cognitive domains [15], ignoring the fact that the longitudinal trajectories of these cognitive domains may not be identical. Morack et al. (2013) demonstrated longitudinal changes in multiple domains of psychological functioning to better understand successful aging, based on social integration, depression, and a single cognitive domain, memory [24]. A comprehensive understanding of multiple cognitive domains, especially their longitudinal trajectories, is required to more accurately characterize successful cognitive aging [12, 15, 16].
Second, factors prospectively predicting successful cognitive aging have mostly been socio-demographic characteristics rather than neurobiological characteristics, namely younger age and higher education, or behaviors, such as more engagement in physically or mentally stimulating activities (e.g., [18]. More recent cross-sectional case-control studies have started identifying neurobiological mechanisms related to successful cognitive aging. These studies suggest that differences in brain structure and function, especially in the cingulate cortex, prefrontal cortex, and medial temporal lobe, may be related to differences in cognitive abilities ranging from above average to deficient [6, 8, 11]. However, it is unclear if these neurobiological differences are due to aging-associated neurodegeneration or to AD-specific pathology. In our recent work, we found that older adults with excellent EM had less AD pathology, indexed by whole-brain cerebral amyloid deposition [6]. These aging adults also were less affected by aging-associated neurodegeneration indexed by a network promoting increased nitric oxide bioavailability [7]. An important issue is that these results emerged from case-control studies, and a clarification of the prospective roles of these critical neurobiological factors in predicting successful cognitive aging is required for identifying proper therapeutic targets.
The present study applied growth mixture models that examined the potentially heterogeneous longitudinal trajectories of multiple cognitive domains simultaneously. This procedure is known as “finite mixture modeling” (FMM) [25-27]. Here, we aimed to identify the existence of a successful cognitive aging group among a sample of well-defined cognitively healthy aging adults. Using FMM, we first characterized the trajectories of EM and EF developed using composite scores of multiple cognitive battery tests respectively over a 5-year span among cognitively healthy older adults. We also examined baseline individual-level profiles that could predict the heterogeneity in the trajectories, including neurodegeneration (may be due to aging, AD, or other neurologic disorders) and factors specific to AD (pathology or genetic risk). Lastly, we distinguished the trajectories' influence on the incidence of aging or AD-associated adverse health outcomes (i.e., global cognitive, emotional, and functional impairments) over time.
Methods
Data source
The data used in the preparation of this article were obtained from the ADNI database (adni.loni.usc.edu). The ADNI was launched in 2003 as a public-private partnership, led by Principal Investigator Michael W. Weiner, M.D. The primary goal of ADNI has been to test whether serial magnetic resonance imaging (MRI), positron emission tomography (PET), other biological markers, and clinical and neuropsychological assessment can be combined to measure the progression of MCI and early AD. For up-to-date information, see www.adni-info.org.
Participants
The data used in this study were obtained from ADNIGO and ADNI2 datasets, which included multiple pathological and clinical assessments. To identify the existence of a successful cognitive aging group among a group of well-defined cognitively healthy aging adults, we firstly identified 354 subjects who had both EM and EF composite scores (described in the “Measures” section) and were characterized as being free from cognitive impairment (e.g., any types of dementia, mild cognitive impairment) and major psychiatric disorders (e.g., major depression) during the period of their participation in the study. Other inclusion criteria include: Mini-Mental State Exam score 24-30, Clinical Dementia Rating global score = 0, education adjusted scores on delayed recall of one paragraph from Wechsler Memory Scale Logical Memory II > 8 for 16 or more years of education, >4 for 8-15 years of education, and >2 for 0-7 years of education.
Measures
EM and EF were two composite scores derived from multiple measures assessed annually over 5 years (from baseline to a 4-year follow-up). Crane et al. (2012) and Gibbons et al. (2012) developed the two composite scores using separate factor analyses. Because they were derived using a factor analysis, the composite scores are based on the most intercorrelated tests in the battery, and therefore represent the most internally consistent test groupings. The composite EM index was based on the memory-related domains of the Mini-Mental Status Examination, Alzheimer's Disease Assessment Scale-Cognition subscale, Rey Auditory Verbal Learning Test, and Logical Memory test. The composite EF index was based on the Wechsler Memory Scale- Revised Digit Span Test, Digit Span Backwards, Category Fluency-animals and vegetables, Trails A and B, and the Clock Drawing Test. Of note, all of these individual tests are performance-based standard clinical neuropsychological tests. The average standardized EM and EF composite score is 0 among the entire ADNI sample (including those with cognitive impairment). EM and/or EF score above 0 indicated having relatively intact performance. In addition, the mean of the EM score for cognitively healthy participants in ADNI was 1.0, and for EF was 0.70 [28, 29]. Before conducting the FMM analysis, correlations between EM and EF were examined with linear regressions for each individual visit. After controlling for age and education, only 14.0-26.8% of the variance in EM was explained by EF across all assessments. This result means that heterogeneity might exist between EM and EF measures, indicating the appropriateness to apply FMM for determining latent classes.
Baseline individual characteristics included cerebrospinal fluid and genetic markers related to neurodegeneration, AD, and vascular risk factors for dementia. Beta-amyloid (1-42) (Aβ1-42) and t-tau were derived from the cerebrospinal fluid aliquots, measured using the multiplex xMAP Luminex platform (Luminex Corp., Austin, Tex., USA) with immunoassay kit-based reagents (INNO-BIA AlzBio3; Innogenetics, Ghent, Belgium). Details regarding the immunoassay reagents and analytical platform are included in [30]. Based on the aging and AD literature, the Aβ1-42 cutoff value ≤ 180pg/ml was used to define a positive AD pathology, and a t-tau cutoff value ≥ 96pg/ml was used to define positive neurodegeneration [31-33]. An Apolipoprotein E allele 4 (APOE4) carrier was defined as having at least one APOE4 allele (by analyzing blood samples at the National Cell Repository for AD), which is the primary genetic risk factor for late-onset AD [34]. Obesity was defined as body mass index ≥ 30, and hypertension was defined as systolic blood pressure ≥ 150 and/or diastolic pressure ≥ 90. In addition, participants' demographics, collected at baseline, were included in the analyses. Baseline sample characteristics are included in Table 1.
Table 1. Baseline Demographic and Health Characteristics (n = 354).
| Age, mean (SD) | 74.52 (6.54) |
| Male, n (%) | 162 (45.8) |
| White, n (%) | 312 (88.4) |
| Years of education, mean (SD) | 16.61 (2.59) |
| a Hypertension, n (%) | 57 (16.4) |
| b Obesity, n (%) | 82 (23.9) |
| c GDS, mean (SD) | 0.85 (1.26) |
| • GDS > 0, n (%) | 167 (47.6) |
| d APOE4 carrier, n (%) | 92 (32.9) |
| e Aβ1-42+, n (%) | 106 (38.5) |
| f t-tau+, n (%) | 42 (15.1) |
Note. Analytical sample
348,
343,
351,
352,
280,
278,
248. GDS = Geriatric Depressive Scale; APOE4 = Apolipoprotein E allele 4.
Health outcomes were measured annually from baseline up to a 4-year follow-up, corresponding to the time points available for the EM and EF measures. Global cognition was measured using the Montreal Cognitive Assessment (MOCA; [35]. We used the MOCA as an index for global cognition, since it was not included in the development of EM and EF composite scores. Impaired global cognition was defined as MOCA < 26 [35]. Depressive symptoms were measured using the 15-item Geriatric Depressive Scale (GDS; [36]. Given the skewness of the data distribution, a score greater than 0 was identified as positive for depressive symptoms. Everyday cognition was measured using the Everyday Cognition (ECog) scale, which is a self-reported measure (Farias et al., 2008). Participants were asked to rate their performance on a variety of everyday activities related to different domains of cognition, indicating how much they perceived their performance to have changed over the past 10 years. Scores on each item ranged from 1 (no change over 10 years) to 4 (much worse performance); a score of 5 indicated that the participant did not know the answer [37]. We averaged all items excluding any item scored as a “5”. Lower scores indicated better perceived functioning. We defined ECog ≥ 2 as having deficits in everyday cognition. Everyday functioning was measured using the Pfeffer Functional Activities Questionnaire (FAQ; [38], including 10 self-reported items of instrumental activities of daily living. Scores on each item ranged from 0 (normal) to 3 (dependent). A sum score was developed based on all items. We defined FAQ > 0 as having deficits in everyday functioning. Of note, due to an extremely healthy aging sample, we used a high threshold to define the presence of a symptom or deficit, instead of the traditional clinical diagnostic criteria (e.g., < 1% of the current sample had GDS > 5, which indicates potentially major depressive symptoms).
Data analyses
An FMM was conducted using R, while other analyses were conducted using IBM SPSS 22.0. A bivariate FMM analyzed the EM and EF longitudinal trajectories using the R package, “FlexMix” [27]. An FFM was justified for the EM and EF longitudinal data, because a multi-modal distribution was observed for the variables. In addition, the present sample was not assigned into groups [27, 39]. FMM employed a generalized estimating equation model of the longitudinal performance of EM and EF with an M-dependent working correlation matrix for the multiple time points. Parametric bootstrapping was used to analyze the reliability, or variability, of coefficient estimates in the FMM to determine the solutions [40]. Age and education, the two primary confounders for cognitive aging, were controlled in the analysis. The best fitting model was decided with the bias-corrected Akaike Information Criterion (AICc), the Bayesian Information Criterion (BIC), and the negative Log-likelihood, in conjunction with considerations of theoretical utility. Smaller values in these criteria indicated better model fit. Maximum posterior probability was then used to segment participants into classes after deciding the best fitting model. In the present study, we found the 3-class solution to be the best solution after running up to 5-class solutions. Since we aimed at characterizing the group with successful cognitive aging, in the following analyses, class 2 (the best performing class over time, potentially reflecting successful cognitive aging) from the 3-class solution was considered the reference class, comparing to other classes. Predictors of latent class membership from the FMM were determined using a multinomial logistic regression. The baseline participant characteristics were analyzed separately as predictors to avoid any interacting effect among these variables. However, when examining factors related to vascular risk, AD, and neurodegeneration, we controlled for sex. The impact of latent class on the incidence of adverse health outcomes was examined using the Cox Proportional Hazard Regression. We used time since baseline as the timescale to estimate hazard ratios (HRs) with 95% confidence intervals (CIs) for incident adverse health outcomes. Two methods (i.e., visual inspection of log minus log survival curves, and test of Schoenfeld residuals) were used to verify the proportional hazard assumptions. All tests were two-tailed, and significance was considered at a p value less than .05.
Results
Classification of EM and EF
We examined the number of classes from one (parsimonious) to five (overfitting) to determine the best fitting model. After controlling for age and education, the 3-class solution was the best fitting model as indicated by the lowest AICc, BIC, and negative Log-likelihood (Table 2). Table 3 displays the intercepts and slopes of EM and EF in each class with the 3-class solution. Figure 1 shows the trajectories of EM and EF from baseline to a 4-year follow-up. Compared to the cutoff for cognitive normal as mean Z-score for EM (at 1.0) and EF (at 0.7) in ADNI [28, 29], participants in Class 1 (21.2%) had relatively high EM and EF that both declined significantly over time; those in Class 2 (40.7%) had relatively high EM remained stable over time and relatively high EF that increased significantly over time; and those in Class 3 (38.1%) had average stable EM and low EF that declined significantly over time (see Table 3).
Table 2. Model Fit for the Classification.
| Model fit indicators | One-class model | Two-class model | Three-class model | Four-class model | Five-class model |
|---|---|---|---|---|---|
| AICc | 2747.52 | 2665.14 | 2630.39 | 2668.02 | 2664.44 |
| BIC | 2757.43 | 2675.05 | 2640.30 | 2677.94 | 2674.36 |
| Negative Log-likelihood | 1371.75 | 1330.57 | 1313.19 | 1332.01 | 1330.22 |
Table 3.
Parameter Estimates of Classification for EM and EF.
| EM | EF | ||||
|---|---|---|---|---|---|
| Class | N (%) | Intercept (SE) | Slope (SE) | Intercept (SE) | Slope (SE) |
| 1 | 75 (21.2) | 1.41 (0.08)*** | -0.05 (0.02)** | 1.25 (0.08)*** | -0.14 (0.02)*** |
| 2 | 144 (40.7) | 1.51 (0.06)*** | 0.003 (0.02) | 1.05 (0.08)*** | 0.08 (0.02)*** |
| 3 | 135 (38.1) | 1.08 (0.20)*** | -0.12 (0.07) | 0.40 (0.07)*** | -0.06 (0.02)** |
Note.
p < .001;
p < .005. ADNI cognitively normal cohort mean EM = 1.0, mean EF = 0.7.
Figure 1.
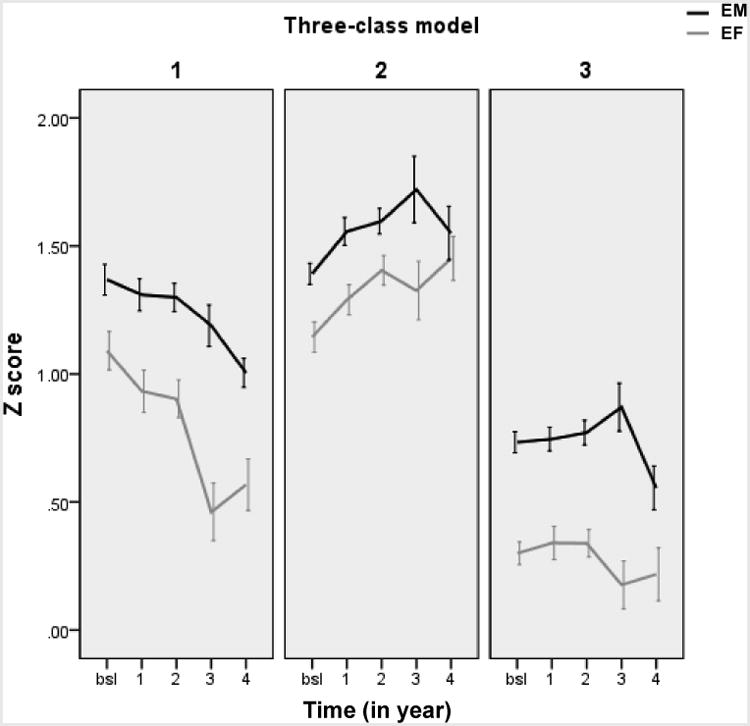
The trajectories of EM and EF from baseline to a 4-year follow-up by the latent class. Note. EM = episodic memory; EF = executive function; bsl = baseline
Baseline Sample Characteristics in Predicting Class Membership
Table 4 shows the baseline characteristics in predicting class membership using the multinomial logistic regression, with Class 2 as the reference group. Males were more likely to be in Class 3 (OR = 2.18, 95%CI: 1.35-3.53) than Class 2 (and at trend level, compared to Class 1). Therefore, sex was controlled when analyzing other baseline characteristics. APOE4 carriers (OR = 2.16, 95%CI: 1.26-3.72) and Aβ1-42+ (OR = 2.33, 95%CI: 1.29-4.21) were more likely to be in Class 3 compared to Class 2. Individuals with t-tau+ was more likely to appear in Class 1 (OR = 2.47, 95%CI: 1.02-6.01) compared to Class 2. Neither obesity nor hypertension was a significant predictor.
Table 4. Membership in Latent Classes as a Function of Baseline Sample Characteristics.
| Class 1 | Class 3 | |||||||
|---|---|---|---|---|---|---|---|---|
| Variable (analytical sample size) | OR | 95% CI | Wald's χ2 | p Value | OR | 95% CI | Wald's χ2 | p Value |
| Age (354) | 0.97 | 0.93, 1.01 | 2.19 | .14 | 0.99 | 0.96, 1.03 | 0.18 | .67 |
| Years of education (354) | 1.09 | 0.98, 1.15 | 2.56 | .11 | 1.06 | 0.96, 1.16 | 1.30 | .26 |
| Male (354) | 1.63 | 0.93, 2.88 | 2.88 | .090 | 2.18 | 1.35, 3.53 | 10.10 | .001 |
| White (354) | 1.20 | 0.54, 2.70 | 0.20 | .65 | 0.70 | 0.32, 1.49 | 0.90 | .34 |
| Hypertension (343) # | 0.44 | 0.18, 1.08 | 3.24 | .072 | 0.93 | 0.50, 1.74 | 0.05 | .82 |
| Obesity (343) # | 0.78 | 0.38, 1.62 | 0.44 | .51 | 1.34 | 0.76, 2.35 | 1.01 | .32 |
| APOE4 carrier (352) # | 0.91 | 0.46, 1.83 | 0.07 | .80 | 2.16 | 1.26, 3.72 | 7.72 | .005 |
| Aβ1-42+ (275) # | 1.90 | 0.94, 3.86 | 3.15 | .076 | 2.33 | 1.29, 4.21 | 7.91 | .005 |
| t-tau+ (273) # | 2.47 | 1.02, 6.01 | 3.99 | .046 | 1.82 | 0.82, 4.03 | 2.16 | .14 |
controlled for sex. Bolded p < .05; Italic p < .1. APOE4 = Apolipoprotein E allele 4;
Incidence of Adverse Health Outcomes over Time by Latent Class
Table 5 and Figure 2 show the impact of the latent class on the incident adverse outcomes using a Cox regression. Both Class 1 (HR = 1.30, 95%CI: 1.00-1.68) and Class 3 (HR = 2.53, 95%CI: 2.04-3.13) had a higher likelihood of developing impaired global cognition (MOCA < 26) than Class 2. Compared to Class 2, Class 3 had a higher likelihood of developing at least one depressive symptom (GDS > 0) (HR = 1.40, 95%CI: 1.15-1.71), perceptions of everyday cognition deficits (Ecog ≥ 2, HR = 2.34, 95%CI: 1.39-3.93), and IADL deficits (FAQ > 0, HR = 1.83, 95%CI: 1.10-2.42).
Table 5. Latent Classes in Predicting the Incidence of Adverse Health Outcomes over Time (Taking Class 2 as the reference).
| Class 1 | Class 3 | |||||||
|---|---|---|---|---|---|---|---|---|
| Adverse health outcome | HR | 95% CI | Wald's χ2 | p Value | HR | 95% CI | Wald's χ2 | p Value |
| MOCA < 26 | 1.30 | 1.00, 1.68 | 3.91 | .048 | 2.53 | 2.04, 3.13 | 71.05 | < .001 |
| GDS > 0 | 1.17 | 0.94, 1.46 | 2.08 | .15 | 1.40 | 1.15, 1.71 | 11.07 | .001 |
| Ecog ≥ 2 | 0.72 | 0.34, 1.52 | 0.73 | .39 | 2.34 | 1.39, 3.93 | 10.22 | .001 |
| FAQ > 0 | 0.56 | 0.32, 1.00 | 3.84 | .050 | 1.83 | 1.10, 2.42 | 5.99 | .014 |
controlled for sex. Bolded p < .05; Italic p < .1. MOCA = Montreal Cognitive Assessment; GDS = geriatric depressive score; Ecog = Everyday Cognition scale; FAQ = Functional Activities Questionnaire.
Figure 2.
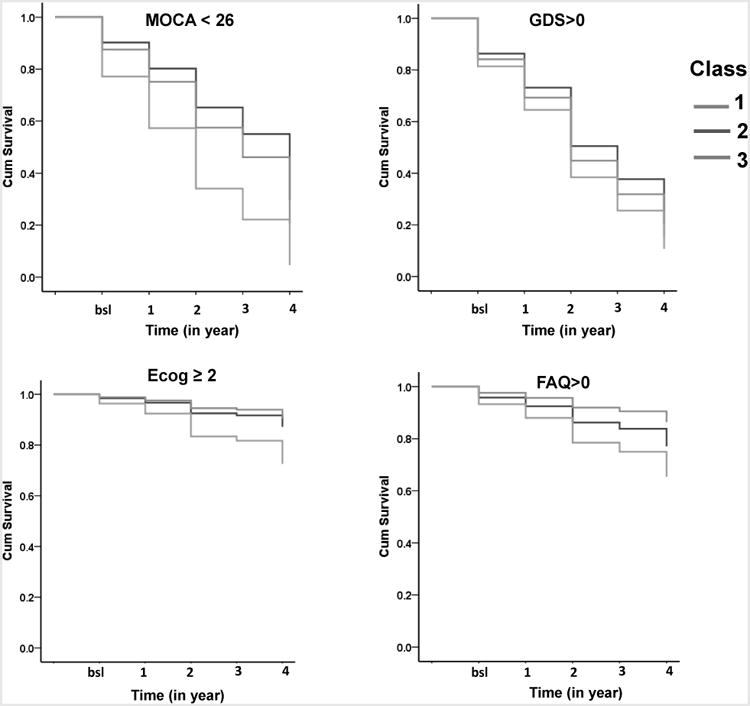
The impact of the latent class on the incident adverse outcomes using cumulative survival. Note. MOCA = Montreal Cognitive Assessment; GDS = geriatric depressive score; Ecog = Everyday Cognition scale; FAQ = Functional Activities Questionnaire; bsl = baseline.
Discussion
Applying the FMM to a 5-year prospective cognitively healthy aging cohort with a mean age of 75 years, we were able to distinguish a group of “successful” cognitive agers who exhibited high, stable EM and EF (40.7% of the sample, “successful agers”) from their age- and education-matched counterparts, who either had initially high cognitive performance that declined over time (21.2%, “declining ager”) or had normal and stable (EM) or poor (EF) cognitive performance over time (38.1%, “low stable ager”). The group classification predicted differences in the incidence of global cognitive impairment, the development of at least 1 depressive symptom, and IADL impairment. In addition to sex, both AD pathology (Aβ1-42) or genetic risk factor for AD (APOE4), and neurodegeneration (t-tau) contributed to the difference in cognitive trajectories between successful agers and the other two groups.
Although the maintenance of any level of earlier life cognitive functioning (even if poor) might be defined as “successful,” the “successful agers” in this study were those who exhibited above average cognitive functioning without decrement over time. The proportion of successful cognitive agers (at 35.8%) is slightly higher than those reported in larger community-dwelling aging studies of successful agers. Previous studies on successful aging have not used any latent class analysis to classify successful cognitive aging (see meta-analysis [41]). In addition to using FMM to identify this successful ager group, the slightly higher proportion in our study may due to the less diverse sampling procedures from ADNI study. As a longitudinal study with a commitment to intense biological assessments, ADNI may have already preselected a relatively healthy group of normal controls. Therefore, the findings may not be as applicable to other aging populations.
Regardless, both the cognitive domains and trajectories involved in characterizing successful cognitive agers warrant discussion. We incorporated a broad assessment of EF (visuospatial, attention, working memory, and verbal fluency) into the measures of cognitive functioning in the present study. EM has been the most frequently used determiner of successful cognitive aging in the literature [6, 7]. However, individuals with excellent EM do not necessarily have equivalent EF [7]. EF is involved in almost every aspect of emotional and functional health in older adults' everyday life (e.g.,[26]). Perhaps because of the involvement of EF, the latent class here significantly predicted later functional, depressive, and global cognitive impairment.
The trajectory, including the intercept (baseline level) and slope (rate of change over time), contributed to determining which individuals were successful cognitive agers. The successful agers remained relatively stable in EM over time, and some even had significant improvement in EF. The apparent improvement of EF may be explained by practice effects related to the specific tasks, which were not controlled for in the development of the Z-scores in each domain. Yet, practice effects themselves are evidence of cognitive astuteness, as they are related to learning and retention, a prominent component of successful aging from the older adult's perspective [42, 43] and a unique phenomenon for Class 2 (“successful agers”) here. Conversely, the declining agers had baseline levels of EM and EF comparable to the successful agers, although both domains declined significantly over time. This group may often be categorized into successful agers in cross-sectional studies, while in reality this group may encounter multiple factors that affect the longitudinal trajectory. Lastly, for “low stable agers”, the baseline levels of EM and EF were averaged or relatively low, and EF declined slightly over time. Of note, the true value of the EM slope for this group was large (-0.12 unit change per year). Therefore, the non-significant change over time in the “low stable agers” may have resulted from the large intra-individual variability of the slope within this group (SE = 0.07 of EM slope in Class 3 compared to SE = 0.02 for the EM slopes in the other classes).
In the present study, two novel characteristics of the “successful agers” emerged by comparing them to the other two groups: they started with both less neurodegeneration and AD pathology/genetic risk. Compared to the “successful agers”, the “declining agers” had a significantly higher prevalence of t-tau+ at baseline compared to the successful agers. t-tau+, a marker for neurodegeneration may have a broad influence on multiple cognitive domains associated with normal aging [32]. Aligned with the predictor of t-tau, the “declining agers” possibly reflect a normal aging associated cognitive declining trajectories, as shown in other cohort studies [26]. By contrast, for the low stable agers, their relatively poor baseline cognitive performance and trajectories were more relevant to APOE4 and Aβ1-42+, both of which are related to pathophysiology or genetic risk of AD. Importantly, all members of this class had a normal cognitive status. Considering the factors that seem to influence their cognitive trajectories, this group may include individuals with preclinical AD [44], and have a risk for incident dementia [21]. Furthermore, we acknowledge that cerebrospinal fluid t-tau may not directly represent brain pathology compared to the same measure of Aβ1-42 (see [45]. The dissociated patterns between t-tau vs. Aβ1-42 (or APOE4) in predicting cognitive trajectories in cognitively healthy older adults revealed in the current study needs to be replicated. Regardless, given the higher prevalence of AD pathology/genetic risk and neurodegeneration, and longitudinally more adverse health consequences in multiple domains compared to the successful agers, the declining agers and low stable agers may warrant clinical attention early on.
We purposely controlled for age and education when determining the latent classes since we were interested in the true effect of the other factors that were distinct from these two unmodifiable but major factors of cognitive aging. Also, controlling for these two factors may have helped remove the shared similarity between EM and EF, which may have helped identify distinctive trajectories for these typically correlated domains. Other individual level characteristics differentiating the classes need some discussion here. First, health history, such as hypertension and obesity, had small effects on this aging sample's classification. Of note, previous studies have found that when health history (e.g., blood pressure, body-mass index) was a significant predictor for successful aging, the criteria for successful aging usually relied on physical domains [46]. Second, there were more males in the declining and low stable ager groups, compared to the successful ager group. Previous studies have suggested that males have a higher risk for developing cognitive decline [47].
There are some limitations and relevant future directions for this research. First, recent studies comparing successful agers with cognitively intact or impaired counterparts have characterizing individuals with excellent memory capacity via structural and functional neuroimaging profiles seeded in the cingulate cortex [6, 8]. Given the relatively small sample size of neuroimaging data available in the current study (about a tenth of the whole sample), we did not examine the neuroimaging profiles in the current dataset. Whether including EF in the operational definition of successful cognitive aging would change the existing understanding of structural or functional imaging profile. In particular, future work should provide a comprehensive comparison of imaging profiles related to AD pathology versus neurodegeneration- in relation to successful cognitive aging. Second, as stated earlier, we defined health outcomes (e.g., free of depressive symptoms) using our own restricted criteria, since the dataset contained an extremely healthy aging sample. Future studies may need to reexamine the relationships between health outcomes and successful cognitive aging using clinically meaningful cutoff scores for health outcomes. Third, we did not assess any cognitive lifestyle factors (e.g., engagement in stimulating leisure activities) that may help explain why cognitive abilities increase in the successful aging group, especially among women. A next step could examine the interaction between pathological and everyday cognitive activities influencing successful cognitive aging.
Acknowledgments
The writing of this manuscript was supported by the Furth Fund from the University of Rochester to F. Lin. Data collection and sharing for this project was funded by the Alzheimer's Disease Neuroimaging Initiative (ADNI) (National Institutes of Health Grant U01 AG024904) and DOD ADNI (Department of Defense award number W81XWH-12-2-0012). ADNI is funded by the National Institute on Aging, the National Institute of Biomedical Imaging and Bioengineering, and through generous contributions from the following: AbbVie, Alzheimer's Association; Alzheimer's Drug Discovery Foundation; Araclon Biotech; BioClinica, Inc.; Biogen; Bristol-Myers Squibb Company; CereSpir, Inc.; Eisai Inc.; Elan Pharmaceuticals, Inc.; Eli Lilly and Company; EuroImmun; F. Hoffmann-La Roche Ltd and its affiliated company Genentech, Inc.; Fujirebio; GE Healthcare; IXICO Ltd.; Janssen Alzheimer Immunotherapy Research & Development, LLC.; Johnson & Johnson Pharmaceutical Research & Development LLC.; Lumosity; Lundbeck; Merck & Co., Inc.; Meso Scale Diagnostics, LLC.; NeuroRx Research; Neurotrack Technologies; Novartis Pharmaceuticals Corporation; Pfizer Inc.; Piramal Imaging; Servier; Takeda Pharmaceutical Company; and Transition Therapeutics. The Canadian Institutes of Health Research is providing funds to support ADNI clinical sites in Canada. Private sector contributions are facilitated by the Foundation for the National Institutes of Health (www.fnih.org). The grantee organization is the Northern California Institute for Research and Education, and the study is coordinated by the Alzheimer's Disease Cooperative Study at the University of California, San Diego. ADNI data are disseminated by the Laboratory for Neuro Imaging at the University of Southern California.
References
- 1.Tromp D, Dufour A, Lithfous S, Pebayle T, Despres O. Episodic memory in normal aging and Alzheimer disease: Insights from imaging and behavioral studies. Ageing Res Rev. 2015;24:232–262. doi: 10.1016/j.arr.2015.08.006. [DOI] [PubMed] [Google Scholar]
- 2.Park DC, Reuter-Lorenz P. The adaptive brain: aging and neurocognitive scaffolding. Annu Rev Psychol. 2009;60:173–196. doi: 10.1146/annurev.psych.59.103006.093656. [DOI] [PMC free article] [PubMed] [Google Scholar]
- 3.Raz N, Lindenberger U. Only time will tell: cross-sectional studies offer no solution to the age-brain-cognition triangle: comment on Salthouse (2011) Psychol Bull. 2011;137:790–795. doi: 10.1037/a0024503. [DOI] [PMC free article] [PubMed] [Google Scholar]
- 4.Nyberg L, Lovden M, Riklund K, Lindenberger U, Backman L. Memory aging and brain maintenance. Trends Cogn Sci. 2012;16:292–305. doi: 10.1016/j.tics.2012.04.005. [DOI] [PubMed] [Google Scholar]
- 5.Fiocco AJ, Yaffe K. Defining successful aging: the importance of including cognitive function over time. Arch Neurol. 2010;67:876–880. doi: 10.1001/archneurol.2010.130. [DOI] [PubMed] [Google Scholar]
- 6.Lin F, Ren P, Mapstone M, Meyers SP, Porsteinsson A, Baran TM. The cingulate cortex of older adults with excellent memory capacity. Cortex. 2017;86:83–92. doi: 10.1016/j.cortex.2016.11.009. [DOI] [PMC free article] [PubMed] [Google Scholar]
- 7.Mapstone M, Lin F, Nalls MA, Cheema AK, Singleton AB, Fiandaca MS, Federoff HJ. What success can teach us about failure: the plasma metabolome of older adults with superior memory and lessons for Alzheimer's disease. Neurobiol Aging. 2017;51:148–155. doi: 10.1016/j.neurobiolaging.2016.11.007. [DOI] [PMC free article] [PubMed] [Google Scholar]
- 8.Gefen T, Peterson M, Papastefan ST, Martersteck A, Whitney K, Rademaker A, Bigio EH, Weintraub S, Rogalski E, Mesulam MM, Geula C. Morphometric and histologic substrates of cingulate integrity in elders with exceptional memory capacity. J Neurosci. 2015;35:1781–1791. doi: 10.1523/JNEUROSCI.2998-14.2015. [DOI] [PMC free article] [PubMed] [Google Scholar]
- 9.Rogalski EJ, Gefen T, Shi J, Samimi M, Bigio E, Weintraub S, Geula C, Mesulam MM. Youthful memory capacity in old brains: anatomic and genetic clues from the Northwestern SuperAging Project. J Cogn Neurosci. 2013;25:29–36. doi: 10.1162/jocn_a_00300. [DOI] [PMC free article] [PubMed] [Google Scholar]
- 10.Sun FW, Stepanovic MR, Andreano J, Barrett LF, Touroutoglou A, Dickerson BC. Youthful Brains in Older Adults: Preserved Neuroanatomy in the Default Mode and Salience Networks Contributes to Youthful Memory in Superaging. J Neurosci. 2016;36:9659–9668. doi: 10.1523/JNEUROSCI.1492-16.2016. [DOI] [PMC free article] [PubMed] [Google Scholar]
- 11.Pudas S, Persson J, Josefsson M, de Luna X, Nilsson LG, Nyberg L. Brain characteristics of individuals resisting age-related cognitive decline over two decades. J Neurosci. 2013;33:8668–8677. doi: 10.1523/JNEUROSCI.2900-12.2013. [DOI] [PMC free article] [PubMed] [Google Scholar]
- 12.Habib R, Nyberg L, Nilsson LG. Cognitive and non-cognitive factors contributing to the longitudinal identification of successful older adults in the betula study. Neuropsychol Dev Cogn B Aging Neuropsychol Cogn. 2007;14:257–273. doi: 10.1080/13825580600582412. [DOI] [PubMed] [Google Scholar]
- 13.Barnes DE, Cauley JA, Lui LY, Fink HA, McCulloch C, Stone KL, Yaffe K. Women who maintain optimal cognitive function into old age. J Am Geriatr Soc. 2007;55:259–264. doi: 10.1111/j.1532-5415.2007.01040.x. [DOI] [PubMed] [Google Scholar]
- 14.Yaffe K, Lindquist K, Vittinghoff E, Barnes D, Simonsick EM, Newman A, Satterfield S, Rosano C, Rubin SM, Ayonayon HN, Harris T. The effect of maintaining cognition on risk of disability and death. J Am Geriatr Soc. 2010;58:889–894. doi: 10.1111/j.1532-5415.2010.02818.x. [DOI] [PMC free article] [PubMed] [Google Scholar]
- 15.Negash S, Smith GE, Pankratz S, Aakre J, Geda YE, Roberts RO, Knopman DS, Boeve BF, Ivnik RJ, Petersen RC. Successful aging: definitions and prediction of longevity and conversion to mild cognitive impairment. Am J Geriatr Psychiatry. 2011;19:581–588. doi: 10.1097/JGP.0b013e3181f17ec9. [DOI] [PMC free article] [PubMed] [Google Scholar]
- 16.Burgmans S, van Boxtel MP, Vuurman EF, Smeets F, Gronenschild EH, Uylings HB, Jolles J. The prevalence of cortical gray matter atrophy may be overestimated in the healthy aging brain. Neuropsychology. 2009;23:541–550. doi: 10.1037/a0016161. [DOI] [PubMed] [Google Scholar]
- 17.Rajan KB, Wilson RS, Weuve J, Barnes LL, Evans DA. Cognitive impairment 18 years before clinical diagnosis of Alzheimer disease dementia. Neurology. 2015;85:898–904. doi: 10.1212/WNL.0000000000001774. [DOI] [PMC free article] [PubMed] [Google Scholar]
- 18.Wang HX, Jin Y, Hendrie HC, Liang C, Yang L, Cheng Y, Unverzagt FW, Ma F, Hall KS, Murrell JR, Li P, Bian J, Pei JJ, Gao S. Late life leisure activities and risk of cognitive decline. J Gerontol A Biol Sci Med Sci. 2013;68:205–213. doi: 10.1093/gerona/gls153. [DOI] [PMC free article] [PubMed] [Google Scholar]
- 19.Bretsky P, Guralnik JM, Launer L, Albert M, Seeman TE. The role of APOE-epsilon4 in longitudinal cognitive decline: MacArthur Studies of Successful Aging. Neurology. 2003;60:1077–1081. doi: 10.1212/01.wnl.0000055875.26908.24. [DOI] [PubMed] [Google Scholar]
- 20.Lim YY, Ellis KA, Harrington K, Kamer A, Pietrzak RH, Bush AI, Darby D, Martins RN, Masters CL, Rowe CC, Savage G, Szoeke C, Villemagne VL, Ames D, Maruff P. Cognitive consequences of high Abeta amyloid in mild cognitive impairment and healthy older adults: implications for early detection of Alzheimer's disease. Neuropsychology. 2013;27:322–332. doi: 10.1037/a0032321. [DOI] [PubMed] [Google Scholar]
- 21.Albert MS, Moss MB, Tanzi R, Jones K. Preclinical prediction of AD using neuropsychological tests. J Int Neuropsychol Soc. 2001;7:631–639. doi: 10.1017/s1355617701755105. [DOI] [PubMed] [Google Scholar]
- 22.Mistridis P, Krumm S, Monsch AU, Berres M, Taylor KI. The 12 Years Preceding Mild Cognitive Impairment Due to Alzheimer's Disease: The Temporal Emergence of Cognitive Decline. J Alzheimers Dis. 2015;48:1095–1107. doi: 10.3233/JAD-150137. [DOI] [PMC free article] [PubMed] [Google Scholar]
- 23.Hamel R, Kohler S, Sistermans N, Koene T, Pijnenburg Y, van der Flier W, Scheltens P, Aalten P, Verhey F, Visser PJ, Ramakers I. The trajectory of cognitive decline in the pre-dementia phase in memory clinic visitors: findings from the 4C-MCI study. Psychol Med. 2015;45:1509–1519. doi: 10.1017/S0033291714002645. [DOI] [PubMed] [Google Scholar]
- 24.Morack J, Ram N, Fauth EB, Gerstorf D. Multidomain trajectories of psychological functioning in old age: A longitudinal perspective on (uneven) successful aging. Developmental psychology. 2013;49:2309. doi: 10.1037/a0032267. [DOI] [PubMed] [Google Scholar]
- 25.Muthen B, Shedden K. Finite mixture modeling with mixture outcomes using the EM algorithm. Biometrics. 1999;55:463–469. doi: 10.1111/j.0006-341x.1999.00463.x. [DOI] [PubMed] [Google Scholar]
- 26.Lin F, Chen DG, Vance D, Mapstone M. Trajectories of combined laboratory- and real world-based speed of processing in community-dwelling older adults. J Gerontol B Psychol Sci Soc Sci. 2013;68:364–373. doi: 10.1093/geronb/gbs075. [DOI] [PMC free article] [PubMed] [Google Scholar]
- 27.Leisch F. FlexMix: A general framework for finite mixture models and latent class regression in R. Journal of Statistical Software. 2004;11 [Google Scholar]
- 28.Crane PK, Carle A, Gibbons LE, Insel P, Mackin RS, Gross A, Jones RN, Mukherjee S, Curtis SM, Harvey D, Weiner M, Mungas D. Development and assessment of a composite score for memory in the Alzheimer's Disease Neuroimaging Initiative (ADNI) Brain Imaging Behav. 2012;6:502–516. doi: 10.1007/s11682-012-9186-z. [DOI] [PMC free article] [PubMed] [Google Scholar]
- 29.Gibbons LE, Carle AC, Mackin RS, Harvey D, Mukherjee S, Insel P, Curtis SM, Mungas D, Crane PK. A composite score for executive functioning, validated in Alzheimer's Disease Neuroimaging Initiative (ADNI) participants with baseline mild cognitive impairment. Brain Imaging Behav. 2012;6:517–527. doi: 10.1007/s11682-012-9176-1. [DOI] [PMC free article] [PubMed] [Google Scholar]
- 30.Olsson A, Vanderstichele H, Andreasen N, De Meyer G, Wallin A, Holmberg B, Rosengren L, Vanmechelen E, Blennow K. Simultaneous measurement of beta-amyloid(1-42), total tau, and phosphorylated tau (Thr181) in cerebrospinal fluid by the xMAP technology. Clin Chem. 2005;51:336–345. doi: 10.1373/clinchem.2004.039347. [DOI] [PubMed] [Google Scholar]
- 31.Shaw LM, Vanderstichele H, Knapik-Czajka M, Clark CM, Aisen PS, Petersen RC, Blennow K, Soares H, Simon A, Lewczuk P, Dean R, Siemers E, Potter W, Lee VM, Trojanowski JQ. Cerebrospinal fluid biomarker signature in Alzheimer's disease neuroimaging initiative subjects. Ann Neurol. 2009;65:403–413. doi: 10.1002/ana.21610. [DOI] [PMC free article] [PubMed] [Google Scholar]
- 32.Sjogren M, Vanderstichele H, Agren H, Zachrisson O, Edsbagge M, Wikkelso C, Skoog I, Wallin A, Wahlund LO, Marcusson J, Nagga K, Andreasen N, Davidsson P, Vanmechelen E, Blennow K. Tau and Abeta42 in cerebrospinal fluid from healthy adults 21-93 years of age: establishment of reference values. Clin Chem. 2001;47:1776–1781. [PubMed] [Google Scholar]
- 33.Palmqvist S, Zetterberg H, Mattsson N, Johansson P, Minthon L, Blennow K, Olsson M, Hansson O. Detailed comparison of amyloid PET and CSF biomarkers for identifying early Alzheimer disease. Neurology. 2015;85:1240–1249. doi: 10.1212/WNL.0000000000001991. [DOI] [PMC free article] [PubMed] [Google Scholar]
- 34.Corbo RM, Scacchi R. Apolipoprotein E (APOE) allele distribution in the world. Is APOE*4 a ‘thrifty’ allele? Ann Hum Genet. 1999;63:301–310. doi: 10.1046/j.1469-1809.1999.6340301.x. [DOI] [PubMed] [Google Scholar]
- 35.Rossetti HC, Lacritz LH, Cullum CM, Weiner MF. Normative data for the Montreal Cognitive Assessment (MoCA) in a population-based sample. Neurology. 2011;77:1272–1275. doi: 10.1212/WNL.0b013e318230208a. [DOI] [PubMed] [Google Scholar]
- 36.Yesavage JA, Brink TL, Rose TL, Lum O, Huang V, Adey M, Leirer VO. Development and validation of a geriatric depression screening scale: a preliminary report. J Psychiatr Res. 1982;17:37–49. doi: 10.1016/0022-3956(82)90033-4. [DOI] [PubMed] [Google Scholar]
- 37.Farias ST, Mungas D, Reed BR, Cahn-Weiner D, Jagust W, Baynes K, Decarli C. The measurement of everyday cognition (ECog): scale development and psychometric properties. Neuropsychology. 2008;22:531–544. doi: 10.1037/0894-4105.22.4.531. [DOI] [PMC free article] [PubMed] [Google Scholar]
- 38.Pfeffer RI, Kurosaki TT, Harrah CH, Jr, Chance JM, Filos S. Measurement of functional activities in older adults in the community. J Gerontol. 1982;37:323–329. doi: 10.1093/geronj/37.3.323. [DOI] [PubMed] [Google Scholar]
- 39.Deb P, Trivedi PK. The structure of demand for health care: latent class versus two-part models. J Health Econ. 2002;21:601–625. doi: 10.1016/s0167-6296(02)00008-5. [DOI] [PubMed] [Google Scholar]
- 40.Grün B, Leisch F. Bootstrapping finite mixture models. 2004 na. [Google Scholar]
- 41.Depp CA, Jeste DV. Definitions and predictors of successful aging: a comprehensive review of larger quantitative studies. Am J Geriatr Psychiatry. 2006;14:6–20. doi: 10.1097/01.JGP.0000192501.03069.bc. [DOI] [PubMed] [Google Scholar]
- 42.Reichstadt J, Depp CA, Palinkas LA, Folsom DP, Jeste DV. Building blocks of successful aging: a focus group study of older adults' perceived contributors to successful aging. Am J Geriatr Psychiatry. 2007;15:194–201. doi: 10.1097/JGP.0b013e318030255f. [DOI] [PubMed] [Google Scholar]
- 43.Baker R, Bentham P, Kourtzi Z. Learning to predict is spared in mild cognitive impairment due to Alzheimer's disease. Exp Brain Res. 2015;233:2859–2867. doi: 10.1007/s00221-015-4356-z. [DOI] [PubMed] [Google Scholar]
- 44.Sperling RA, Aisen PS, Beckett LA, Bennett DA, Craft S, Fagan AM, Iwatsubo T, Jack CR, Jr, Kaye J, Montine TJ, Park DC, Reiman EM, Rowe CC, Siemers E, Stern Y, Yaffe K, Carrillo MC, Thies B, Morrison-Bogorad M, Wagster MV, Phelps CH. Toward defining the preclinical stages of Alzheimer's disease: recommendations from the National Institute on Aging-Alzheimer's Association workgroups on diagnostic guidelines for Alzheimer's disease. Alzheimers Dement. 2011;7:280–292. doi: 10.1016/j.jalz.2011.03.003. [DOI] [PMC free article] [PubMed] [Google Scholar]
- 45.Dubois B, Hampel H, Feldman HH, Scheltens P, Aisen P, Andrieu S, Bakardjian H, Benali H, Bertram L, Blennow K, Broich K, Cavedo E, Crutch S, Dartigues JF, Duyckaerts C, Epelbaum S, Frisoni GB, Gauthier S, Genthon R, Gouw AA, Habert MO, Holtzman DM, Kivipelto M, Lista S, Molinuevo JL, O'Bryant SE, Rabinovici GD, Rowe C, Salloway S, Schneider LS, Sperling R, Teichmann M, Carrillo MC, Cummings J, Jack CR., Jr Preclinical Alzheimer's disease: Definition, natural history, and diagnostic criteria. Alzheimers Dement. 2016;12:292–323. doi: 10.1016/j.jalz.2016.02.002. [DOI] [PMC free article] [PubMed] [Google Scholar]
- 46.Hodge AM, English DR, Giles GG, Flicker L. Social connectedness and predictors of successful ageing. Maturitas. 2013;75:361–366. doi: 10.1016/j.maturitas.2013.05.002. [DOI] [PubMed] [Google Scholar]
- 47.Vassilaki M, Aakre JA, Cha RH, Kremers WK, St Sauver JL, Mielke MM, Geda YE, Machulda MM, Knopman DS, Petersen RC, Roberts RO. Multimorbidity and Risk of Mild Cognitive Impairment. J Am Geriatr Soc. 2015;63:1783–1790. doi: 10.1111/jgs.13612. [DOI] [PMC free article] [PubMed] [Google Scholar]