

Abstract
Objective
The purpose of the present study was to test the hypothesis that cochlear implant (CI) users’ music perception is correlated with their lexical tone perception and the two types of perception share similar mechanisms in electric hearing.
Design
A lexical tone perception test and a pitch interval discrimination test were administered to a group of CI users and a group of normal-hearing (NH) listeners.
Study sample
Nineteen adult CI users and 10 NH listeners who are native-Mandarin-Chinese speakers participated in the study.
Results
Tone-perception performance of the CI group was, on average, 58.3% correct (± 19.78% correct), and performance of the NH group was near perfect. The CI group had a mean threshold of 5.66 semitones (± 5.57 semitones) in pitch discrimination as compared to the threshold of 0.44 semitone from the NH group. There was a strong correlation between the CI users’ tone-perception performance and their pitch discrimination threshold (r=−0.75, p<0.001).
Conclusion
Musical and lexical pitch perception is strongly correlated with each other and they might share similar mechanisms in electric hearing.
Keywords: cochlear implants, music perception, tone perception
Introduction
Cochlear implants (CIs) have provided satisfactory speech perception in quiet listening conditions for the recipients. Typically, the speech processor of a cochlear implant divides the speech signal into a number of frequency bands. The temporal envelope of each frequency band is extracted and used to modulate an electrical pulse train that is delivered to the electrode corresponding to that frequency band. The temporal envelopes from a few relatively broad frequency bands have proven to be sufficient for English phoneme recognition (e.g., Fishman et al. 1997; Friesen et al. 2001; Xu et al. 2005). One of the greatest challenges that implant users face today is the difficulty with pitch perception that arises from the inherent poor frequency resolution of the devices. Typical CI systems use only 12 to 22 spectral channels to transmit a wide range of frequencies. Due to channel interactions, the actual number of independent channels is much fewer. The fundamental frequency (F0) and harmonics are unlikely to be resolved with such poor frequency selectivity. Temporal pitch extraction is also limited by the 300 Hz cutoff in the low pass characteristic of the amplitude modulation detection threshold (Eddington et al. 1978; McKay et al. 1994; Shannon 1983; Tong & Clark 1985; Townshend et al. 1987; Zeng 2002). Other factors such as electrode position and neural survival of the spiral ganglion cells can also affect the accuracy of temporal pitch extraction (see Moore 2003, for a review).
Poor pitch discrimination can result in poor music perception, tonal language perception, and speech perception in noise. Music perception has been measured in postlingually-deafened implant users with their clinical processors. Many of CI users reported that their enjoyment of listening to music declines substantially after implantation (Lassaletta et al. 2007). They consistently score significantly lower than normal hearing listeners in identifying familiar songs (e.g., Fujita & Ito 1999; Gfeller et al. 2002, 2006, 2007; Leal et al. 2003; Looi et al. 2008). However, the familiar melody recognition test is often confounded by the level of familiarity of the melody and provides limited information about the underlying mechanisms of why the CI users perform poorly. A handful of studies specifically examined pitch perception ability in CI users since this may be directly linked to their ability to perceive music. One study has indicated a moderate correlation (i.e., r = 0.57) between pitch discrimination and familiar melody recognition (Kang et al. 2009).
One of the commonly used methods for measuring musical pitch perception is pitch ranking. Thresholds were obtained in some studies using an adaptive procedure (Gfeller et al. 2002; Nimmons et al. 2008; Kang et al. 2009), and in others, interval sizes of the two notes in comparison were varied and reported percent correct scores of identification (e.g., Fujita & Ito 1999; Looi et al. 2008). Fujita & Ito (1999) reported that the pitch ranking thresholds measured from 8 CI users fell in a wide range of 4 semitones to 2 octaves where the threshold was defined as 80% correct. Looi et al. (2008) reported that the CI participants were unable to rank pitches that were a quarter-octave (i.e., 3 semitones) apart. They were only able to correctly rank pitches that were half an octave and one octave apart 64% and 68% of the time, respectively. Similar results of CI users’ performance in pitch ranking were reported by Sucher & McDermott (2007). Other studies used adaptive procedures and reported pitch discrimination thresholds that were in the range of 1 to 12 semitones (Gfeller et al. 2002; Nimmons et al. 2008; Kang et al. 2009).
Other pitch-related aspects of music perception such as contour identification, interval discrimination, and scale discrimination were also examined in CI users (e.g., Galvin et al. 2007; Cooper et al. 2008). Galvin et al. (2007) tested CI users’ ability to identify pitch contours from 9 different five-note melodic patterns. The performance of the CI users was found to be highly variable, ranging from 14% to 91% correct. Not surprisingly, most of the participants performed better in conditions where the interval sizes of the contours were increased. Cooper et al. (2008) used the Montreal Battery for Evaluation of Amusia (MBEA) as a diagnostic tool in an attempt to pinpoint specific deficits in the pitch-based aspects of music perception in CI users. The interval test in the MBEA involves comparing two melodies (7 to 21 notes in length) where one note in the comparison melody is changed in F0 half of the time. The listener is required to determine whether the two melodies are the same or different. Differing from the traditional pitch perception tests, the interval test in the MBEA measures pitch perception in a melodic context, a task based on the cognitive theories of music perception. It poses a task more similar to the CI users’ real life situation in terms of music appreciation. The task also does not require the listeners’ memory of a familiar melody. Results showed that the performance of all their 12 CI users was close to chance and that the CI users were severely impaired in detecting changes in interval size made either in or out of key. However, in measuring performance, MBEA only provides a global percent-correct score, and does not report the magnitude of pitch change. Therefore, it is not possible to measure a threshold. Swanson et al. (2009) used an adaptive procedure where one note of the melody was always changed in one of the two time intervals. The listeners were asked to identify which melody was correct. Although the test does measure a threshold, the result of the test is again confounded by the listener’s knowledge of the melody.
Similar to music perception, the primary acoustic cues for lexical tone perception is also the pitch contours. The four tones of Mandarin Chinese, for example, use four distinctive pitch patterns, including (1) flat, (2) rising, (3) dipping, and (4) falling, to convey lexical meanings (see Xu et al. 2002). Another tonal language, Cantonese, has six contrastive tones (see Ciocca et al. 2002). Thus, accurate perception of lexical tones is important for understanding tonal languages. Tone perception has remained to be a challenge for CI users who speak tonal languages. Wong and Wong (2004) found that Cantonese speaking children with CIs performed slightly above chance level in tone discrimination and identification tasks. Ciocca et al. (2002) confirmed that the Cantonese-speaking children with CIs could identify only 3 out of 8 tonal contrasts at above chance-level accuracy. Large individual variability in tone perception performance was seen in our recent study (Xu et al. 2009) in which a tone contrast test was administered to a group of 109 Mandarin-speaking children with CIs. The performance fell in a wide range from chance to 100% correct with a group mean of 67% correct.
Correlation between lexical or musical tone perception and psychophysical measures or the demographic variables has been examined in separate studies. It has been shown that melody recognition is correlated with both spectral-ripple discrimination and Schroeder-phase discrimination (Won et al. 2007; Drennan et al. 2008). Spectral ripple discrimination measures the ability of implant users to resolve the acoustic spectrum whereas Schroeder-phase discrimination measures one’s ability to detect changes in temporal fine structure. A few studies reported the relationship between lexical tone perception and temporal processing abilities in CI users such as rate discrimination, gap detection, frequency discrimination and modulation detection (e.g., Luo et al. 2008; Wei et al. 2004, 2007). Others related tone perception ability to the implanted child’s age at implantation and device experience. For example, Lee et al. (2002) reported that tone perception performance was related to the duration of CI use and age at implantation. Han et al. (2009) found a consistent relationship between tone perception performance and age at implantation in a longitudinal study. Xu et al. (2009) measured a much larger sample size and confirmed that age at implantation and duration of device use were the most important predictors for tone perception performance in children with CIs.
Although lexical tone and musical tone perception have been related to other measures summarized above, there are no data that support the notion that in electric hearing, the linguistic processing of pitch shares similar mechanisms with the musical processing of pitch. Intuitively, they both involve the perception of pitch and these two aspects of perception should therefore be correlated. However, there is no clinical data that substantiates such a relationship. Thus, the first goal of the present study was to determine whether musical pitch perception predicts the ability to perceive lexical tone, or vice versa, in Mandarin-speaking CI users. Secondly, the pitch related music and tone perception abilities of Mandarin-speaking CI users was compared with those in normal-hearing listeners. Thirdly, contributing factors towards performance variability in the CI users were identified.
Methods
Participants
Nineteen CI users who are native speakers of Mandarin Chinese were recruited from the Eye, Ear, Nose and Throat Hospital in Shanghai, China. Five of them were prelingually-deafened. They were identified with profound hearing loss at 5 years or younger. The remaining 14 implant users were postlingually-deafened. There were 7 females and 12 males aged between 14.9 and 57.1 years old (mean ± SD: 27.4 ± 13.0 years). Nine of the 19 users had used hearing aids for more than one year prior to cochlear implantation. None of the nineteen users wore hearing aids on the contralateral side of the implant post-surgery. The remaining 10 participants either had no hearing aid experience or had used hearing aids for one year or less. The detailed demographic information of the CI participants is listed in Table 1.
Table 1.
Demographic information of the CI subjects. Device types are categorized as 1 (Cochlear Ltd.) and 2 (Advanced Bionics). Residual hearing was measured by the mean threshold at 500, 1000, and 2000 Hz.
| Subject # | Gender | Age (yrs) | Duration of Deafness (yrs) | Pre/Post-lingually deaf | Hearing Aid Experience (yrs) | Hearing of Non-Implanted Ear (dB) | Duration of Implant Use (yrs) | Device | Speech Processing Strategy |
|---|---|---|---|---|---|---|---|---|---|
| 1 | M | 18.47 | 0.52 | Post | 3 | 85 | 2.94 | Freedom1 | ACE |
| 2 | M | 18.80 | 13.80 | Pre | 10 | 110 | 2.05 | Esprit 3G1 | ACE |
| 3 | M | 19.88 | 17.54 | Pre | 15 | 105 | 0.34 | Freedom1 | ACE |
| 4 | M | 14.86 | 10.35 | Pre | 5 | 100 | 0.50 | Auria CII2 | Hires |
| 5 | M | 46.97 | 5.25 | Post | 1 | 90 | 10.69 | Spectra1 | SPEAK |
| 6 | F | 57.11 | 29.87 | Post | 0 | 105 | 0.22 | Platinum2 | HiRes 120 |
| 7 | M | 22.33 | 2.05 | Post | 0 | 110 | 1.27 | Freedom1 | ACE |
| 8 | M | 19.77 | 11.51 | Post | 12 | 100 | 1.25 | Esprit 3G1 | ACE |
| 9 | M | 18.50 | 4.61 | Post | 0 | 110 | 0.88 | Esprit 3G1 | ACE |
| 10 | F | 53.03 | 46.00 | Post | 0 | 105 | 0.02 | Freedom1 | ACE |
| 11 | F | 27.84 | 18.17 | Post | 0.25 | 100 | 2.67 | Esprit 3G | ACE |
| 12 | M | 27.08 | 8.68 | Post | 0 | 100 | 0.38 | Auria CII2 | HiRes |
| 13 | F | 45.42 | 15.21 | Post | 0 | 105 | 0.19 | Freedom1 | ACE |
| 14 | F | 19.30 | 8.77 | Post | 1 | 105 | 0.53 | Auria CII2 | HiRes |
| 15 | M | 21.56 | 8.75 | Post | 10 | 110 | 1.81 | Esprit 3G1 | ACE |
| 16 | M | 18.31 | 8.59 | Post | 10 | 100 | 2.72 | Esprit 3G1 | ACE |
| 17 | F | 22.25 | 20.72 | Pre | 2 | 110 | 0.28 | Esprit 3G1 | ACE |
| 18 | F | 20.15 | 18.93 | Pre | 3.5 | >110 | 0.22 | Esprit 3G1 | ACE |
| 19 | M | 29.81 | 0.32 | Post | 0 | 100 | 0.24 | Esprit 3G1 | ACE |
Ten normal-hearing (NH) native speakers of Mandarin Chinese (five females and five males, age 25.80 ± 4.89 years) were recruited from the Ohio University’s faculty and student population. The ten participants were screened to have pure tone thresholds ≤ 20 dB HL at octave frequencies between 250–8000 Hz bilaterally. None of the NH or the CI participants had formal music training.
The use of human participants was reviewed and approved by the Ohio University Institutional Review Board.
Pitch Interval Discrimination Test
In the present study, a pitch interval discrimination test was developed to include the advantages of both the MBEA and the classic adaptive pitch discrimination procedure, as reviewed in the Introduction. Pitch discrimination was measured in a melodic context in an adaptive procedure using a same/different interval discrimination task. Participants used only their CI with their everyday speech processing strategy for the test; none of them wore a contralateral hearing aid during the test. The participants used their everyday use speech processing strategy for the test. A single-interval adjustment-matrix (SIAM) procedure (Kaenbach 1990) was adopted in the pitch interval discrimination test. The procedure used a same-different/yes-no task, which consisted of a random presentation of either signal or noise. In the noise presentation, the same original melody was presented two times and the subject’s task was to determine whether they were the same or different. Responses could be false alarm (i.e., different) or correct rejection (i.e., same). In the signal presentation, one interval contained the original version of a melody, and the other interval contained a modified form of the melody. In the modified form, one note, and always that note, was arbitrarily chosen from the melody to be adaptively changed in F0. The order of the original melody and the modified melody was randomized. The subject’s task was to again determine whether the two intervals were the same or different. Responses could be hit (i.e., different) or miss (i.e., same).
The arbitrarily chosen note in the melody was changed by a ΔF0. The ΔF0 started from 24 semitones (i.e., 2 octaves) for the CI group and 6 semitones (i.e., half an octave) for the NH group. This difference was sufficiently large for both groups to ensure easy discrimination at the beginning of the test. The ΔF0 was adaptively changed based on a payoff matrix: ΔF0 = ΔF0 ×0.75N, where N is 1, −1, −2, and 0 if the subject’s response was hit, miss, false alarm, or correct rejection, respectively. The payoff matrix estimated a 50% point on the psychometric function. The test was completed when 10 reversals occurred. The threshold was taken from the mean of the last 6 reversals. Note that the ΔF0 adapted in such a manner that it created un-true piano notes (i.e., F0 that lies between two adjacent notes), or violated the scale of the melody (i.e., out of the key). It was evident from the study by Cooper et al. (2008), however, that F0 changes that resulted in the violation of melody contour or scale did not have a differential effect on CI users’ performance. Therefore, the step size used in the present test allowed adaptation following an exponential function for a more accurate measurement of threshold.
Pitch interval discrimination was measured in two trials using two different melodies. The final threshold was taken as the mean of the two. The two melodies used were “Twinkle Twinkle Little Star” and “Happy Birthday”. Both melodies are familiar to most native Mandarin-Chinese speakers. A short portion of the melody that forms a complete musical phrase was taken for the test (Twinkle Twinkle Little Star: C3 C3 G3 G3 A3 A3 G3; F0s: 131, 131, 196, 196, 220, 220, and 196 Hz; Happy Birthday: C5 C5 D5 C5 F5 E5; F0s: 524, 524, 588, 524, 699, and 660 Hz). The fifth note of the first melody and the sixth note of the second melody were arbitrarily chosen as the reference notes. The comparison note in the first melody was increased by ΔF0 whereas the comparison note in the second melody was decreased by ΔF0. The two melodies were digitally synthesized using complex tones that mimic the timbre of a piano. The complex tones consisted of a F0 and the first three harmonics. The relative amplitudes of the four components were 1: 0.7: 0.3: 0.1. The temporal envelope of the signals was controlled to decay in 50 ms in a manner that resembles a piano tone. Therefore, the signals were processed to have identical temporal and spectral envelopes (see Nimmons et al. 2008 for details). They were all quarter-notes, each measured 300 ms long.
The discrimination test was conducted for the NH participants in a sound-treated booth. The test was administered via a graphical user interface realized in MATLAB (MathWorks, Natick, MA). The participants responded by clicking the “same” or “different” button on a computer screen. The CI participants were given the test in a quiet room with an ambient noise of ~40 dB SPL. The stimuli were presented at the most comfortable level to the CI participants through a loudspeaker. The CI participants were told that they would hear two melodies. Their task was to discriminate whether the two melodies were the same in pitch or not. The CI participants responded by clicking the buttons on the computer screen labeled with the Chinese words of “same” and “different”.
Lexical Tone Test
The Mandarin-Chinese tone recognition test used 10 monosyllabic syllables (i.e., ‘ma’, ‘ji’, ‘wan’, ‘yi’, ‘fu’, ‘xian’, ‘qi’, ‘yan’, ‘yang’, and ‘xi’) spoken in each of the 4 tones by a female and a male speaker. When recording the stimulus tokens, the speakers produced each tone token multiple times. The F0 range of the tones produced was between 150–350 Hz by the female talker, and 80–250 Hz by the male talker. Only the four tones of each syllable that were equal in duration were chosen as stimuli in order to eliminate duration cues for tone recognition (see Xu et al. 2002 and Zhou & Xu 2008b). A total of 160 tone tokens (4 tones × 10 syllables × 2 speakers × 2 repetitions) were randomly presented to the participants at ~65 dB SPL. A four-alternative forced choice paradigm was used. The test was administered and the responses were collected in a similar fashion as described in the discrimination test in the previous section.
Results
The interval discrimination thresholds obtained from the NH and the CI groups are shown in Figure 1. Three of the 19 CI participants (S17, S18, and 19) were unable to complete the interval discrimination test because they could not perform the task even when the ΔF0 was 2 octaves. The discrimination thresholds of the 16 CI participants were highly variable ranging from 0.8 to 19.6 semitones (mean ± SD: 6.84 ± 6.12 semitones) for the first melody, and from 0.2 to 19.6 semitones (mean ± SD: 4.48 ± 5.73 semitones) for the second melody. Performance for the two melodies did not differ [t (30) = 1.12, p = 0.27], but were significantly correlated [r = 0.76, p = 0.0007]. The averaged thresholds across the two melodies were 5.66 semitones (± 5.57) as presented in Fig. 1. Little variability was seen in the performance of the NH group. Their averaged thresholds were all less than one semitone, ranging from 0.24 to 0.91 semitone (mean ± SD: 0.44 ± 0.20 semitones). The averaged thresholds of the CI and the NH group were significantly different [t (24) = 2.94, p = 0.007]. The CI participants’ ability to discriminate music intervals did not seem to be associated with age, onset of deafness, experience with hearing aid, duration of CI use, or duration of deafness as indicated by test of Pearson’s R (all p > 0.05). There is literature indicating that pitch discrimination skill in children might not fully mature until age of 8 years (Duell & Anderson 1967; Stalinski et al. 2008; Thompson et al. 1999), we compared the interval discrimination thresholds in the CI participants who were hearing impaired before and after the age of 8 years. Our results did not reveal any significant differences [t (14) = 1.29, p = 0.22].
Fig 1.
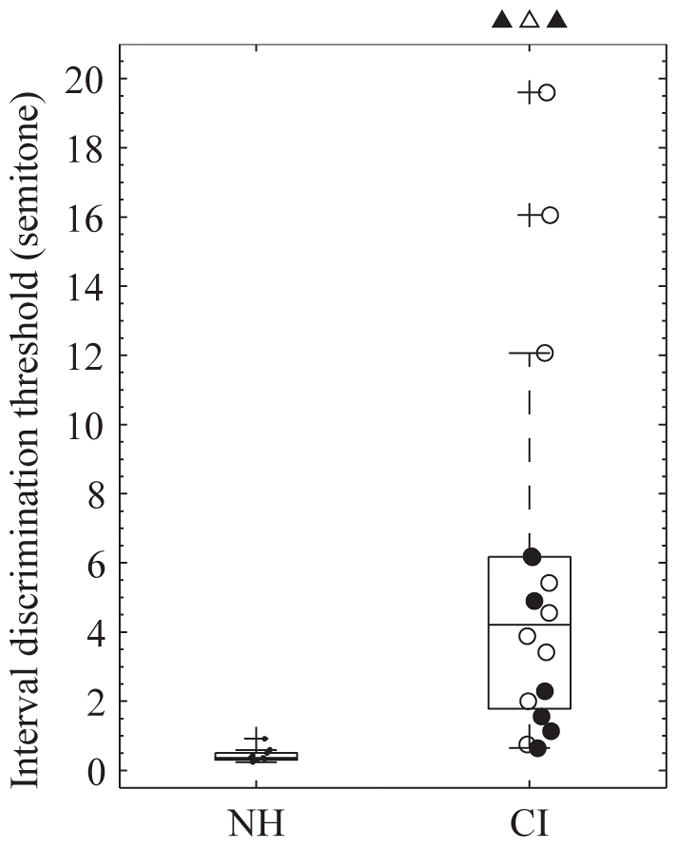
Box plot of the averaged pitch interval discrimination thresholds across two melodies for the 10 normal-hearing participants (NH) and the 19 cochlear implant participants (CI). Each box depicts the lower quartile, median, and upper quartile. The whiskers show the range of the rest of the data. The thresholds for the CI participants who had worn a hearing aid for more than one year are plotted with filled symbols, and those for the CI participants who had little (≤ 1 year) or no hearing aid experiences are plotted with open symbols. The three triangles plotted at the top represent the three CI participants who could not perform the interval discrimination test even at a ΔF0 of 2 octaves.
All 19 CI participants completed the Mandarin-Chinese tone perception test. A wide range of scores were obtained ranging from 12.5 – 86.8% correct (mean ± SD: 58.3% ± 19.78% correct). The NH group scored nearly perfectly on this test (mean ± SD: 97.3% ± 1.32% correct), which was significantly better than the CI group [t (27) = 6.17, p < 0.0001] (see Fig. 2). The CI participants who had hearing aid experience of more than one year before implantation (Fig. 2, solid circles, n = 9) performed significantly better in the tone perception test than those who had not (Fig. 2, open circles, n = 10) (Wilcoxon rank sum test, p = 0.0456). No statistical difference was found between the 5 prelingually-deafened participants (60.4% correct) and the 14 postlingually-deafened participants (57.6% correct) (Wilcoxon rank sum test, p > 0.05). No difference in tone perception performance was found between the CI participants who were hearing impaired before and after 8 years of age [t (17) = −0.89, p = 0.38].
Fig 2.
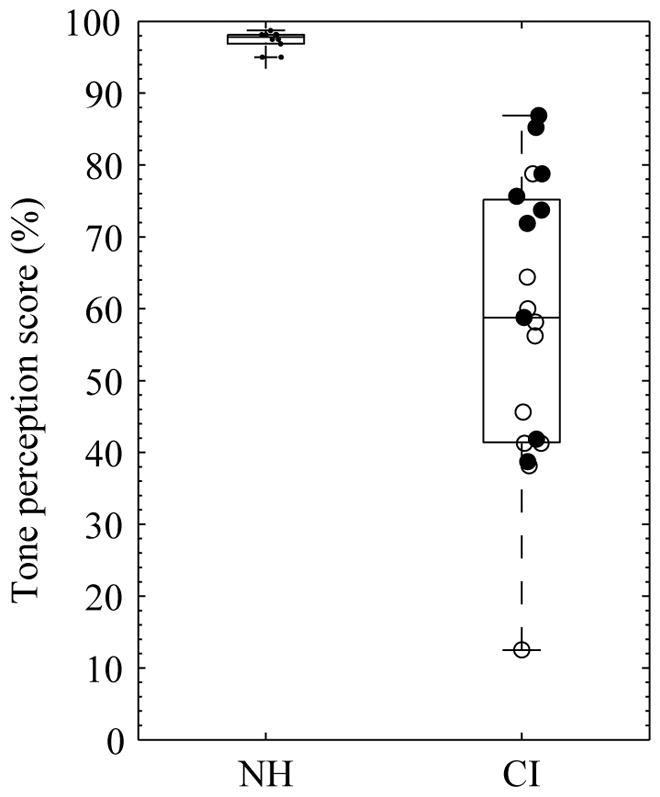
Box plot of the Mandarin-Chinese tone perception scores. Percent correct scores of the 10 NH and 19 CI participants are plotted. Each box depicts the lower quartile, median, and upper quartile. The whiskers show the range of the rest of the data. Thresholds from the CI participants who had worn a hearing aid for more than one year are plotted in filled circles, and thresholds from those who had little (≤ 1 year) or no hearing aid experience are in open circles.
The confusion matrices of the responses by the NH and CI groups are shown in Fig. 3. Tone 2 (rising tone) was significantly more poorly recognized than tone 3 and tone 4 in the CI participants (p < 0.0083, Bonferroni corrected). No difference in performance was found in the NH group for any tone pairs (p > 0.0083).
Fig 3.
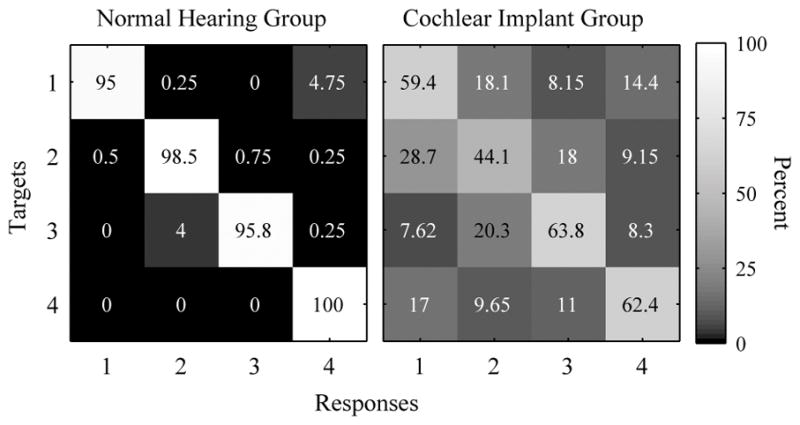
Confusion matrices of tone perception by the NH and the CI groups. The value in the cell of row j and column k is the percent of times stimulus tone j was recognized as tone k (j = 1, 2, 3 or 4; k = 1, 2, 3, 4). The gray scale in each cell reflects the value in it with reference to the color bar on the right.
Figure 4 shows that the CI participants’ tone perception performance was negatively correlated with their duration of deafness (r = −0.46, p = 0.049), age (r = −0.62, p = 0.005), and positively correlated with duration of hearing aid use (r = 0.63, p = 0.004) revealed by Pearson’s R. The three variables were entered into a forward multi-variant linear regression model. The duration of hearing aid use was the first to enter into the model, because of its strongest correlation with the dependent variable. When the duration of hearing aid use was partialed out, duration of deafness accounted for significant unique variance in the tone perception performance (p = 0.02). Age was excluded from the model because of its shared variance with duration of hearing aid use (r = −0.48, p = 0.04). Jointly, duration of hearing aid use and duration of deafness explained 56.8% of the total variance in tone perception by the CI users [F (2) = 10.52, p = 0.001].
Fig 4.

Correlation between tone perception scores and demographic variables of the CI participants. Pearson’s linear correlation between tone perception scores and duration of deafness (left), age (middle), and duration of hearing aid use (right). Each symbol represents one subject with a CI. The solid line represents the linear fit of the data in each panel.
A correlational analysis was also performed for the 16 CI participants who completed both the pitch interval discrimination test and the tone perception test. Since melody one tested the frequency within the voice pitch range and the other one tested higher frequency region, thresholds measured from the two melodies were correlated separately with the tone perception performance. A highly significant negative correlation was shown between both pitch interval discrimination thresholds and the tone perception performance in the CI participants (melody one: r = −0.67, p< 0.001; melody two: r = −0.73, p< 0.001). The averaged pitch discrimination thresholds were significantly correlated with tone perception performance as well (r = −0.75, p< 0.001) (Fig. 5).
Fig 5.
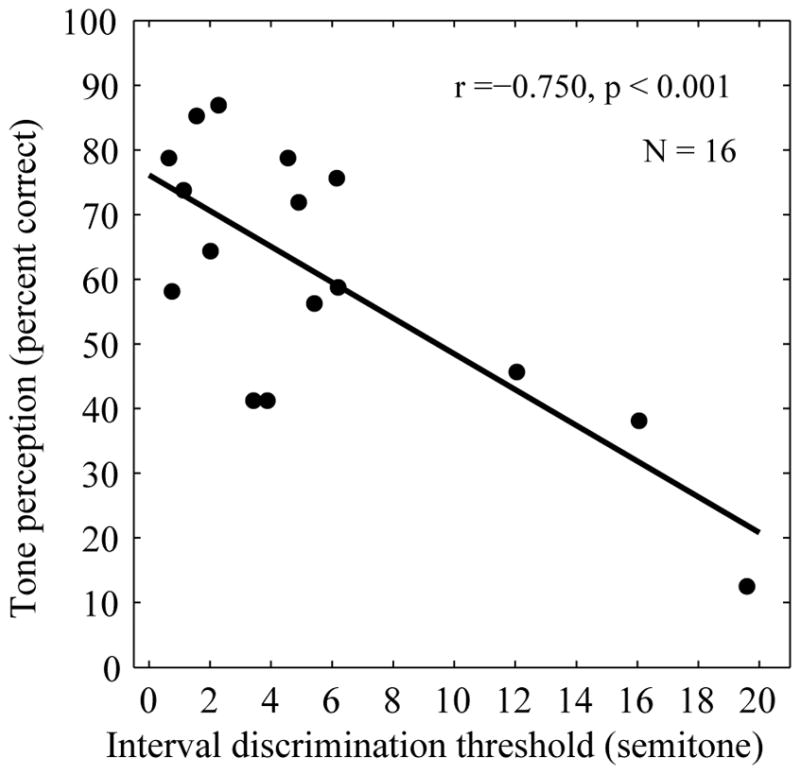
Correlation between tone perception scores and averaged pitch interval discrimination thresholds in CI participants. Each symbol represents one subject with a CI. The solid line represents the linear fit of the data.
Discussion
Pitch Interval Discrimination
The ten NH participants all had pitch interval discrimination thresholds less than one semitone. The NH group also showed little variability in performance as compared to the CI group. The small variability indicated that the test was reliable in measuring pitch interval discrimination. Three of the CI participants were not able to complete the pitch interval discrimination test (Fig. 1). They reported that all of the notes sounded like monotonic beats. Discrimination thresholds obtained from the 16 CI participants who completed the task showed large individual variability. Two of the CI participants had thresholds in the range of NH listeners. Direct comparison of the absolute threshold values with some other studies may not be informative, since very different methods were used. Previous studies that used adaptive procedures (e.g., Gfeller et al. 2002; Nimmons et al. 2008; Kang et al. 2009) set the smallest test interval to be one semitone, because it is the smallest interval size on the piano and in the scales for Western music. Gfeller et al. (2002) reported that 16% of their CI participants (8 out of 49) scored in the range of 1–2 semitones. Nimmons et al. (2008) also reported that although the smallest tested interval was 1 semitone, the true difference limens of some CI users were less than 1 semitone as suggested by their psychometric curves. Those results and the findings of the present study seem to suggest that pitch discrimination ability in a small portion of CI users is comparable to that of the NH listeners. Findings from the pitch ranking studies, however, generally indicate that, on average, the CI users could not rank pitches that are one semitone apart (e.g., Looi et al. 2008; Sucher & McDermott 2007). It was expected though that the same/different paradigm used in the present study would result in relatively lower threshold as CI users were asked how the two melodies were different. Our method could not detect pitch reversals (i.e., consistently ranking the higher F0 signal as lower in pitch, and vice versa) that sometimes occur in CI users (e.g., Collins et al. 1997).
In the present study, the pitch discrimination thresholds were tested using two melodies. Firstly, the two reference notes were chosen from different positions in the two melody phrases. One was in the middle of a 7-note sequence, while the other was the very end of a 6-note sequence. One might reason that the users had more contextual cues to detect a pitch change in the middle of a melody sequence than if the note changed was at the end of the sequence. However, the thresholds for the two melodies did not seem to differ, the position of the modified notes may not have affected the performance. Secondly, the two melodies were in two different frequency ranges, one within the voice pitch range, and the other higher. Participants could have showed different frequency discrimination thresholds at different frequency regions, since different mechanisms of pitch perception might have been used by the implant users, which will be elaborated further in the following section.
The ability assessed by the test used in the present study was discrimination. That is, the participants were only required to determine whether the two melodies were the same or different. The ability to discriminate two notes does not imply that the notes differ only in one predetermined characteristic, such as pitch. In other words, the participants may use any perceptible differences between the melodies to perform the task although the music stimuli were controlled to have the identical timbre and loudness. In addition, the participants were instructed to ignore any perceived differences in loudness or other characteristics of the melodies, and just focus on whether the two melodies contrasted in pitch. It should be noted that it could still be challenging for some of the participants who might not understand the concept of pitch. While the psychophysical procedure (i.e., the SIAM paradigm) used in the present study provided an unbiased procedure that controlled for the knowledge or familiarity with the melodies tested, we should acknowledge the potential caveats of such a procedure in measuring pitch perception ability.
Previous studies suggested that familiar melody recognition was weakly associated with CI users’ chronological age and length of deafness (Gfeller et al. 2002). Pitch ranking has been associated with age, length of deafness (Gfeller et al. 2007) and duration of implant use (Leal et al. 2003; Gfeller et al. 2007). It is interesting to note that although many of these factors were found to contribute to lexical tone perception in this study (see below), none of these relationships were observed for the pitch interval discrimination task.
Mandarin-Chinese Tone Perception
The lexical tone performance amongst the CI participants was highly variable as well. None of the CI participants achieved recognition scores close to the performance of the NH participants (Fig. 2). Tone 2 was the most poorly recognized tone by the CI participants, who seemed to have difficulties perceiving the rising contour, and often confused it with a flat one. Literature has suggested that children with CIs have particular difficulties producing the rising tone (e.g., Han et al. 2007; Zhou and Xu, 2008a). It was not clear whether the poor production was a result of the poor perception of the contour, or if production of a rising pitch is more difficult. Wei et al. (2007) found that postlingually-deafened implant users generally performed better than the prelingually-deafened users in tone perception. However, we did not see significant differences between the two types of CI participants in the present study. Our participants performed at a level comparable to that of the prelingually-deafened Mandarin-speaking children reported in the previous studies (e.g., Peng et al. 2004; Xu et al. 2009).
Previous studies (Wei et al. 2004, 2007; Luo et al. 2008) have shown that children with CIs seemed to be able to acquire tone better if they received implants at an early age or have had more experience with the device (e.g., Han et al. 2007, 2009; Xu et al. 2009; Lee et al. 2010). For postlingually-deafened CI users, tone recognition was associated with psychophysical measures such as amplitude modulation detection, gap detection, and frequency discrimination. Our results suggested that tone recognition performance in CI users was also associated with some demographic variables. Duration of deafness and experience with hearing aid use accounted for approximately 57% of the variance as revealed by the regression analysis. Overall, the CI participants who had used a hearing aid for more than one year scored significantly better than those who had not. Further, participants with a shorter duration of deafness seemed to perform better. This result is consistent with the findings by Rubinstein and colleagues that duration of deafness is a key factor that predicts the postoperative cochlear implant performance (Rubinstein et al. 1999; Gomaa et al. 2003).
The confusion matrix of tone perception suggested that Mandarin tone 2 was recognized with the lowest accuracy by the CI listeners (Fig. 3). Most of the confusions for tones 2 and 4 were with tone 1. This may due to the lack of pitch variation represented by CIs that caused all tones to sound flat in pitch. Tone 3, which has the most dramatic change in the pitch contour, did not elicit false alarm rates of tone 1 as often as the other tones. It should be noted, however, that the overall amplitude contour that correlates well with the F0s is likely to provide cues for tone recognition as well (Zhou & Xu 2008b). This point is elaborated more in the following section.
Mechanisms of Musical and Lexical Tone Perception
The primary cue for music perception and lexical tone perception is the F0 and the harmonics of the signal (e.g., Xu et al. 2002; Xu & Pfingst 2003). Current CI technology has not yet supported transmitting explicit F0 by a place code. Vocoder studies have shown that as many as 30 channels were necessary to achieve tone recognition accuracy close to the level of unprocessed signals, and even more channels were required for music perception (Kong et al. 2004, 2006).
In electric hearing, multichannel CI users may perceive musical pitch in two fundamental ways. The primary mechanism relies on rapid temporal fluctuation in electric stimulations. Although varying the stimulation rate of the pulse trains on a single electrode results in a change of the perceived pitch, modern CIs typically do not vary stimulation rate in the speech processing strategies (e.g., Moore & Carlyon 2005) except for the recent Fine Structure Coding Strategy (FSP) launched by Med-El that changes the instantaneous stimulation rate in the apical electrodes (Arnoldner et al. 2007; Riss et al. 2008). This strategy was not used by our participants and was not applicable to the present study. Typically, constant high-rate pulse trains are modulated by the temporal envelopes of the signals. Weak pitch percepts have been shown to be related to amplitude modulation frequencies up to 300 Hz. Musical pitch can be perceived via temporal patterns in amplitude modulation over a relatively low range (e.g., Mckay et al. 1994; McKay 2004). Place pitch is associated with the place where the electrical stimulation is delivered. When place and rate of stimulation were co-varied, evidence from McDermott and McKay (1997) supported the notion that changes in the place of stimulation dominated the perception of musical pitch. However, considerable variation has been found in the pitch-place relationship in CI users. For example, pitch reversals were reported along with irregular pitch differences being perceived along adjacent electrode pairs (e.g., Collins et al. 1997).
Two melodies, one within voice pitch range, one above, were tested in the present study. Perception of the melody within the voice pitch range was likely dependent on a temporal mechanism by detecting modulations in the temporal envelope. However, because there is a limitation that most CI users can detect modulations only up to 300 Hz, perception of the high-frequency melody that was based around C5 (524 Hz) may have relied more on a place mechanism. Presumably place pitch is poorly represented in current CIs due to limited frequency resolution. It was expected that performance of the high-frequency melody was lower than that of the low-frequency melody. However this was not supported by the data. Kang et al. (2009) tested pitch direction discrimination using synthesized piano notes in 42 CI users at three base frequencies (i.e., C4 at 262 Hz, E4 at 330 Hz, and G4 at 392 Hz) and also found no differences in performance among the three base frequencies. One possibility is that some of the participants in our study could have poor abilities in modulation detection impeding their ability to use temporal pitch patterns. Therefore, the performance on the low-frequency melody may be poorer than expected, resulting in no contrast in performance between the two melodies. Another possibility is that some participants did just as well with the high-frequency melody by using intermediate pitch perception. Research has shown that intermediate pitch perception is possible by simultaneous or near-simultaneous activation of adjacent electrodes (Donaldson & Kreft, 2005; Pretorius & Hanekom, 2008). The interval size required for the two musical tones to cause discriminable excitation at different places can vary largely amongst individuals due to varying electrode-neurons distances and/or neural survival patterns. Nonetheless, for those who were able to discriminate relatively small interval sizes (< 1 semitone) for the high-frequency melody, the pitch difference was not likely perceived through a place code.
Lexical tone information is likely to be supported primarily through a temporal code. First, a limited range of voice pitch may be conveyed by the periodicity in the temporal envelopes, typically below 250–300 Hz. Another temporal cue for tone perception is the overall amplitude contour that correlates with the F0 contour, which has been shown to play an important role in lexical tone perception (Whalen & Xu 1992; Luo & Fu 2004; Zhou & Xu 2008b). For example, the amplitude contour of a falling tone (i.e., tone 4) decays over time. This is a unique phenomenon for speech signals in that features (i.e., F0 and amplitude contour) could correlate because they are the acoustic products of one articulatory gesture. Luo and Fu (2004) showed that, with acoustic simulation of a CI, Mandarin-Chinese tone perception could be enhanced by manipulating the overall amplitude contours to resemble that of the F0s. We have also shown in our previous study that the overall amplitude contour cue weights considerably in conditions of basal spectral shift (Zhou & Xu 2008b).
The strong correlation between the pitch discrimination threshold and tone recognition performance appears to indicate that the perception of musical pitch and lexical tones share a somewhat similar mechanism. It was not clear exactly what supported good discrimination thresholds by some participants when perceiving the high-frequency melody. It was possible that within certain frequency range (i.e., below 300 Hz), perception of musical and lexical tone pitch both rely on the extraction of the periodicity in the temporal envelope modulation.
Deutsch et al. (2006) demonstrated that absolute pitch is more prevalent in tonal language speaking than in non-tonal language speaking musicians, suggesting a relationship between musical and voice pitch perception in acoustic hearing. Lee and Lee (2010) examined tone identification using tone stimuli that were onset-only, isolated, multispeaker Mandarin tones. They reported, however, no correlation between the tone identification performance and the absolute pitch ability in Mandarin-speaking musicians. It is not known in acoustic hearing, whether non-musician Mandarin-speaking listeners would show better musical pitch discrimination if they also do better in more difficult tone perception tasks. It is interesting that in electric hearing, such a relationship between musical and voice pitch perception was observed, where explicit pitch information is not provided. It still remains to be tested though, whether such a relationship holds true for pitch discrimination at other frequencies than the ones that were tested in the present study. The music stimuli used in the present study were synthesized musical tones while the lexical tone stimuli were naturally spoken real world words. Although the synthesized musical stimuli were well controlled to eliminate confounding characteristics such as duration, loudness, and timbre, future research could trial natural piano or instrumental noises, or sung vowels.
Conclusions
In summary, the mean pitch discrimination interval for the Mandarin-Chinese speaking CI users in this study was approximately 6 semitones, although results ranged from 0.65 – 19.60 semitones. The Mandarin-Chinese tone perception performance also varied greatly (12.5 – 86.9 % correct, mean = 58.3% correct), and was correlated with the participants’ duration of deafness and duration of hearing aid use. Most importantly, the present study provided new data that suggest a strong correlation between musical pitch perception and lexical tone perception for implantees using the conventional enveloped-based strategies. Our results support the hypothesis that musical and lexical tone perception share similar mechanisms in electrical hearing. Thus, strategies aimed at improving lexical tone perception could benefit musical perception in CI users, and vice versa.
Acknowledgments
The authors thank Dr. Dennis Ries for providing valuable insights in the construction of the psychophysical procedures for the pitch interval discrimination test. Heather Schultz provided technical assistance in the preparation of the manuscript. The study was supported, in part, by NIH NIDCD Grants R03-DC006161 (Xu), R15-DC009504 (Xu), and F31-DC009919 (Zhou).
Abbreviations
- CI
Cochlear implant
- F0
fundamental frequency
- NH
normal-hearing
Footnotes
Declaration of interest: The authors report no conflicts of interest. The authors alone are responsible for the content and writing of the paper.
References
- Arnoldner C, Riss D, Brunner M, Durisin M, Baumgartner WD, et al. Speech and music perception with the new fine structure speech coding strategy: Preliminary results. Acta Otolaryngol. 2007;127:1298–1303. doi: 10.1080/00016480701275261. [DOI] [PubMed] [Google Scholar]
- Ciocca V, Francis AL, Aisha R, Wong L. The perception of Cantonese lexical tones by early-deafened cochlear implantees. J Acoust Soc Am. 2002;111:2250–2256. doi: 10.1121/1.1471897. [DOI] [PubMed] [Google Scholar]
- Collins LM, Zwolan TA, Wakefield GH. Comparison of electrode discrimination, pitch ranking, and pitch scaling data in postlingually deafened adult cochlear implant subjects. J Acoust Soc Am. 1997;101:440–455. doi: 10.1121/1.417989. [DOI] [PubMed] [Google Scholar]
- Cooper WB, Tobey E, Loizou PC. Music perception by cochlear implant and normal hearing listeners as measured by the Montreal Battery for Evaluation of Amusia. Ear Hear. 2008;29:618–626. doi: 10.1097/AUD.0b013e318174e787. [DOI] [PMC free article] [PubMed] [Google Scholar]
- Drennan WR, Longnion JK, Ruffin C, Rubinstein JT. Discrimination of Schroeder-phase harmonic complexes by normal-hearing and cochlear-implant listeners. J Assoc Res Otolaryngol. 2008;9:138–149. doi: 10.1007/s10162-007-0107-6. [DOI] [PMC free article] [PubMed] [Google Scholar]
- Deutsch D, Henthorn T, Marvin E, Xu H. Absolute pitch among American and Chinese conservatory studies: Prevalence differences, and evidence for a speech-related critical period. J Acoust Soc Am. 2006;118:623–626. doi: 10.1121/1.2151799. [DOI] [PubMed] [Google Scholar]
- Donaldson GS, Kreft HA. Place-pitch discrimination of single-versus dual-electrode stimuli by cochlear implant users. J Acoust Soc Am. 2005;119:719–722. doi: 10.1121/1.1937362. [DOI] [PubMed] [Google Scholar]
- Duell OK, Anderson RC. Pitch discrimination among primary school children. J Edu Psychol. 1967;58:315–318. doi: 10.1037/h0025223. [DOI] [PubMed] [Google Scholar]
- Eddington DK, Dobelle WH, Brackmann DE, Mladejovsky MG, Parkin JL. Auditory prostheses research with multiple channel intracochlear stimulation in man. Ann Otol Rhinol Laryngol. 1978;87(Suppl 53):5–39. [PubMed] [Google Scholar]
- Fishman KE, Shannon RV, Slattery WH. Speech recognition as a function of the number of electrodes used in the SPEAK cochlear implant speech processor. J Speech Lang Hear Res. 1997;40:1201–1215. doi: 10.1044/jslhr.4005.1201. [DOI] [PubMed] [Google Scholar]
- Friesen LM, Shannon RV, Baskent D, Wang X. Speech recognition in noise as a function of the number of spectral channels: Comparison of acoustic hearing and cochlear implants. J Acoust Soc Am. 2001;110:1150–1163. doi: 10.1121/1.1381538. [DOI] [PubMed] [Google Scholar]
- Fujita S, Ito J. Ability of nucleus cochlear implantees to recognize music. Ann Otol Rhinol Laryngol. 1999;108:634–640. doi: 10.1177/000348949910800702. [DOI] [PubMed] [Google Scholar]
- Galvin JJ, Fu QJ, Nogaki G. Melodic contour identification by cochlear implant listeners. Ear Hear. 2007;28:302–319. doi: 10.1097/01.aud.0000261689.35445.20. [DOI] [PMC free article] [PubMed] [Google Scholar]
- Gfeller K, Turner C, Mehr M, Woodworth G, Fearn R, et al. Recognition of familiar melodies by adult cochlear implant recipients and normal-hearing adults. Cochlear Implant Int. 2002;3:29–53. doi: 10.1179/cim.2002.3.1.29. [DOI] [PubMed] [Google Scholar]
- Gfeller K, Turner C, Oleson J, Zhang XY, Gantz B, et al. Accuracy of cochlear implant recipients on pitch perception, melody recognition, and speech reception in noise. Ear Hear. 2007;28:412–23. doi: 10.1097/AUD.0b013e3180479318. [DOI] [PubMed] [Google Scholar]
- Gfeller K, Olszewski C, Turner C, Bruce G, Jacob O. Music perception with cochlear implants and residual hearing. Audiol Neurotol. 2006;11(suppl 1):12–15. doi: 10.1159/000095608. [DOI] [PubMed] [Google Scholar]
- Gomaa NA, Rubinstein JT, Lowder MW, Tyler RS, Gantz BJ. Residual speech perception and cochlear implant performance in postlingually deafened adults. Ear Hear. 2003;24:539–544. doi: 10.1097/01.AUD.0000100208.26628.2D. [DOI] [PubMed] [Google Scholar]
- Han D, Zhou N, Li Y, Chen X, Zhao X, et al. Tone production of Mandarin-Chinese-speaking children with cochlear implants. Int J Pediatr Otorhinolaryngol. 2007;71:875–880. doi: 10.1016/j.ijporl.2007.02.008. [DOI] [PMC free article] [PubMed] [Google Scholar]
- Han D, Liu B, Zhou N, Chen X, Kong Y, et al. Lexical tone perception with HiResolution® 120 speech-processing strategy in mandarin-speaking children. Ear Hear. 2009;30:169–177. doi: 10.1097/AUD.0b013e31819342cf. [DOI] [PMC free article] [PubMed] [Google Scholar]
- Kaenbach C. A single-interval adjustment-matrix (SIAM) procedure for unbiased adaptive testing. J Acoust Soc Am. 1990;88:2645–2655. doi: 10.1121/1.399985. [DOI] [PubMed] [Google Scholar]
- Kang R, Nimmons GL, Drennan W, Longnion L, Ruffin C, et al. Development and validation of the University of Washington Clinical Assessment of Music Perception test. Ear Hear. 2009;30:411–418. doi: 10.1097/AUD.0b013e3181a61bc0. [DOI] [PMC free article] [PubMed] [Google Scholar]
- Kong YY, Cruz R, Jones JA, Zeng FG. Music perception with temporal cues in acoustic and electric hearing. Ear Hear. 2004;25:173–185. doi: 10.1097/01.aud.0000120365.97792.2f. [DOI] [PubMed] [Google Scholar]
- Kong YY, Zeng FG. Temporal and spectral cues in Mandarin tone recognition. J Acoust Soc Am. 2006;120:2830–2840. doi: 10.1121/1.2346009. [DOI] [PubMed] [Google Scholar]
- Lassaletta L, Castro A, Bastarrica M, Perez-Mora R, Madero R, et al. Does music perception have an impact on quality of life following cochlear implantation? Acta Otolaryngol. 2007;127:682–686. doi: 10.1080/00016480601002112. [DOI] [PubMed] [Google Scholar]
- Leal MC, Shin YJ, Laborde ML, Calmels MN, Verges S, et al. Music perception in adult cochlear implant recipients. Acta Otolaryngol. 2003;123:826–835. doi: 10.1080/00016480310000386. [DOI] [PubMed] [Google Scholar]
- Lee CY, Lee YF. Perception of musical pitch and lexical tones by Mandarin-speaking musicians. J Acoust Soc Am. 2010;127:481–490. doi: 10.1121/1.3266683. [DOI] [PubMed] [Google Scholar]
- Lee KYS, van Hasselt CA, Chiu SN, Cheung DMC. Cantonese tone perception ability of cochlear implant children in comparison with normal-hearing children. Int J Pediatr Otorhinolaryngol. 2002;63:137–147. doi: 10.1016/s0165-5876(02)00005-8. [DOI] [PubMed] [Google Scholar]
- Lee KYS, van Hasselt CA, Tong MCF. Age sensitivity in the acquisition of lexical tone production: Evidence from children with profound congenital hearing impairment after cochlear implantation. Ann Otol Rhinol Laryngol. 2010;119:258–265. doi: 10.1177/000348941011900409. [DOI] [PubMed] [Google Scholar]
- Looi V, McDermott H, McKay C, Hickson L. Music perception of cochlear implant users compared with that of hearing aid users. Ear Hear. 2008;29:421–434. doi: 10.1097/AUD.0b013e31816a0d0b. [DOI] [PubMed] [Google Scholar]
- Luo X, Fu Q. Enhancing Chinese tone recognition by manipulating amplitude envelope: Implications for cochlear implant. J Acoust Soc Am. 2004;116:3659–3667. doi: 10.1121/1.1783352. [DOI] [PubMed] [Google Scholar]
- Luo X, Fu QJ, Wei CG, Cao KL. Speech recognition and temporal amplitude modulation processing by Mandarin-speaking cochlear implant users. Ear Hear. 2008;29:957–970. doi: 10.1097/AUD.0b013e3181888f61. [DOI] [PMC free article] [PubMed] [Google Scholar]
- McDermott HJ, McKay CM. Musical pitch perception with electrical stimulation of the cochlea. J Acoust Soc Am. 1997;101:1622–1631. doi: 10.1121/1.418177. [DOI] [PubMed] [Google Scholar]
- McKay CM, McDermott HJ, Clark GM. Pitch percepts associated with amplitude-modulated current pulse trains in cochlear implantees. J Acoust Soc Am. 1994;96:2664–2673. doi: 10.1121/1.411377. [DOI] [PubMed] [Google Scholar]
- McKay CM. Springer Handbook of Auditory Research: Auditory prostheses. New York: Springer-Verlag; 2004. Psychophysics and electrical stimulation. [Google Scholar]
- Moore BCJ. Coding of sounds in the auditory system and its relevance to signal processing and coding in cochlear implants. Otol Neurotol. 2003;24:243–254. doi: 10.1097/00129492-200303000-00019. [DOI] [PubMed] [Google Scholar]
- Moore BCJ, Carlyon RP. Perception of pitch by people with cochlear hearing loss and by cochlear implant users. Pitch: Neural Coding and Perception. 2005;24:234–277. [Google Scholar]
- Nimmons GL, Kang RS, Drennan WR, Longnion J, Ruffin C, et al. Clinical assessment of music perception in cochlear implant listeners. Otol Neurotol. 2008;29:149–155. doi: 10.1097/mao.0b013e31812f7244. [DOI] [PMC free article] [PubMed] [Google Scholar]
- Peng SC, Tomblin JB, Cheung HT, Lin YS, Wang LS. Perception and production of mandarin tones in prelingually deaf children with cochlear implants. Ear Hear. 2004;25:251–264. doi: 10.1097/01.aud.0000130797.73809.40. [DOI] [PubMed] [Google Scholar]
- Pretorius LL, Hanekom JJ. Free field frequency discrimination abilities of cochlear implant users. Hear Res. 2008;244:77–84. doi: 10.1016/j.heares.2008.07.005. [DOI] [PubMed] [Google Scholar]
- Rubinstein JT, Parkinson WS, Tyler RS, Gantz BJ. Residual speech recognition and cochlear implant performance: Effects of implantation criteria. Am J Otol. 1999;20:445–452. [PubMed] [Google Scholar]
- Riss D, Arnoldner C, Baumgartner WD, Kaider A, Hamzavi JS. A new fine structure speech coding strategy: Speech perception at a reduced number of channels. Otol Neurotol. 2009;29:784–788. doi: 10.1097/MAO.0b013e31817fe00f. [DOI] [PubMed] [Google Scholar]
- Shannon RV. Multichannel electrical stimulation of the auditory nerve in man. I. Basic psychophysics. Hear Res. 1983;11:157–189. doi: 10.1016/0378-5955(83)90077-1. [DOI] [PubMed] [Google Scholar]
- Stalinski SM, Schellenberg EG, Trehub SE. Developmental changes in the perception of pitch contour: distinguishing up from down. J Acoust Soc Am. 2008;124:1759–1763. doi: 10.1121/1.2956470. [DOI] [PubMed] [Google Scholar]
- Sucher CM, McDermott HJ. Pitch ranking of complex tones by normally hearing subjects and cochlear implant users. Hear Res. 2007;230:80–87. doi: 10.1016/j.heares.2007.05.002. [DOI] [PubMed] [Google Scholar]
- Swanson B, Dawson P, McDermott H. Investigating cochlear implant place-pitch perception with the Modified Melodies test. Cochlear Implants Int. 2009;10(S1):100–104. doi: 10.1179/cim.2009.10.Supplement-1.100. [DOI] [PubMed] [Google Scholar]
- Thompson NC, Cranford JL, Hoyer E. Brief-Tone Frequency Discrimination by Children. J Speech Lang Hear Res. 1999;42:1061–1068. doi: 10.1044/jslhr.4205.1061. [DOI] [PubMed] [Google Scholar]
- Tong YC, Clark GM. Absolute identification of electric pulse rates and electrode positions by cochlear implant patients. J Acoust Soc Am. 1985;77:1881–1888. doi: 10.1121/1.391939. [DOI] [PubMed] [Google Scholar]
- Townshend B, White RL. Reduction of electrical interaction in auditory prostheses. IEEE Trans Biomed Eng. 1987;34:891–897. doi: 10.1109/tbme.1987.326102. [DOI] [PubMed] [Google Scholar]
- Whalen DH, Xu Y. Information for Mandarin tones in the amplitude contour and in brief segments. Phonetica. 1992;49:25–47. doi: 10.1159/000261901. [DOI] [PubMed] [Google Scholar]
- Wei CG, Cao KL, Jin X, Chen XW, Zeng FG, et al. Psychophysical performance and Mandarin tone recognition in noise by cochlear implant users. Ear Hear. 2007;28:62S–65S. doi: 10.1097/AUD.0b013e318031512c. [DOI] [PMC free article] [PubMed] [Google Scholar]
- Wei CG, Cao KL, Zeng FG. Mandarin tone recognition in cochlear-implant subjects. Hear Res. 2004;197:87–95. doi: 10.1016/j.heares.2004.06.002. [DOI] [PubMed] [Google Scholar]
- Won JH, Drennan WR, Rubinstein JT. Spectral-ripple resolution correlates with speech reception in noise in cochlear implant users. J Assoc Res Otolaryngol. 2007;8:384–392. doi: 10.1007/s10162-007-0085-8. [DOI] [PMC free article] [PubMed] [Google Scholar]
- Wong AOC, Wong LLN. Tone perception of Cantonese-speaking prelingually hearing-impaired children with cochlear implants. Otolaryngol Head Neck Surg. 2004;130:751–758. doi: 10.1016/j.otohns.2003.09.037. [DOI] [PubMed] [Google Scholar]
- Xu L, Pfingst BE. Relative importance of temporal envelope and fine structure in lexical-tone perception. J Acoust Soc Am. 2003;114:3024–3027. doi: 10.1121/1.1623786. [DOI] [PMC free article] [PubMed] [Google Scholar]
- Xu L, Pfingst BE. Spectral and temporal cues for speech recognition: Implications for auditory prostheses. Hear Res. 2008;242:132–140. doi: 10.1016/j.heares.2007.12.010. [DOI] [PMC free article] [PubMed] [Google Scholar]
- Xu L, Thompson CS, Pfingst BE. Relative contributions of spectral and temporal cues for phoneme recognition. J Acoust Soc Am. 2005;117:3255–3267. doi: 10.1121/1.1886405. [DOI] [PMC free article] [PubMed] [Google Scholar]
- Xu L, Tsai Y, Pfingst BE. Features of stimulation affecting tonal-speech perception: Implications for cochlear prostheses. J Acoust Soc Am. 2002;112:247–258. doi: 10.1121/1.1487843. [DOI] [PMC free article] [PubMed] [Google Scholar]
- Xu L, Zhou N, Huang J, Chen X, Li Y, et al. Lexical tone development in prelingually-deafened children with cochlear implants. Presented at Conference on Implantable Auditory Prostheses; Lake Tahoe, CA. July.2009. [Google Scholar]
- Zeng FG. Temporal pitch in electric hearing. Hear Res. 2002;174:101–106. doi: 10.1016/s0378-5955(02)00644-5. [DOI] [PubMed] [Google Scholar]
- Zhou N, Xu L. Development and evaluation of methods for assessing tone production skills in Mandarin-speaking children with cochlear implants. J Acoust Soc Am. 2008a;123:1653–1664. doi: 10.1121/1.2832623. [DOI] [PMC free article] [PubMed] [Google Scholar]
- Zhou N, Xu L. Lexical tone recognition with spectrally mismatched envelopes. Hear Res. 2008b;246:36–43. doi: 10.1016/j.heares.2008.09.006. [DOI] [PMC free article] [PubMed] [Google Scholar]